


1 引 言
作物出苗是影响田间管理决策的重要农艺因素,通过监测出苗情况可在正确的时间进行补种以减少损失[1]。传统上,通常通过用少数采样点进行目视观察(人工计数)来估测作物出苗数量[2],既费时又费力,无法覆盖大的生产领域。随着图像获取方式的进步,计算机视觉技术在作物生长检测中的应用[3-6]得到了广泛的关注。获取高分辨率的特定地点作物出苗信息是实施精确田间管理的基础。同时,准确的作物出苗信息可用于了解土壤和环境对作物出苗的影响[7]。因此,为提高监测效率,近距离遥感技术被用来评估作物出苗情况。基于无人机图像数据进行的出苗检测方法,在各种作物中得到了广泛的应用[8]。目前使用无人机对作物出苗的研究主要集中在出苗数量和均匀性上[9]。
近年来,随着卷积神经网络的发展,深度学习已在自然语言处理[12]、图像识别[13]、视频跟踪[14]等领域超越了传统的机器学习算法。在农业领域,卷积神经网络较强的图像特征提取能力也使越来越多的研究人员将深度学习应用于作物表型信息获取[15]、遥感影像分类[16]等领域。深度学习模型已经用于从无人机、地面机器人系统收集的图像数据集中提取隐藏信息,以监测作物发育[17]和预测产量[18]。一些流行的深度学习模型AlexNet[19]、VGG[20]、GoogleNet[21]和ResNet[22]等被用于处理农业中的复杂数据。基于卷积神经网络的目标检测算法如YOLO[23]和SSD[24]一阶检测器系列和Faster R-CNN[25]两阶检测系列已被证实在对作物出苗检测上取得了不错的效果。
根据以上分析,本研究目的是利用田间作物表型平台获取的高时序、连续可见光图像以及无人机平台获取的可见光图像构建数据集,提出基于卷积神经网络(Convolutional Neural Network,CNN)的图像特征自动提取方法,实现对复杂的田间环境下玉米幼苗的快速准确识别,为玉米田间智能耕作管理提供技术储备。基于优化的Faster R-CNN模型来实现玉米出苗检测,结合非极大值抑制方法(Non-Maximum Suppression,NMS)对单位面积的玉米幼苗进行计数。依据表型平台的时序图像实现不同玉米品种的出苗动态监测,以此来判断出不同品种玉米的出苗特征及差异,并对两种平台的出苗检测精度进行验证比较。
2 材料与方法
2.1 图像采集
研究分别使用无人机平台和田间作物表型高通量采集平台(轨道式)搭载可见光传感器进行高通量原始图像数据获取。因此,图像采集试验分为两部分,其中试验一使用无人机平台进行图像获取,试验二使用田间作物表型高通量采集平台进行图像获取。
2.1.1 无人机可见光图像采集
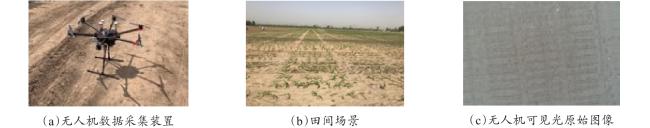
试验一于2018年在北京市通州区实验基地开展(39°56′ N,116°16′ E)。使用大疆M600 Pro六旋翼无人机作为图像采集平台,搭载型号为SONY-5100的相机(采用20 mm的定制机械镜头)对试验田内玉米苗期冠层图像进行采集。考虑到小型无人机的续航能力和图像的分辨率等问题,设置无人机的飞行高度为30 m,航向重叠度为70%,旁向重叠度为65%。试验的采集时间为2018年5月8日(出苗)至2018年5月23日。考虑所获取图像的质量问题,选择在无风或者微风的时候用无人机采集数据。所获取的可见光原始图像分辨率为5280×3956 px。图1 展示了无人机实物图、田间场景图以及无人机获取可见光图像。
2.1.2 表型平台可见光图像采集
试验二在北京市农林科学院试验田内开展(39°56′ N,116°16′ E)。试验二地块长15 m,宽6 m。在其上方搭建了数字植物北京市重点实验室自主研发的田间作物高通量表型平台(轨道式)。在平台的覆盖范围内种植了AD268和XD20两个玉米品种,每个品种分别以25,000株/ha,40,000株/ha和55,000株/ha三种密度进行种植,共计6个小区,每个小区种植4行,共24行,行长2.5 m。两个品种玉米于2020年7月23日播种,种植后以正常水肥管理。图2 为地块中种植情况示意图。
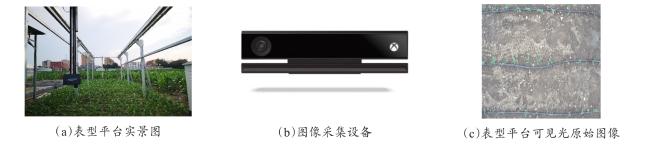
在本次试验中,使用Microsoft,Kinect V2.0作为成像单元图像采集设备,有效像素为500万px。镜头垂直向下,采用自动曝光模式获取玉米冠层图像。图像采集时间从2020年7月26日(出苗)开始到2020年9月28日止,每天分别选择上午10点和下午3点两个时间点采集玉米出苗冠层图像,所获取的图像原始分辨率为2048×2048 px。田间作物高通量表型平台图像采集装置如图3 所示。
2.2 数据集构建
2.2.1 图像预处理
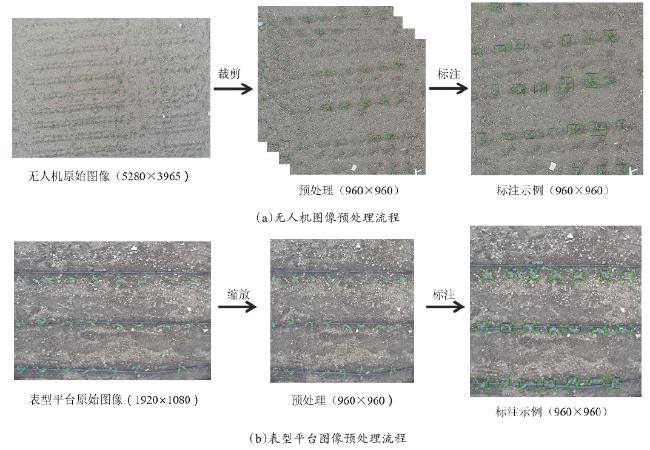
综合考虑硬件条件和试验参数的需要,同时为了便于模型训练,将试验二中获取的原始图像(分辨率为2048×2048 px)缩放至960×960 px输入模型。而为了与田间作物高通量表型平台获取的图像保持统一,对试验一中获取的无人机可见光原始图像(分辨率为5280×3956 px)同样缩放至960×960 px,采用滑动步长剪裁的方式裁剪图像。并且为了充分覆盖到遥感影像中目标的信息,裁剪时保证一定的重叠度,从而能够提高模型后期训练的效率和精度。
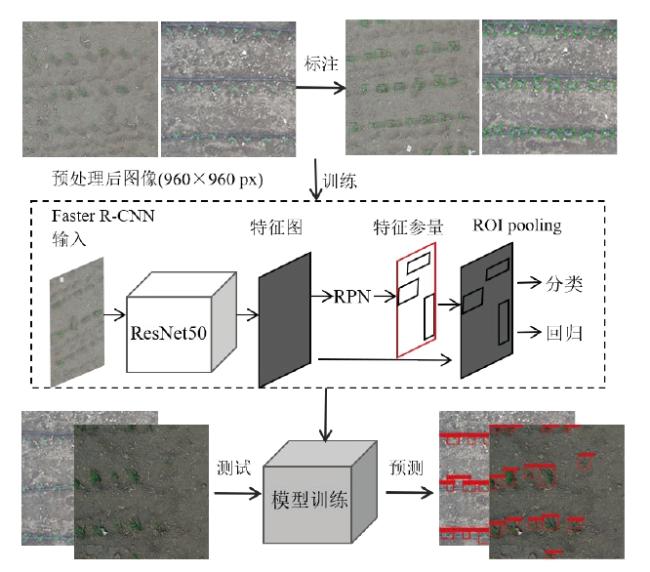
使用图像注释工具LabelImg对裁剪及缩放后的图像进行幼苗的边界框标注,通过最小外接矩形将样本中的玉米苗标出,记录该矩形的左上和右下的顶点坐标,并设置类别标签为seedling。图4 展示了数据从缩放、裁剪到标注的整体流程。
2.2.2 最终数据集组成
为实现玉米出苗检测的目标,本研究选取试验一中玉米刚出苗时期的无人机获取的图像作为数据集,即5月8日至5月10日,共计4天。分别选取每天原始图像数据28张,共计112张。经过滑动步长裁剪后,每张原始图像被裁剪成12张960×960 px的图像,共计1344张。考虑到图像的质量问题,手动剔除了过度曝光、质量较低的图像。经过筛选后,剩余1188张图像构成试验一数据集。将此数据集按照7:3的比例划分为训练集和测试集。对于试验二,选取玉米刚出苗时期的表型平台获取的图像作为数据集,即7月28日至8月3日,共计6天。分别选取每天原始图像数据150张,共计1200张。经过缩放后放入试验二数据集。同时由于所选取日期的天气情况不同(即同时包括了晴天和阴天),能够保证不同光照条件下模型的泛化性能。
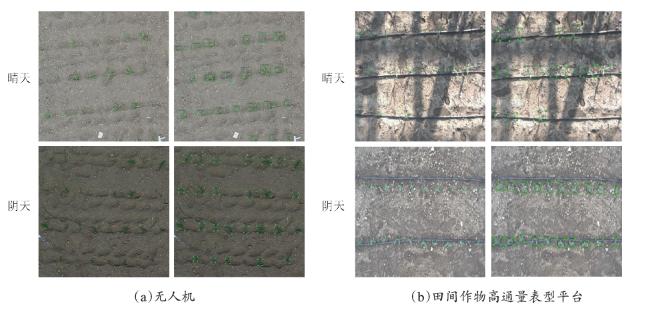
本研究最终数据集组成如表1 所示。图5 展示了两种平台数据分别在不同光照条件下预处理后的图像及其标注,其中图5 (a)为不同光照条件下无人机平台图像及其标注,图5 (b)为不同光照条件下表型平台图像及其标注。
2.3 玉米幼苗检测网络
本研究基于卷积神经网络在图像特征提取上的优异表现,构建了基于Faster R-CNN玉米出苗动态检测模型,该模型以无人机和田间作物高通量表型平台采集的玉米冠层图像为数据源,对玉米田间出苗状况进行监测。玉米出苗网络的检测过程如图6 所示。
2.3.1 Faster R-CNN模型框架
本研究采用Faster R-CNN深度学习模型作为基础框架,其网络结构如图7 所示。
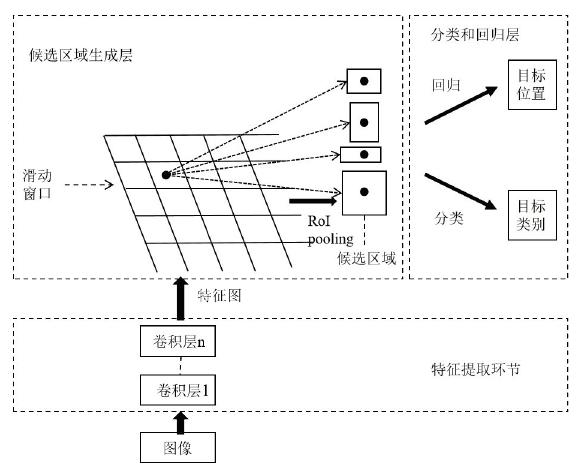
由图7 可见,Faster R-CNN 网络主要有四个主要内容。首先是卷积层对输入的图片,Faster R-CNN 使用一组基础的conv+relu+pooling层提取图片的特征图(Feature map),用于后续候选框检测网络(Region Proposal Network)和全连接层。在RPN层中使用尺寸为3×3 px的滑动窗口遍历该特征图,以每个锚点(滑动窗口中心)为中心,设计不同的长宽比生成多尺度候选区域。ROI Pooling层在此基础上提取候选特征图(Proposal Feature Maps),得到固定尺寸的候选特征。最后经过分类和回归,输出候选区所属的类和候选区域在图中的精确位置。
2.3.2 ResNet50特征提取网络
本研究以田间玉米冠层图像为数据,进行出苗动态检测。田间场景比较复杂,不同光照和不同采集装置得到的图像具有很大的差异,传统的Faster R-CNN网络中特征提取网络为VGG。VGG结构层次相对较浅,难以达到预期效果,因此本研究在Faster R-CNN网络基础上设计应用残差(Residual)学习单元,使用ResNet50作为特征提取网络。
研究中用到的特征提取网络ResNet 50结构如图8 所示。ResNet 50共有5个编码层,第一个编码层是由卷积层和池化层构成,后面4个编码层就是4个残差块。残差结构中包括两个分支,其中,第一个分支是使用三个卷积层、批归一化层以及修正线性单元(Rectified Linear Unit,ReLu)[26]层进行特征处理,而另一个分支则是通过直接映射处理。在使用特征映射融合将这两个分支集成起来后,整个网络只需要学习输入和输出之间的差异,简化了学习的目标和难度。表2 展示了特征提取网络的具体参数配置。
表2 ResNet 50参数配置Table 2 Parameters of ResNet 50 |
| 网络层 | 卷积核 | 通道数 | 残差结构数量 |
|---|---|---|---|
| Layer-1 | 卷积操作(卷积核7×7,64),Stride=2 | ||
| 最大池化操作(池化矩形3×3),Stride=2 | |||
| Layer-2 | 1×1 | 64 | 3 |
| 3×3 | 64 | ||
| 1×1 | 256 | ||
| Layer-3 | 1×1 | 128 | 4 |
| 3×3 | 128 | ||
| 1×1 | 512 | ||
| Layer-4 | 1×1 | 256 | 6 |
| 3×3 | 256 | ||
| 1×1 | 1024 | ||
| Layer-5 | 1×1 | 512 | 3 |
| 3×3 | 512 | ||
| 1×1 | 2048 | ||
| Layer-6 | 平均池化操作1×1,FC-1000,Softmax | ||
2.3.3 激活函数与损失函数
本研究中网络训练时选取ReLu作为激活函数,当输入值为负时,ReLu函数的输出值恒为0;当输入值为正时,ReLu函数的值与输入值相等,即:
本研究模型的损失函数主要由两部分组成,其中第一部分是分类损失[27],其具体公式如下:
其中,p i为第i个检测框的预测值;当预测值与标注区域的重叠区域大于0.7时p * i=1,当预测值与标注区域的重叠区域小于0.3时p * i=0;N 表示网络训练过程中生成的256个检测框。
第二部分是回归损失,用于确定网络训练过程中的偏移量,其具体公式为:
其中,t i表示训练阶段预测值的偏移量;t i *表示训练阶段相对于实际的偏移量;λ是平衡回归损失和分类损失的参数。
3 结果与分析
3.1 试验参数设置及训练过程分析
模型训练硬件平台采用Intel(R) Xeon(R) CPU E5-2683 v3处理器,128 GB内存,两块GTX 1070Ti显卡,以及8GB显存。软件环境在Windows 10操作系统下进行配置,语言开发环境为Python3.6、Anaconda3和TensorFlow 1.13.2。
选择随机梯度下降法(Stochastic Gradient Descent,SGD)来更新学习率,从而对Faster R-CNN网络进行训练。训练时将初始学习率设置为1e-4,衰减率设置为0.9。为了加快训练速度和训练初期防止权值被破坏,在迭代前20个epoch时候,冻结一部分网络权值的更新,迭代20个epoch之后把所有神经网络进行解冻训练,同时将学习率调整为1e-5,衰减率依然设置为0.9。设置网络训练的迭代次数为500个epoch,每个epoch训练1000步。训练Loss曲线如图9 所示。

由图9 可以看出,模型在前40个批次损失快速下降,40个批次后模型的损失曲线趋于平稳。不断对模型进行训练,直到损失趋于稳定并不再变化,最终迭代到500次时,停止训练。
3.2 模型训练结果
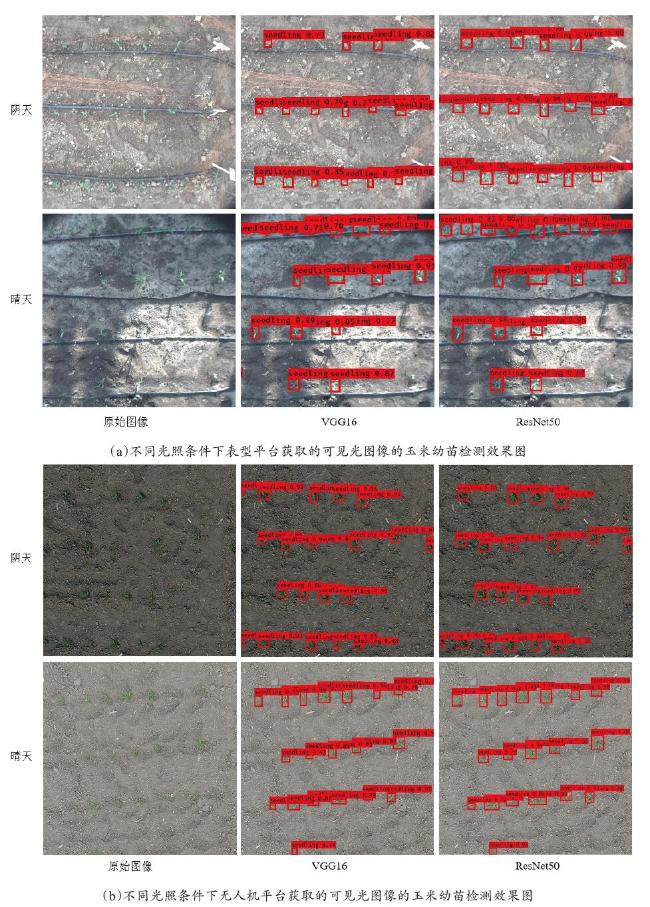
该模型对于无人机可见光以及田间作物高通量表型平台可见光两种图像在不同光照条件下的玉米幼苗检测效果如图10 所示。直观上可以看出,以ResNet50作为特征提取网络进行的幼苗检测,具有更好的检测结果,而且晴天检测结果优于阴天检测结果。表型平台图像中基本所有出苗都被有效地检测出来,而无人机图像中有很少一部分出苗的玉米没有被检测出来。
3.3 评价指标
对训练结束之后的模型进行性能判断,对于分类模型通常采用精确率(Precision)、召回率(Recall)、交并比(Intersection Over Union,IOU)作为评价指标,而平均绝对误差(Mean Absolute Error,MAE)通常被用来评价计数模型的性能。本研究采用以上4个评价指标来对模型的检测计数性能进行客观的评估。各评价指标的公式如下:
其中,P为Precision,表示在所有模型预测为玉米幼苗的结果中,预测正确数量占总数的比例;R为Recall,表示模型预测为玉米幼苗的数量占实际幼苗数量的比例;TP(True Positive)表示正阳性是指样本预测值为正实际也为正;FP(False Positive)表示假阳性是指样本预测值为正实际为负;FN(False Negative)表示假阴性是指样本预测值为负实际为正的。
其中,IOU表示模型预测的边界框与真实标注的边界框的交集和并集的比值;A表示模型预测的边界框;B表示人工标注的边界框即为真实值。
其中, 表示预测值; 表示真实值; 和 可以是任意形状,每个形状包含m个元素。MAE即为绝对误差的平均值,可以更好地反映预测值误差的实际情况,平均绝对误差值越小即表示模型训练的效果越好。
根据上述所列出的评价指标对无人机图像和表型平台图像进行分析,结果如表3 ~表5 所示。图11 (97页)为模型在不同平台和不同天气下输出的P-R曲线。PR曲线中将recall设置为横坐标,precision设置为纵坐标。曲线与坐标周包围的面积为AP,AP越大,说明检测结果越好
表3 基于VGG和ResNet的Faster R-CNN在测试集输出结果对比Table 3 Comparison of output results of Faster R-CNN based on VGG and ResNet in the test set |
| 特征提取网络 | P/% | R/% | IOU | MAE |
|---|---|---|---|---|
| VGG | 89.42 | 86.81 | 75.04 | 6.2816 |
| ResNet | 91.87 | 90.13 | 82.57 | 5.6361 |
表4 本研究模型在表型平台晴天和阴天图像输出结果比较Table 4 Comparison of the output results of the model in the images of HTPP on sunny and cloudy days |
| 光照情况 | P/% | R/% | IOU | MAE |
|---|---|---|---|---|
| 晴天 | 95.67 | 93.36 | 85.57 | 4.3682 |
| 阴天 | 91.36 | 89.23 | 83.04 | 5.2314 |
表5 本研究模型在无人机晴天和阴天图像输出结果比较Table 5 Comparison of the output results of the model in the UAV images on sunny and cloudy days |
| 光照情况 | P/% | R/% | IOU | MAE |
|---|---|---|---|---|
| 晴天 | 91.43 | 89.46 | 86.01 | 5.3521 |
| 阴天 | 89.77 | 87.81 | 83.04 | 5.9564 |
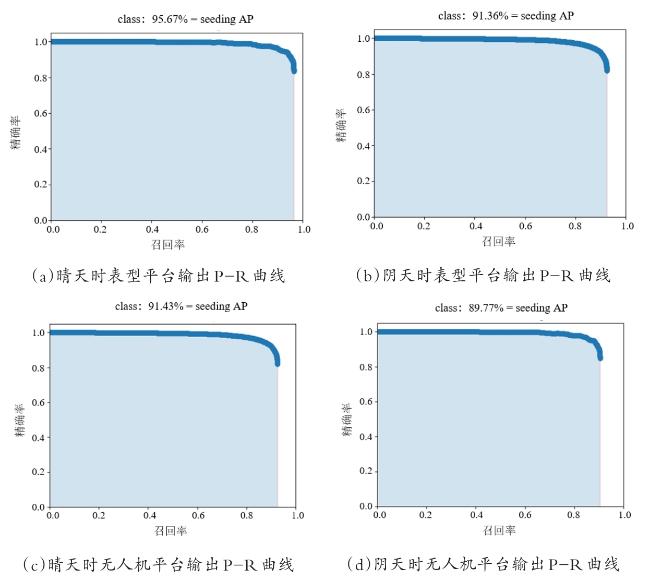
由表3 可以看到本研究基于ResNet特征提取网络的Faster R-CNN在整体测试集上的表现要优于传统的Faster R-CNN模型。由表4 和表5 可以看出本研究模型晴天时在高通量表型平台上精度可以达到95.67%,表现要优于无人机平台精度(91.43%),阴天时在表型平台和无人机平台上的识别精度也可以达到91.36%和89.77%。改进后的Faster R-CNN模型可以满足对高通量表型平台和无人机平台对出苗检测的要求。
3.4 玉米出苗动态监测
考虑到田间作物高通量表型平台能够获取每天的时序性可见光图像(图12 )。本研究采用其所获取图像实现不同品种玉米的动态出苗检测。平台覆盖地块中分别以三种不同密度种植了AD268和XD20两种玉米植株,每种密度四次重复。除去保护行,共24行,行长为2.5 m即密度为25,000株/ha每行种植6棵植株,密度为40,000株/ha每行种植9棵植株,密度为55,000株/ha每行种植12棵植株。各品种玉米于7月23日同时播种。使用本研究训练的模型从7月26日(未出苗)开始对各品种玉米连续10 d的冠层图像进行出苗检测计数,直至所有植株完全出苗。统计并绘制了同一个品种不同密度的植株出苗数量的变化曲线,如图12 所示。
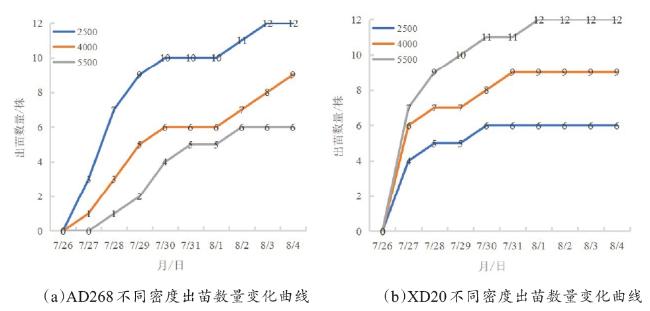
从图12 (a)可以看出AD268品种玉米植株于7月27日开始出苗,于8月4日全部出苗结束。而图12 (b)的XD20品种玉米植株同样于7月27日开始出苗,三种不同密度植株在8月1日均全部出苗。为了更加直观地展示不同密度玉米植株的出苗情况,分别统计了不同种类和不同种植密度的玉米植株从第一天出苗至出苗结束所需天数,如表6 所示。
表6 不同品种不同密度玉米植株出苗至结束所需天数统计表Table 6 Statistics of the number of days required from emergence to end of different varieties and different densities meter |
| 品种 | 种植密度/(株·ha-1) | 出苗天数/天 |
|---|---|---|
| AD | 25,000 | 5 |
| 40,000 | 8 | |
| 55,000 | 7 | |
| XD | 25,000 | 3 |
| 40,000 | 4 | |
| 55,000 | 5 |
结合图12 可知,XD20品种的玉米植株比AD268品种的玉米植株从开始出苗到结束所需的时间更短即出苗更整齐。而在本次试验中,在相同种植条件及灌溉条件下,密度为25,000株/ha的玉米植株从开始出苗至结束所需时间相对另两种密度玉米植株更短。利用本研究所提模型进行动态出苗检测结果与人工实测结果保持一致,说明本研究所提方法具有一定的鲁棒性和泛化性。
4 结 论
本研究以无人机平台可见光图像以及田间作物表型高通量采集平台可见光图像两种数据源构建了不同光照条件下玉米冠层图像数据集。使用Resnet 50代替VGG 16来优化Faster R-CNN模型,对所获取共计2388张图像进行了训练和测试。优化后的模型在测试集上的平均识别精度为91.87%,并对在不同平台和不同光照下的模型检测精度进行了对比。其中,高通量表型平台对出苗进行预测时,晴天和阴天的识别精度可以分别达到95.67%和91.63%。无人机平台对出苗进行预测时,晴天和阴天的识别精度可以分别达到91.36%和89.77%。研究结果表明,应用本模型可实现在田间作物高通量表型平台上玉米幼苗检测,达到可观的效果。而在无人机平台上的检测精度却相对偏低。这是由于两种平台所获取的图像空间分辨率大小不一样、采用的预处理方式也不一样。导致处理后两种平台的图像数据所包含的玉米幼苗数量也不一致,因此在进行幼苗检测时会出现不同平台的检测精度差。
在此基础上,根据田间作物高通量表型平台所获取的时序图像对玉米出苗数量变化进行统计,分析了本试验中AD268和XD20两个品种玉米在三种不同种植密度条件下,从出苗开始至结束所需时间。结果表明,不同品种的出苗持续时间存在显著差异,XD20相比AD268出苗持续时间更短,出苗更整齐。本研究方法具备一定的准确性和科学性,同时也为使用无人机和表型平台获取玉米冠层图像进行识别计数任务及出苗动态检测提供了一定的理论依据和借鉴价值。
本研究根据田间作物表型平台从玉米未出苗开始连续10天所获取的时序可见光图像,进一步应用该优化模型对不同玉米品种在不同种植密度下的出苗动态进行了监测。以上结果说明本研究建立的基于深度学习的玉米出苗检测模型不仅可以实现无人机可见光图像中玉米幼苗的准确识别与检测,也能够通过田间作物表型高通量平台实现对玉米出苗的动态连续监测。通过对两种平台的对比,田间表型高通量平台相对于无人机表型平台所获取的图像更加精细,时序性更强,所以出苗检测的准确度更高,能够更好地为玉米播种质量和种子质量评价提供技术支撑,为田间大面积测定出苗率及产量估算提供参考。


