1 引 言
2 材料与方法
2.1 研究区概况和试验设备
2.2 试验方法
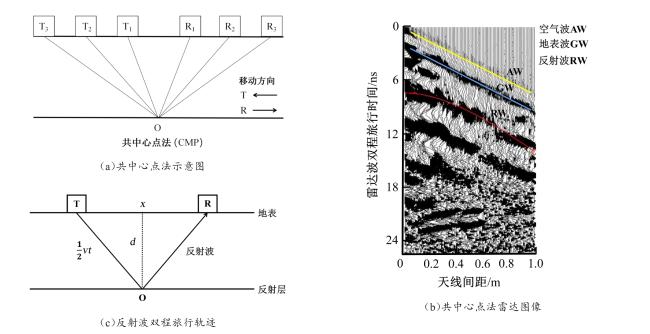
2.2.1 探地雷达测量土壤含水量的原理
2.2.2 共中心点法
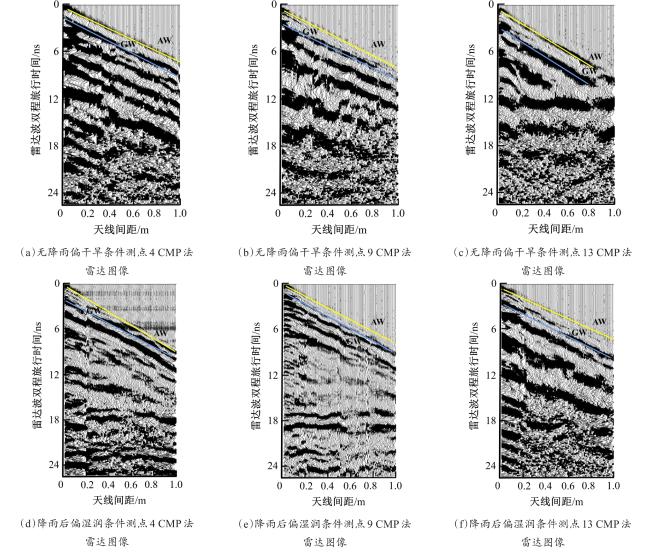
2.3 数据采集与处理
3 结果与分析
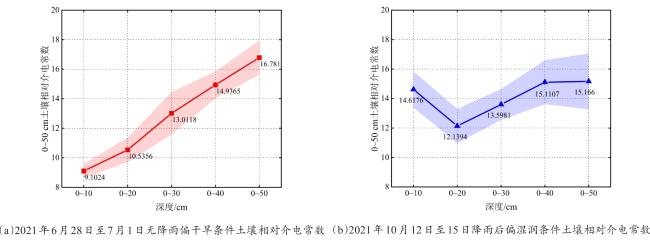
3.1 土壤体积含水量及雷达有效反演深度
表1 无降雨偏干旱和降雨后偏湿润土壤条件下不同深度范围土壤介电常数与烘干法实测体积含水量值之间的相关性分析(n = 30)Table 1 The correlation analysis between soil relative dielectric constant and volumetric water content under arid soil and moist soil conditions in different depth ranges(n = 30) |
| 土壤水分条件 | 相关系数(r) | ||||
|---|---|---|---|---|---|
| 0~10 cm | 0~20 cm | 0~30 cm | 0~40 cm | 0~50 cm | |
| 偏干旱 | 0.554 | 0.593 | 0.707 | 0.854 | 0.740 |
| 偏湿润 | 0.475 | 0.686 | 0.782 | 0.847 | 0.750 |
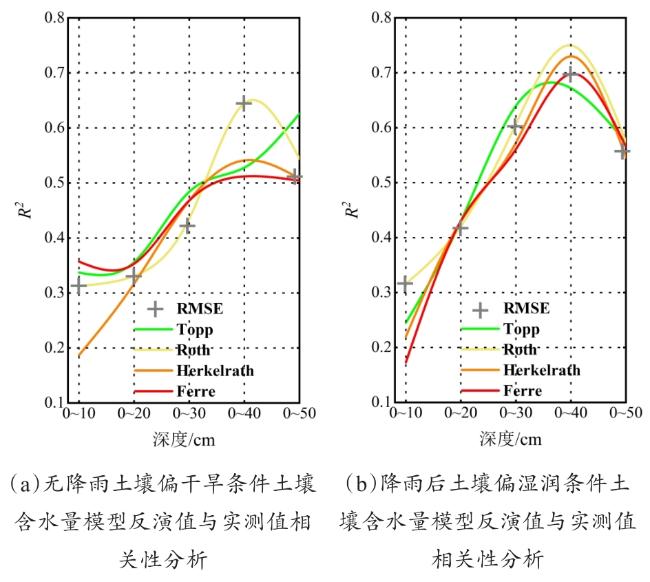
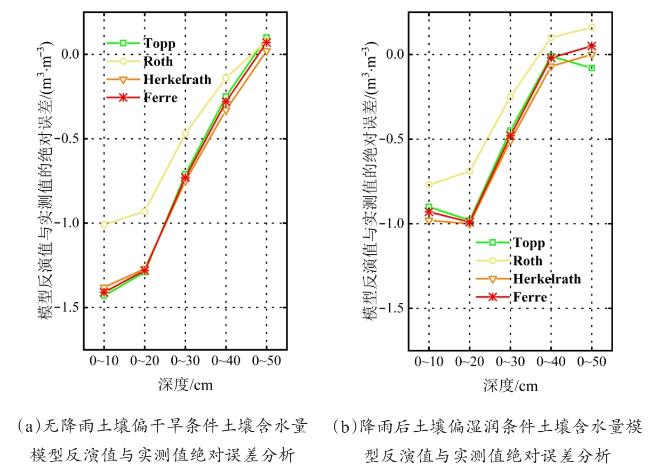
3.2 田块尺度最优模型及最佳反演深度
表2 不同深度范围模型反演值与土壤含水量实测值的均方根误差平均值(n=30)Table 2 The mean RMSE between model inversion value and volumetric soil water content in different depth ranges (n=30) |
| 土壤水分条件 | 均方根误差平均值 /(m3·m-3) | |||
|---|---|---|---|---|
| Topp | Roth | Herkelrath | Ferre | |
| 偏干旱 | 0.0563 | 0.0401 | 0.0559 | 0.0561 |
| 偏湿润 | 0.0406 | 0.0335 | 0.0421 | 0.0412 |
表3 模型反演值与土壤含水量实测值的相对误差(n=30)Table 3 The relative error between model inversion value and volumetric soil water content (n=30) |
| 深度/cm | RE/% | ||||
|---|---|---|---|---|---|
| Topp | Roth | Herkelrath | Ferre | ||
| 土壤偏干旱条件 | 0~10 | 37.3 | 26.3 | 35.9 | 36.7 |
| 0~20 | 31.7 | 22.7 | 31.2 | 31.5 | |
| 0~30 | 16.3 | 10.7 | 17.2 | 16.7 | |
| 0~40 | 5.8 | 3.6 | 7.6 | 6.5 | |
| 0~50 | 3.8 | 3.0 | 2.8 | 3.4 | |
| 土壤偏湿润条件 | 0~10 | 17.8 | 15.1 | 19.3 | 18.4 |
| 0~20 | 22.3 | 15.4 | 22.8 | 22.5 | |
| 0~30 | 10.3 | 5.9 | 11.6 | 10.9 | |
| 0~40 | 3.7 | 4.6 | 4.3 | 3.9 | |
| 0~50 | 5.3 | 5.4 | 5.1 | 5.1 | |
3.3 相邻反射层间土壤含水量反演精度
表4 两种土壤水分条件下0~50 cm深度范围相邻反射层间土壤含水量反演结果(n=30)Table 4 Inversion results of soil water content between adjacent reflective layers in 0-50 cm depth range under two soil water conditions (n=30) |
| 深度范围/cm | 土壤水分条件 | AE/(m3·m-3) | RE/% | RMSE /(m3·m-3) |
|---|---|---|---|---|
| 10~20 | 偏干旱 | -0.38 | | 0.0402 |
| 偏湿润 | -0.67 | | 0.0563 | |
| 20~30 | 偏干旱 | 0.16 | | 0.0308 |
| 偏湿润 | 0.68 | | 0.0806 | |
| 30~40 | 偏干旱 | 0.78 | | 0.0611 |
| 偏湿润 | 1.40 | | 0.1332 | |
| 40~50 | 偏干旱 | 1.30 | | 0.1347 |
| 偏湿润 | 0.15 | | 0.0126 |


