1 Introduction
2 Materials and Methods
2.1 Data acquisition
Table 1 Key parameters of Azure Kinect DK camera |
Feature | Parameter | Feature | Parameter |
---|---|---|---|
RGB camera resolution/ pix | 1280×720 | External dimension/ mm | 126×103×39 |
RGB camera FOV(Field of View)/(°) | 90× 59 | Device interface | USB3.0 |
Depth camera resolution/ pix | 640×576 | Effective distance/m | 0.25~2.88 |
Depth camera FOV/(°) | 120×120 | Ranging principle | ToF (Time of flight) |
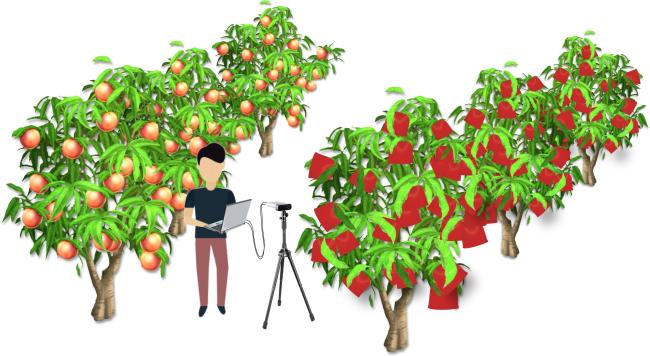
Fig. 1 View of the naked and bagging peach visual data acquisition illustration |
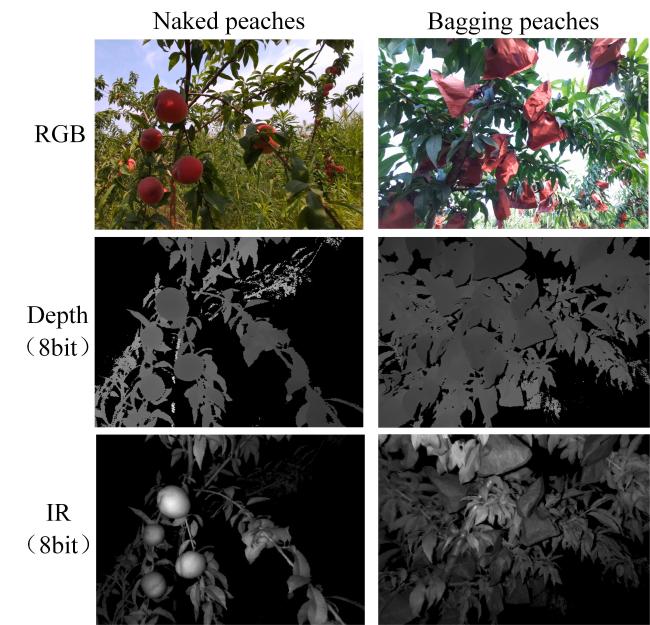
Fig. 2 Examples of multi-modal images of naked and bagging peach captured by RGB-D camera |
2.2 Multi-class peach RGB-D dataset
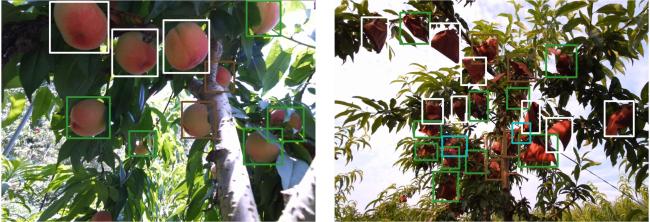
Fig. 3 Peaches were annotated into four classes, where fruits inside white, green, cyan, and brown boxes were referred to the NO, OL, OF, and OB, respectively(a) Naked peaches (b) Bagging peaches |
2.3 Improved YOLOv5s network
Fig. 4 Overall structure of the improved YOLOv5s model |
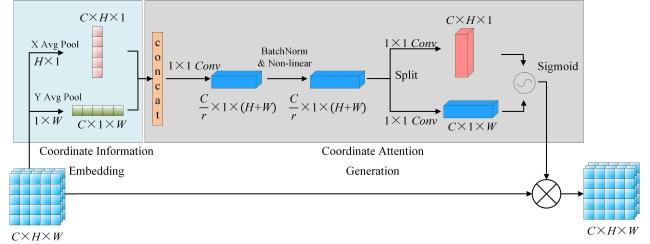
Fig. 5 Structure diagram of coordinate attention mechanism (corresponding to CA in Fig. 4) |
Fig. 6 Depthwise separable convolution structure (corresponding to DSC in Fig. 4) |
2.4 Model deployment
3 Experimental results and analysis
3.1 Training platform and parameters
Table 2 Initialization training parameters |
Input image size | Batch size | Momentum | learning rate | Decay | Epochs |
---|---|---|---|---|---|
640×640 | 8 | 0.9 | 0.001 | 0.0005 | 150 |
3.2 Evaluation indicators
3.3 Performances of the improved YOLOv5s using different multi-modal images
3.3.1 Training assessment
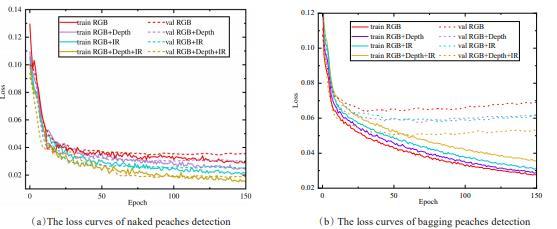
Fig. 7 The loss curves under different combinations of imaging modalities for naked and bagging peaches detection |
3.3.2 Quantitative analysis for test results of different modal images
Table 3 Detection results from the test set using four combinations of imaging modalities for naked and bagging peaches |
Channels | Naked peaches | Bagging peaches | Detection speed/FPS | ||||
---|---|---|---|---|---|---|---|
Precision/% | Recall/% | mAP/% | Precision/% | Recall/% | mAP/% | ||
RGB | 90.4 | 92.2 | 93.3 | 69.2 | 71.5 | 72.4 | 70.9 |
RGB+Depth | 92.1 | 91.5 | 92.7 | 68.7 | 71.2 | 72.3 | 68.0 |
RGB+IR | 92.7 | 94.3 | 94.7 | 77.8 | 71.7 | 78.2 | 68.0 |
RGB+Depth+IR | 97.4 | 98.2 | 98.6 | 88.3 | 85.4 | 88.9 | 66.2 |
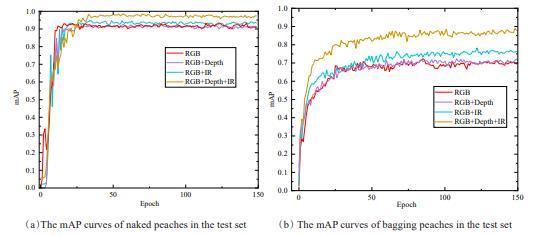
Fig. 8 The mAP curves under different combinations of imaging modalities for naked and bagging peaches detection |
3.4 Contribution of different imaging modalities in typical scenarios
3.4.1 Comparison with different illumination conditions
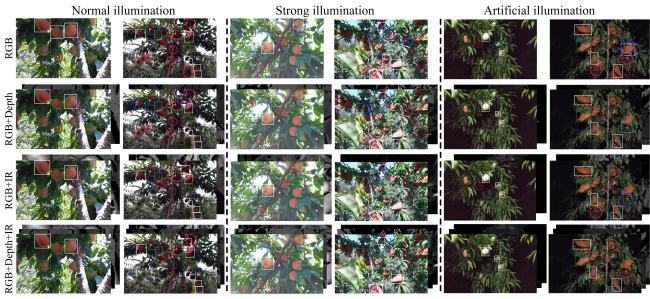
Fig. 9 Examples of multi-class naked and bagging peach detection results in the test set when using different modality combinations under three typical illumination conditions of Normal illumination, Strong illumination and Artificial illumination |
3.4.2 Comparison with different occlusion levels
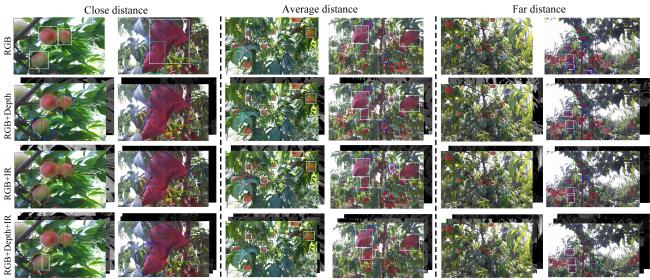
Fig. 10 Examples of multi-class naked and bagging peach detection results in the test set when using different modality combinations in different occlusion scenes |
3.4.3 Comparison with different camera distances
Fig. 11 Examples of multi-class naked and bagging peach detection results in the test set when using different modality combinations in different camera distances |
3.5 Ablation experiments of the improved YOLOv5s
Table 4 Detection results of different models in the test set of naked and bagging peaches |
Models | Naked peaches | Bagging peaches | Parameters/M | Detection speed /FPS | ||||
---|---|---|---|---|---|---|---|---|
Precision/% | Recall/% | mAP/% | Precision/% | Recall/% | mAP/% | |||
YOLOv5s | 96.5 | 94.2 | 95.8 | 81.7 | 89.6 | 82.7 | 7.07 | 66.2 |
YOLOv5s-DSC | 95.4 | 93.5 | 95.0 | 80.0 | 78.0 | 80.0 | 5.03 | 94.3 |
YOLOv5s-CA | 97.7 | 98.3 | 98.8 | 88.5 | 85.1 | 89.4 | 7.12 | 66.2 |
Improved YOLOv5s | 97.4 | 98.2 | 98.6 | 88.3 | 85.4 | 88.9 | 5.08 | 77.5 |
3.6 Comparison and discussion
3.6.1 Comparison with other object detection networks
Table 5 Detection results of different lightweight object detection models in the test set of naked and bagging peaches |
Models | Naked peaches | Bagging peaches | Parameters/M | Detection speed/FPS | ||||
---|---|---|---|---|---|---|---|---|
Precision/% | Recall/% | mAP/% | Precision/% | Recall/% | mAP/% | |||
YOLOX-Nano | 76.3 | 74.1 | 75.7 | 71.4 | 79.2 | 72.6 | 0.91 | 170.2 |
PP-YOLO-Tiny | 78.2 | 79.9 | 80.5 | 80.4 | 78.8 | 80.8 | 1.3 | 154.5 |
EfficientDet-D0 | 85.3 | 86.9 | 87.7 | 86.2 | 85.1 | 85.4 | 3.9 | 110.7 |
Improved YOLOv5s | 97.4 | 98.2 | 98.6 | 88.3 | 85.4 | 88.9 | 5.08 | 77.5 |
3.6.2 Comparison with other fruit detection studies
Table 6 Detection results of different models on two open-source fruit datasets. |
Model | Precision/% | Recall/% | mAP/% |
---|---|---|---|
Faster R-CNN (Fuji apple) | 84.7 | 88.8 | 92.7 |
Improved YOLOv5s (Fuji apple) | 95.9(+8.2) | 96.3(+2.5) | 98.2(+5.5) |
YOLOv4 (Hayward kiwifruit) | —— | —— | 91.9 |
Improved YOLOv5s (Hayward kiwifruit) | 95.32 | 94.63 | 94.2 (+2.3) |