欢迎您访问《智慧农业(中英文)》官方网站! English
专刊--作物信息监测技术

基于深度卷积生成式对抗网络的菌草丙二醛含量可见/近红外光谱反演

  • 叶大鹏 , 1, 2 ,
  • 陈晨 1, 2 ,
  • 李慧琳 1, 2 ,
  • 雷莹晓 3 ,
  • 翁海勇 1, 2 ,
  • 瞿芳芳 , 1, 2
展开
  • 1. 福建农林大学 机电工程学院,福建 福州 350002,中国
  • 2. 福建省农业信息感知技术重点实验室,福建 福州 350002,中国
  • 3. 福建农林大学 园艺学院,福建 福州 350002,中国
瞿芳芳,博士,讲师,研究方向为农业信息智能分析与决策。E-mail:

叶大鹏,研究方向为智能农业信息感知。E-mail:

收稿日期: 2023-07-24

  网络出版日期: 2023-11-10

基金资助

福建省自然科学基金项目(2023J01473)

Visible/NIR Spectral Inversion of Malondialdehyde Content in JUNCAO Based on Deep Convolutional Gengrative Adversarial Network

  • YE Dapeng , 1, 2 ,
  • CHEN Chen 1, 2 ,
  • LI Huilin 1, 2 ,
  • LEI Yingxiao 3 ,
  • WENG Haiyong 1, 2 ,
  • QU Fangfang , 1, 2
Expand
  • 1. College of Mechanical and Electrical Engineering, Fujian Agriculture and Forestry University, Fuzhou 350002, China
  • 2. Fujian Key Laboratory of Agricultural Information Sensing Technology, Fuzhou 350002, China
  • 3. College of Horticulture, Fujian Agriculture and Forestry University, Fuzhou 350002, China

Received date: 2023-07-24

  Online published: 2023-11-10

Supported by

National Natural Science Foundation of Fujian(2023J01473)

Copyright

copyright©2023 by the authors

摘要

[目的/意义] 菌草是多年生可用作饲料与生物质能源的草本植物,在温带种植需克服越冬问题。低温胁迫会对菌草的生长发育造成不利影响。丙二醛(Malondialdehyde,MDA)含量作为诊断菌草低温胁迫状态的有力诊断指标,利用光谱技术反演MDA含量,可快速无损地评估菌草生长动态,为菌草育种及低温胁迫诊断提供参考。 [方法] 本研究基于6个品种的菌草植株,设置低温胁迫组与常温对照组,获取菌草苗期的可见/近红外光谱(Visible/Near Infrared Spectrum,VIS/NIR)数据与叶片MDA含量信息,分析低温胁迫条件下菌草MDA含量及其光谱反射率均相应增加的变化趋势;为提升模型的检测效果,提出了改进的一维深度卷积生成式对抗网络(Deep Convolutional Generative Adversarial Networks,DCGAN)用于样本数量增广,并建立基于随机森林(Random Forest,RF)、偏最小二乘回归(Partial Least Squares Regression,PLSR)以及卷积神经网络(Convolutional Neural Networks,CNN)算法的MDA光谱定量检测模型。 [结果和讨论] DCGAN可优化模型的可靠性与MDA检测精度,且DCGAN联合RF模型可以得到最佳的检测效果,其中预测集决定系数Rp2为0.7922,均方根误差为2.4063,残差预测偏差(Residual Predictive Deviation,RPD)为2.1937。 [结论] 本研究利用DCGAN进行样本数量增广,能显著提升基于光谱数据的模型对菌草MDA含量的反演精度与预测性能。

本文引用格式

叶大鹏 , 陈晨 , 李慧琳 , 雷莹晓 , 翁海勇 , 瞿芳芳 . 基于深度卷积生成式对抗网络的菌草丙二醛含量可见/近红外光谱反演[J]. 智慧农业, 2023 , 5(3) : 132 -141 . DOI: 10.12133/j.smartag.SA202307011

Abstract

[Objective] JUNCAO, a perennial herbaceous plant that can be used as medium for cultivating edible and medicinal fungi. It has important value for promotion, but the problem of overwintering needs to be overcome when planting in the temperate zone. Low-temperature stress can adversely impact the growth of JUNCAO plants. Malondialdehyde (MDA) is a degradation product of polyunsaturated fatty acid peroxides, which can serve as a useful diagnostic indicator for studying plant growth dynamics. Because the more severe the damage caused by low temperature stress on plants, the higher their MDA content. Therefore, the detection of MDA content can provide instruct for low-temperature stress diagnosis and JUNCAO plants breeding. With the development of optical sensors and machine learning technologies, visible/near-infrared spectroscopy technology combined with algorithmic models has great potential in rapid, non-destructive and high-throughput inversion of MDA content and evaluation of JUNCAO growth dynamics. [Methods] In this research, six varieties of JUNCAO plants were selected as experimental subjects. They were divided into a control group planted at ambient temperature (28°C) and a stress group planted at low temperature (4°C). The hyperspectral reflectances of JUNCAO seedling leaves during the seedling stage were collected using an ASD spectroradiomete and a near-infrared spectrometer, and then the leaf physiological indicators were measured to obtain leaf MDA content. Machine learning methods were used to establish the MDA content inversion models based on the collected spectral reflectance data. To enhance the prediction accuracy of the model, an improved one-dimensional deep convolutional generative adversarial network (DCAGN ) was proposed to increase the sample size of the training set. Firstly, the original samples were divided into a training set (96 samples) and a prediction set (48 samples) using the Kennard stone (KS) algorithm at a ratio of 2:1. Secondly, the 96 training set samples were generated through the DCGAN model, resulting in a total of 384 pseudo samples that were 4 times larger than the training set. The pseudo samples were randomly shuffled and sequentially added to the training set to form an enhanced modeling set. Finally, the MDA quantitative detection models were established based on random forest (RF), partial least squares regression (PLSR), and convolutional neural network (CNN) algorithms. By comparing the prediction accuracies of the three models after increasing the sample size of the training set, the best MDA regression detection model of JUNCAO was obtained. [Results and Discussions] (1) The MDA content of the six varieties of JUNCAO plants ranged from 12.1988 to 36.7918 nmol/g. Notably, the MDA content of JUNCAO under low-temperature stress was remarkably increased compared to the control group with significant differences (P<0.05). Moreover, the visible/near-infrared spectral reflectance in the stressed group also exhibited an increasing trend compared to the control group. (2) Samples generated by the DCAGN model conformed to the distribution patterns of the original samples. The spectral curves of the generated samples retained the shape and trends of the original data. The corresponding MDA contented of generated samples consistently falling within the range of the original samples, with the average and standard deviation only decreased by 0.6650 and 0.9743 nmol/g, respectively. (3) Prior to the inclusion of generated samples, the detection performance of the three models differed significantly, with a correlation coefficient (R2) of 0.6967 for RF model, that of 0.6729 for CNN model, and that of 0.5298 for the PLSR model. After the introduction of generated samples, as the number of samples increased, all three models exhibited an initial increase followed by a decrease in R2 on the prediction set, while the root mean square error of prediction (RMSEP) first decreased and then increased. (4) The prediction results of the three regression models indicated that augmenting the sample size by using DCGAN could effectively enhance the prediction performance of models. Particularly, utilizing DCGAN in combination with the RF model achieved the optimal MDA content detection performance, with the R2 of 0.7922 and the RMSEP of 2.1937. [Conclusions] Under low temperature stress, the MDA content and spectral reflectance of the six varieties of JUNCAO leaves significantly increased compared to the control group, which might due to the damage of leaf pigments and tissue structure, and the decrease in leaf water content. Augmenting the sample size using DCGAN effectively enhanced the reliability and detection accuracy of the models. This improvement was evident across different regression models, illustrating the robust generalization capabilities of this DCGAN deep learning network. Specifically, the combination of DCGAN and RF model achieved optimal MDA content detection performance, as expanding to a sufficient sample dataset contributed to improve the modeling accuracy and stability. This research provides valuable insights for JUNCAO plants breeding and the diagnosis of low-temperature stress based on spectral technology and machine learning methods, offering a scientific basis for achieving high, stable, and efficient utilization of JUNCAO plants.

1 引 言

菌草是可作栽培食药用菌培养基的草本植物,由于其具有生物量大、营养成分高等特点,在饲料、生物质能源与材料开发等领域都具有巨大的应用价值。目前,中国菌草种植技术已推广到世界范围内众多国家和地区,对于促进全球经济共同发展具有重要意义1-4。低温胁迫下的冷害是全球性的自然灾害,尤其对农业生产具有不利影响5, 6,这同时也是影响菌草地理分布和生产力的重要因素7-9,因此,对菌草的健康状况进行动态监测及抗性品种的筛选具有重要意义。
植物在遭遇低温胁迫时,会因脂质过氧化反应导致蛋白质裂解和细胞膜系统的破坏,从而损害其光合作用与呼吸作用,重则导致植物死亡10。丙二醛(Malondialdehyde,MDA)是多不饱和脂肪酸过氧化物的降解产物。植物遭遇低温逆境的损伤越严重,其MDA含量就越高11, 12。因此,MDA含量可作为研究植物生长动态的有力诊断指标。准确预测植物体内MDA含量可实时反映植物的健康状况。硫代巴比妥酸(Thiobarbituric Acid Method,TBA)法是测定植物中MDA最常用的方法之一13,但其耗时耗力,且具有破坏性,难以对大尺度的田间作物进行实时有效的检测14。因此建立一种快速、无损、有效的MDA测定方法对植物胁迫监测具有重要意义。
近年来,随着各类光学传感器及机器学习技术的发展,可见/近红外光谱技术由于其快速、无损等众多优势已被广泛地应用在农业15, 16、食品17、医药18等领域。在以往生化指标测定的研究中,大多采用光谱预处理以及优化建模的方式来提高模型的准确性。Phuphaphud等19以甘蔗为研究对象,利用可见/近红外光谱结合预处理方法对其不同部位进行纤维含量预测,基于偏最小二乘回归(Partial Least Squares Regression,PLSR)模型,其最佳的模型检测性能Rp 2为0.81。Chanda等20以茶叶为研究对象,利用近红外光谱对咖啡因含量进行检测,根据咖啡因中不同化学键的响应特征获取有效波长,结合预处理技术与两种回归模型,包括支持向量机(Support Vector Regression,SVR)和PLSR,其中最佳的Rp 2为0.637。张亚坤等21基于近红外光谱测定大豆叶片可溶性蛋白含量,表明Savitzky-Golay平滑结合连续投影算法(Successive Projections Algorithm,SPA)可获得最佳的检测效果,其中预测集R 2为0.746。上述研究虽都取得了较好的效果,然而在实际样本采集中,获取大量数据的难度较大,而数据量较小的情况往往又会影响建模精度,因此扩充高质量的样本数据集很有必要22, 23
Radford等24于2015年提出了深度卷积生成式对抗网络(Deep Convolutional Generative Adversarial Networks,DCGAN)用于生成高质量图像,在数据增强、图像修复、超分辨率重构等领域均取得了很好的效果25, 26。基于此,为探究利用DCGAN网络联合可见/近红外光谱反演低温胁迫下菌草MDA含量的可行性,本研究以6种菌草为研究对象,测定菌草叶片的可见/近红外反射率与MDA含量,采用一维DCGAN进行数据集扩充,并建立3种定量检测模型,包括一维卷积神经网络(Convolutional Neural Networks,CNN)、随机森林(Random Forest,RF)以及偏最小二乘回归(Partial Least Squares Regression,PLSR),实现菌草MDA含量快速无损检测。

2 材料与方法

2.1 实验材料

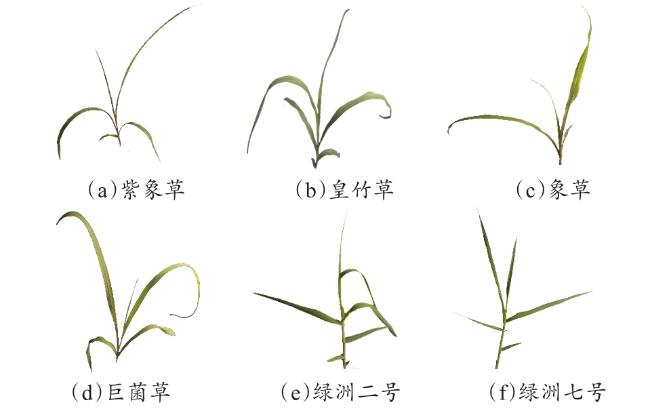
本研究于2022年10‒11月与2023年3—4月在福建农林大学菌草温室大棚(26°5'21"N,119°14'49"E)进行。本研究对象包含6种典型的菌草品种,分别是绿洲二号(Arundo donax cv. Lv zhou. No.2,A. donax. No.2)、绿洲七号(Arundo donax cv. Lv zhou. No.7,A. donax. No.7)、巨菌草(Cenchrus fungigraminus)、象草(Pennisetum purpureum Schum)、紫象草(Pennisetum purpureum Schumab)以及皇竹草(Pennisetum sinese Roxb),均由福建农林大学国家菌草工程技术研究中心提供。样本植株种植采用土培方式,将菌草种节种植在穴盘中(穴盘上口径58 mm,下口径20 mm,深度110 mm),并放置于恒温培养箱中,温度设定为28℃,定期浇水。当植株高度为25 cm左右时,将每个品种的植株均匀分为两组,其中对照组继续放置于28℃恒温培养箱中,胁迫组放置于4℃培养箱中进行胁迫处理27。经过5 d后,一次性采集对照组与胁迫组植株叶片作为实验样本,并测定叶片光谱反射率和MDA含量。样本总计144株,不同菌草品种的植株如图1所示。
图1 不同品种的菌草植株

Fig. 1 Different varieties of JUNCAO plants

2.2 测定项目及方法

2.2.1 叶片光谱反射率获取

使用手持式地物光谱仪(ASD HandHeld 2, Malvern Panalytical America,波长范围为325~1075 nm,光谱分辨率为1 nm)与近红外光谱仪(SW2520-050-NIRA,台湾超微光学,波长范围为900~1700 nm,光谱分辨率为9 nm)采集远离主脉的菌草叶片在325~1700 nm范围内的光谱信息,每个样本重复采集3个不同位置,取其平均值作为该样本的光谱反射率。数据采集前先开启装置预热约30 min并进行黑白板校准。由于采集的光谱数据在首尾两端会产生明显噪声,为消除该影响,截取手持式地物光谱仪采集的400~999 nm范围内光谱(共600个波长参数),以及截取近红外光谱仪采集的1000~1650 nm范围内的光谱(共99个波长参数),经光谱拼接后(共699个波长参数)用于后续实验分析。

2.2.2 丙二醛含量测定

菌草叶片MDA含量的测定方法采用硫代巴比妥酸法。在样本完成光谱数据采集后,剪下叶片,在剪叶时注意避开叶脉。将每株剪下的叶片混合后称取0.1 g放置于离心管中,并立刻将其用液氮速冻后放入-80℃冰箱中以便后续实验测定。MDA含量具体测定方法如下:将叶片加入1 mL提取液后进行冰浴匀浆,之后在4℃下以8000 r/min离心10 min,提取0.l mL上清液并加入0.4 mL TBA溶液后于100℃水浴60 min,然后在25℃下以10,000 r/min离心10 min,最后取0.2 mL上清液分别测定其在532与600 nm处的吸光度用于确定该样本的MDA浓度。

2.3 建模方法与模型评价标准

2.3.1 深度卷积生成式对抗网络

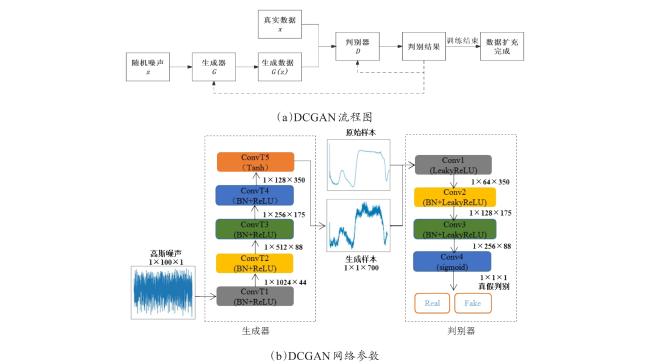
本研究中DCGAN模型使用Python3.8编程实现。实验平台为Pycharm社区版与Pytorch2.0.0。该模型主要由生成器与判别器构成,执行流程如图2(a)所示。生成器以一个高斯分布的随机噪声z作为输入,通过生成器生成伪数据Gz);判别器则以真实数据与伪数据共同作为输入,判别结果作为输出。当训练完成时,保存生成样本完成数据扩充。
由于该对抗网络模型主要用于图像领域,为此本研究在此网络的基础上进行了改进,使其适用于一维光谱数据,同时在实际训练中,为避免判别器过强导致其出现梯度消失的现象,从而难以学习到原始样本中信息的问题,本实验在原始网络模型基础上减少了判别器的网络深度,模型的结构与参数如图2(b)所示。生成器由5个转置卷积、5个激活函数以及4个批规范化层组成,其中第5层是tanh激活函数,其余为ReLU激活函数,最终生成长度为700的一维向量,其中第1列向量为拟合的MDA含量信息,后699列为光谱参数;判别器包含4个卷积层、2个批规范化层以及3个LeakyReLU激活函数,最后通过sigmoid激活函数判别数据的真伪。该模型采用Adam优化器,生成器与判别器的学习率都设定为0.0002,批次大小设定为1,训练次数设定为300。由于模型训练前期不够稳定,因此仅保存模型训练100次后生成器最低损失函数值的样本。
图2 DCGAN流程及其具体网络参数

Fig. 2 Flowchart of DCGAN and its specific network parameters

2.3.2 模型建立

首先利用Kennard-stone(KS)算法按照2∶1比例将原始样本划分为建模集和预测集,其中建模集96个,预测集48个。其次将96个建模集样本通过DCGAN模型生成4倍于建模集的伪样本,共384个。最后将伪样本随机打乱并依次加入到建模集中,构成增强建模集,利用不同回归建模方法以及添加的生成样本数量进行模型评价。
本研究构建PLSR、RF以及CNN模型用于菌草低温胁迫MDA定量检测,其中CNN模型具体网络参数如表1所示。模型超参数设定:优化器选择随机梯度下降(Stochastic Gradient Descent,SGD);批大小为48;迭代次数设定为500次,为防止过拟合,会提前停止训练;学习率为0.001。
表1 CNN网络参数

Table 1 CNN network parameter

网络层 卷积核大小 卷积核数量 Padding 激活函数
Conv1 3 16 same ReLU
Conv2 3 32 same ReLU

2.3.3 评价指标

选用决定系数(Coefficient of Determination, R 2),均方根误差(Root Mean Square Error, RMSE)与残差预测偏差(Residual Predictive Deviation,RPD)对模型的预测性能进行评估。一般情况下,R 2与RPD越大,RMSE越小,表明该模型预测值与实测值相关性好,且预测性能也越好。具体计算方法如公式(1)~(3)所示。
R 2 = ( i = 1 n y i , a - y ¯ i , a y i , p - y ¯ i , p i = 1 n y i , a - y ¯ i , a 2 i = 1 n y i , p - y ¯ i , p 2 ) 2  
R M S E   = i = 1 n y i , a - y i , p 2 n - 1
R P D = S D v S E P = 1 1 - R 2
其中, y i , a y i , p分别为第i个样本的实际测量MDA含量值和模型预测的MDA含量值,nmol/g; y ¯ i , a y ¯ i , p分别为样本实际测量平均值和模型预测平均值,nmol/g; S D v S E P分别为预测集的实际含量标准偏差和预测标准偏差,nmol/g; n为样本的数量,个。

3 结果与讨论

3.1 低温胁迫对菌草叶片光谱反射率与MDA含量的影响

图3为常温(28℃)对照组与低温(4℃)胁迫组培养5 d后,6个品种菌草的平均光谱以及对应的MDA含量图。其中在波长1000 nm范围附近光谱反射率有着明显的偏移,这主要是由两台仪器不同的设备参数导致的。在可见光范围内(400~740 nm),在550 nm附近处有明显的强反射峰,主要由于绿色植物叶片对绿光吸收少;在可见光波长480和675 nm附近出现了深吸收的波谷,主要由于绿色植物内叶绿素强吸收引起的,而在近红外范围内(740~1650 nm)的光谱曲线则主要受到叶片内部结构以及水分含量的影响28
图3 菌草叶片的平均光谱与MDA含量图

注:a、b代表Duncan检测下低温胁迫的MDA含量具有显著差异(P<0.05)

Fig.3 Average spectra and MDA content of JUNCAO leaves

此外,由图3对比分析可知,低温胁迫组与对照组的菌草植株表现出不同的光谱特征,但总体趋势一致。在全波段范围内,胁迫后的菌草叶片相较于对照组来说,光谱反射率都产生了明显的上移,原因为在可见光范围内,光谱反射率主要受色素的影响,而低温胁迫会破坏原有的色素,造成反射率升高的情况,而在近红外范围内,低温胁迫会造成植物叶片组织结构发生一定的损伤,同时也会导致叶片含水量的降低,这会造成光谱反射率变高的情况。这一趋势也与一些学者的研究结果一致29, 30
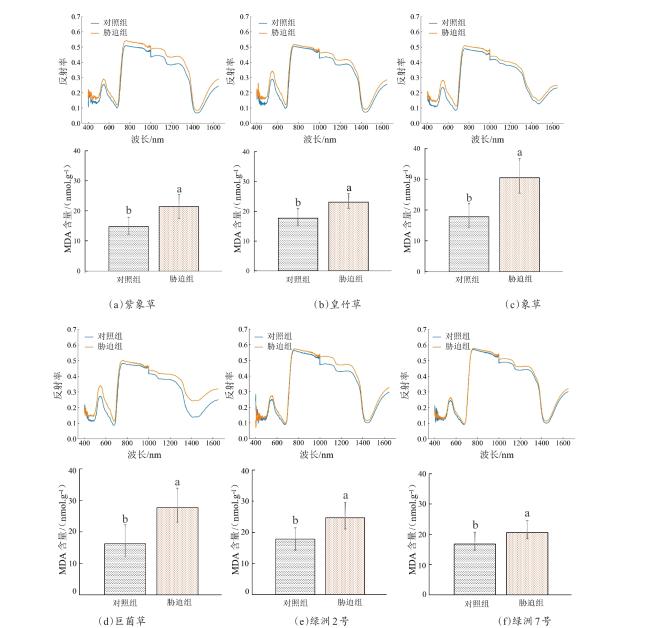
在遭遇低温胁迫后,各品种菌草的MDA含量相较于对照组都具有一定的提高,表现出脂质过氧化现象,说明植株受到损伤。同时,本研究利用不同菌草品种得到了不同浓度梯度的MDA含量,数据分布均匀合理,并且各品种菌草的MDA含量在对照组与胁迫组当中均表现出显著性差异(P<0.05),有利于后续建立稳定的定量模型。

3.2 利用深度卷积生成式对抗网络扩充菌草原始光谱及MDA含量信息

图4(a)为144个菌草叶片样本的原始可见/近红外光谱反射信息;图4(b)为经DCGAN模型生成的伪样本,样本数为384个。可以看出生成样本的光谱曲线保留了原始光谱曲线的形状和变化趋势,但与原始光谱曲线并不完全一致,原因是在DCGAN模型中引入了高斯噪声,增加了样本的多样性。对比分析图4可知,生成样本的反射区间比原始样本小,可能是因为原始样本中大部分样本的光谱反射值相对集中,导致生成器产生在其他位置的反射值容易被判别器鉴定为假样本。
图4 菌草叶片的原始样本与生成样本光谱图

Fig.4 Original spectra and generated spectra of JUNCAO leaves

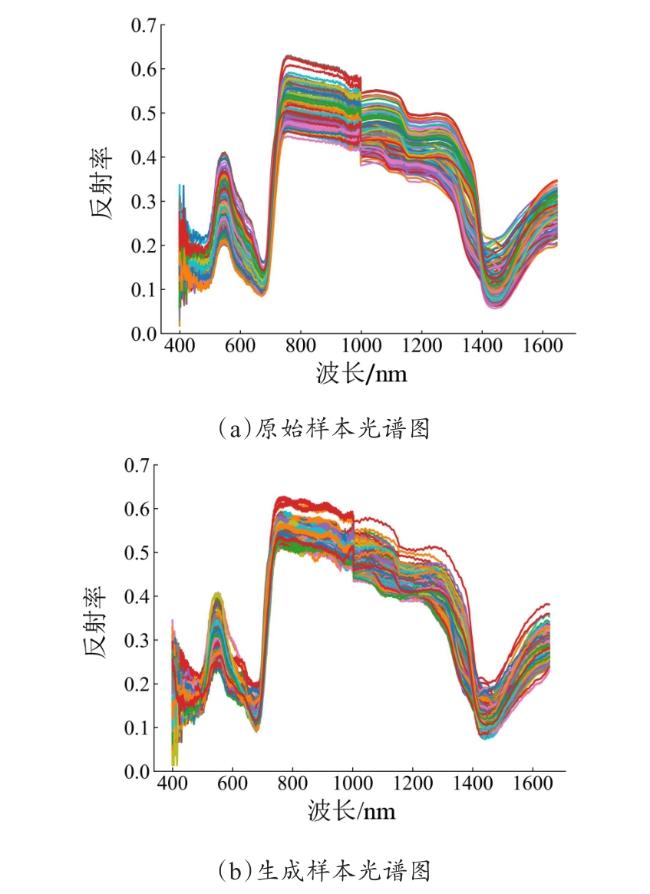
对比原始样本与生成样本的MDA含量统计特征,如表2所示。生成样本中MDA含量的最小值与最大值均在原始样本的范围内,分别为13.2523与34.5608 nmol/g,并且平均值与标准差分别只下降0.6650与0.9743 nmol/g。结果表明生成的MDA含量值能很好地符合原始样本的分布。
表2 MDA含量统计特征

Table 2 Statistical characteristics of MDA content

样本类型 数量 最小值/(nmol·g-1 最大值/(nmol·g-1 平均值/(nmol·g-1 标准差/(nmol·g-1
原始样本 144 12.1988 36.7918 21.5571 5.8438
生成样本 384 13.2523 34.5608 20.8921 4.8695
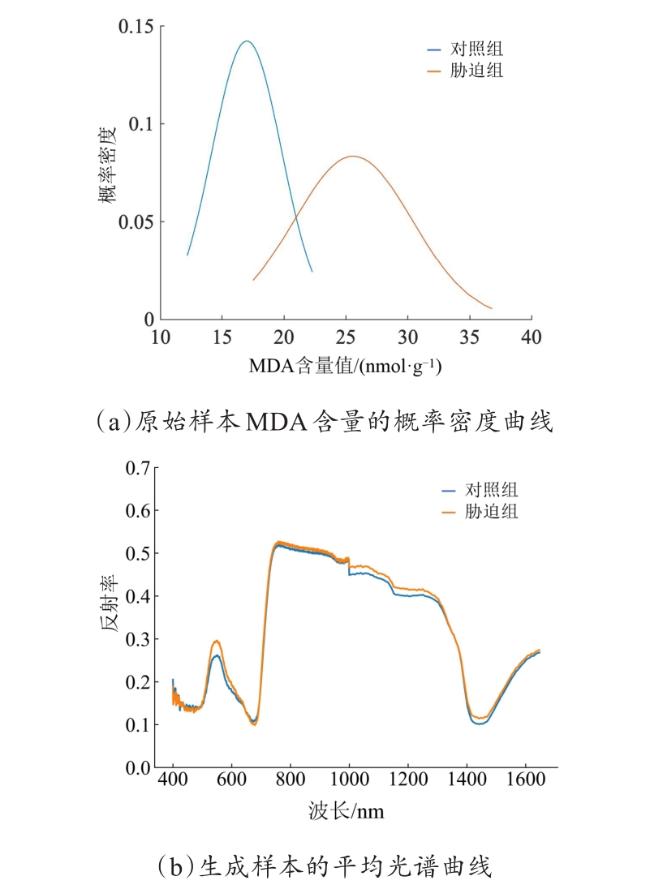
由于在原始样本中,各品种菌草叶片的MDA含量在对照组与胁迫组当中均存在显著差异性(P<0.05),胁迫组的叶片MDA含量往往高于对照组。将原始样本中对照组与胁迫组的MDA含量分别建立概率密度曲线,如图5(a)所示。可以看出对照组在MDA含量为17.0014 nmol/g时,其概率密度取得最高值,胁迫组在MDA含量为25.5955 nmol/g时,其概率密度取得最高值,并且在MDA含量为20.9407 nmol/g时,两者概率密度值相同。因此,将临界值20.9407 nmol/g作为生成样本中对照组与胁迫组的划分依据,将MDA含量小于该值的样本作为对照组,MDA含量大于该值的样本作为胁迫组,比较生成样本在可见/近红外光谱的差异性。图5(b)为生成样本中对照组与胁迫组的平均光谱曲线,可以看出,胁迫组的平均光谱在大部分波长范围内都高于对照组,虽然仅在550、1000~1300以及1450 nm处较为显著,但仍较好地满足了原始样本的光谱特征。
上述结果说明,经DCGAN模型生成的样本在自身具有多样性的同时,与原始样本也具有较高的相似性。因此,生成样本符合原始样本的分布规律,可对原始样本进行数据扩充。
图5 菌草叶片原始样本的概率密度与生成样本的平均光谱曲线

Fig. 5 Probability density of the original samples and the corresponding average spectral curves of the generated samples of JUNCAO leaves

3.3 基于原始样本与生成样本构建菌草MDA含量检测模型

在构建检测模型之前,先将生成样本随机打乱,并依次添加到原始建模集中。分别采用PLSR、RF以及CNN构建定量检测模型来对DCGAN生成的数据在同一预测集上进行评估。由于CNN模型训练时间较长,无法将生成样本依次加入到建模集中,因此本研究在构建CNN回归模型中按比例在建模集中加入48、96、192、288、384个生成样本。
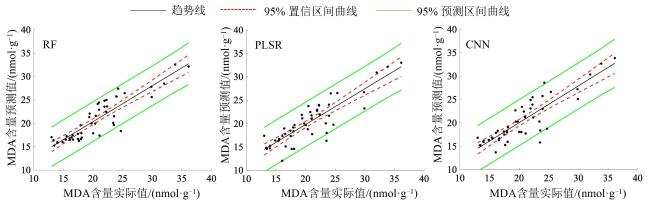
三种模型的检测结果如图6所示。在未添加生成样本时,不同模型在预测集上的R 2差异显著,其中RF模型的R 2为0.6967,RMSEP为2.7591;CNN模型的R 2为0.6729,RMSEP为3.1353;而PLSR模型的R 2仅为0.5298,RMSEP为3.6646。随后在建模集中逐步添加生成样本,可以看出,在加入生成样本后,3种模型的R 2在预测集上皆表现出先增大后减小的趋势,RMSEP则先减小后增大。表3为3种模型的最优训练结果,相较于未添加生成样本的预测精度Rp 2,CNN模型最高提升11.2%;RF模型最高提升13.7%;PLSR最高提升42.8%,且RF模型可以得到最佳的检测效果。Zhang等31利用近红外光谱对松树叶片的MDA含量进行估测,通过将光谱预处理与重要特征选择算法应用于PLSR,其最佳的R 2为0.66,但原始R 2为0.64,二者差距不大。本研究将原始样本进行数据扩增后建立3种回归模型,其检测精度均得到较好的提高。为了更加直观地表示模型的预测能力,图7为3种模型在最优样本数量下的菌草MDA含量预测值与实测值相关图。结果表明,利用DCGAN模型对原始建模集进行数据扩充可以获得更好的精度与稳定性。同时,充足的数据集有助于得到最优的检测结果。
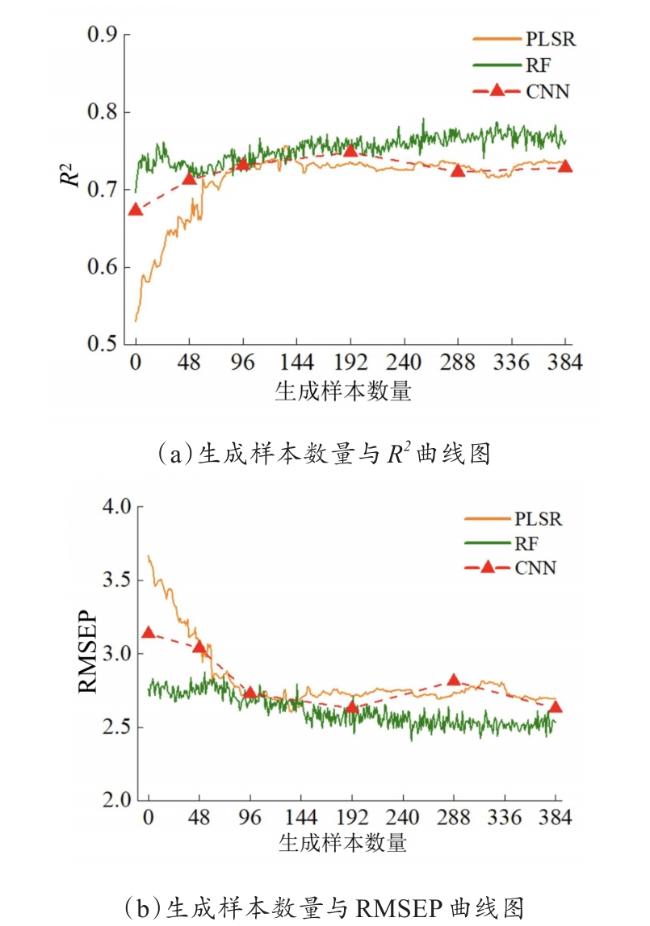
图6 添加不同生成样本数量的3种检测模型的R 2与RMSEP曲线图

Fig. 6 R 2 and RMSEP curves of three detection models with different generated sample sizes added

表3 建立不同模型的菌草MDA含量最优检测效果

Table 3 Establishing different models for the optimal detection of MDA content in JUNCAO

模型 选择 添加样本数量 训练集 预测集
Rc 2 RMSEC RP 2 RMSEP RPD
PLSR 134 0.8376 1.8781 0.7566 2.5263 2.0269
RF 248 0.8716 1.9817 0.7922 2.4063 2.1937
CNN 192 0.7512 2.7107 0.7484 2.6298 1.9936
图7 不同模型下菌草MDA含量预测值与实测值相关图

(a) RF模型 (b) PLSR模型 (c) CNN模型

Fig. 7 Correlation graph of predicted and measured MDA content of JUNCAO under different models

4 结 论

本研究以低温胁迫下的6种菌草植株为研究对象,提出了一维DCGAN模型用于拓展样本数量,并结合PLSR、RF以及CNN模型对菌草MDA含量进行定量检测。研究表明:(1)低温胁迫后,菌草叶片的MDA含量相较于对照组会显著升高,其可见/近红外光谱反射率较于对照组也呈现增大趋势;(2)DCGAN模型能用于扩充样本数量,并且随着添加样本数量的增多,模型精度会呈现先升高后减小的趋势;(3)三种模型在数据扩充后的评价指标皆优于原始数据集,采用DCGAN联合RF模型可以获得最佳的MDA含量检测效果。
本研究可用于低温胁迫下小样本量菌草MDA含量的快速检测,可为菌草育种及低温胁迫诊断提供一定的理论依据和技术支持。

利益冲突声明

本研究不存在研究者以及与公开研究成果有关的利益冲突。

1
林占熺. 菌草学概论[M]. 北京: 中国农业出版社, 2019.

LIN Z X. Introductory JUNCAO science[M]. Beijing: China agriculture press, 2019.

2
林占熺, 苏德伟, 林辉, 等. 黄河菌草生态安全屏障建设的研究与应用[J]. 福建农林大学学报(自然科学版), 2019, 48(6): 803-812.

LIN Z X, SU D W, LIN H, et al. Constructing an ecological barrier by JUNCAO along the Yellow River and its industrial application[J]. Journal of Fujian agriculture and forestry university (natural science edition), 2019, 48(6): 803-812.

3
林兴生. 菌草产业发展的几个关键技术研究[D]. 福州: 福建农林大学, 2013.

LIN X S. Study on several key technology of JUNCAO industry development[D]. Fuzhou: Fujian Agriculture and Forestry University, 2013.

4
周晶, 林兴生, 林辉, 等. 菌草研究与应用进展[J]. 福建农林大学学报(自然科学版), 2020, 49(2): 145-152.

ZHOU J, LIN X S, LIN H, et al. Advances on JUNCAO research and application[J]. Journal of Fujian agriculture and forestry university (natural science edition), 2020, 49(2): 145-152.

5
PEARCE R S, FULLER M P. Freezing of barley studied by infrared video thermography[J]. Plant physiology, 2001, 125(1): 227-240.

6
王连喜, 肖玮钰, 李琪, 等. 中国北方地区主要农作物气象灾害风险评估方法综述[J]. 灾害学, 2013, 28(2): 114-119, 130.

WANG L X, XIAO W Y, LI Q, et al. Summary of risk assessment methods of main crops meteorological disasters in North China[J]. Journal of catastrophology, 2013, 28(2): 114-119, 130.

7
ASLAM M, FAKHER B, ASHRAF M A, et al. Plant low-temperature stress: Signaling and response[J]. Agronomy, 2022, 12(3): ID 702.

8
MANASA S L, PANIGRAHY M, PANIGRAHI K C S, et al. Overview of cold stress regulation in plants[J]. The botanical review, 2022, 88(3): 359-387.

9
格桑曲珍, 王景升, 曹凯丽, 等. 耐寒高产饲草的西藏引种试验研究[J]. 高原农业, 2022, 6(6): 593-598, 607.

GESANGQUZHEN, WANG J S, CAO K L, et al. Study on the introduction of cold-tolerant and high-yielding herbage in Tibet[J]. Journal of plateau agriculture, 2022, 6(6): 593-598, 607.

10
JANKŮ M, LUHOVÁ L, PETŘIVALSKÝ M. On the origin and fate of reactive oxygen species in plant cell compartments[J]. Antioxidants, 2019, 8(4): ID 105.

11
DE DIOS ALCHÉ J. A concise appraisal of lipid oxidation and lipoxidation in higher plants[J]. Redox biology, 2019, 23: ID 101136.

12
WENG H Y, WU M Y, LI X B, et al. High-throughput phenotyping salt tolerance in JUNCAOs by combining prompt chlorophyll a fluorescence with hyperspectral spectroscopy[J]. Plant science, 2023, 330: ID 111660.

13
JANERO D R. Malondialdehyde and thiobarbituric acid-reactivity as diagnostic indices of lipid peroxidation and peroxidative tissue injury[J]. Free radical biology and medicine, 1990, 9(6): 515-540.

14
ZHANG W W, KASUN L C, WANG Q J, et al. A review of machine learning for near-infrared spectroscopy[J]. Sensors, 2022, 22(24): ID 9764.

15
严正兵, 刘树文, 吴锦. 高光谱遥感技术在植物功能性状监测中的应用与展望[J]. 植物生态学报, 2022, 46(10): 1151-1166.

YAN Z B, LIU S W, WU J. Hyperspectral remote sensing of plant functional traits: Monitoring techniques and future advances[J]. Chinese journal of plant ecology, 2022, 46(10): 1151-1166.

16
王鹏新, 田惠仁, 张悦, 等. 基于深度学习的作物长势监测和产量估测研究进展[J]. 农业机械学报, 2022, 53(2): 1-14.

WANG P X, TIAN H R, ZHANG Y, et al. Crop growth monitoring and yield estimation based on deep learning: State of the art and beyond[J]. Transactions of the Chinese society for agricultural machinery, 2022, 53(2): 1-14.

17
郭志明, 王郡艺, 宋烨, 等. 果蔬品质劣变传感检测与监测技术研究进展[J]. 智慧农业(中英文), 2021, 3(4): 14-28.

GUO Z M, WANG J Y, SONG Y, et al. Research progress of sensing detection and monitoring technology for fruit and vegetable quality control[J]. Smart agriculture, 2021, 3(4): 14-28.

18
SU X, WANG Y, MAO J, et al. A review of pharmaceutical robot based on hyperspectral technology[J]. Journal of intelligent & robotic systems, 2022, 105(4): ID 75.

19
PHUPHAPHUD A, SAENGPRACHATANARUG K, POSOM J, et al. Prediction of the fiber content of sugarcane stalk by direct scanning using visible-shortwave near infrared spectroscopy[J]. Vibrational spectroscopy, 2019, 101: 71-80.

20
CHANDA S, HAZARIKA A K, CHOUDHURY N, et al. Support vector machine regression on selected wavelength regions for quantitative analysis of caffeine in tea leaves by near infrared spectroscopy[J]. Journal of chemometrics, 2019, 33(10): ID e3172.

21
张亚坤, 罗斌, 宋鹏, 等. 基于近红外光谱的大豆叶片可溶性蛋白含量快速检测(英文)[J]. 农业工程学报, 2018, 34(18): 187-193.

ZHANG Y K, LUO B, SONG P, et al. Rapid determination of soluble protein content for soybean leaves based on near infrared spectroscopy[J]. Transactions of the Chinese society of agricultural engineering, 2018, 34(18): 187-193.

22
岑海燕, 朱月明, 孙大伟, 等. 深度学习在植物表型研究中的应用现状与展望[J]. 农业工程学报, 2020, 36(9): 1-16.

CEN H Y, ZHU Y M, SUN D W, et al. Current status and future perspective of the application of deep learning in plant phenotype research[J]. Transactions of the Chinese society of agricultural engineering, 2020, 36(9): 1-16.

23
CHEN D, LIU S J, KINGSBURY P, et al. Deep learning and alternative learning strategies for retrospective real-world clinical data[J]. NPJ digital medicine, 2019, 2: ID 43.

24
RADFORD A, METZ L, CHINTALA S. Unsupervised representation learning with deep convolutional generative adversarial networks[EB/OL]. arXiv: 1511.06434, 2015.

25
董永生, 范世朝, 张宇, 等. 生成对抗网络的发展与挑战[J]. 信号处理, 2023, 39(1): 154-175.

DONG Y S, FAN S C, ZHANG Y, et al. Development and challenge of generative adversarial network[J]. Journal of signal processing, 2023, 39(1): 154-175.

26
GUI J, SUN Z N, WEN Y G, et al. A review on generative adversarial networks: Algorithms, theory, and applications[J]. IEEE transactions on knowledge and data engineering, 2023, 35(4): 3313-3332.

27
李玖荣, 郑焕, 林辉, 等. 5种芦竹属菌草的耐寒性分析[J]. 福建农林大学学报(自然科学版), 2023, 52(1): 17-20.

LI J R, ZHENG H, LIN H, et al. Analysis of cold tolerance of 5 species of Arundo JUNCAO[J]. Journal of Fujian agriculture and forestry university (natural science edition), 2023, 52(1): 17-20.

28
ZAHIR S A D M, OMAR A F, JAMLOS M F, et al. A review of visible and near-infrared (Vis-NIR) spectroscopy application in plant stress detection[J]. Sensors and actuators A: Physical, 2022, 338: ID 113468.

29
徐若涵, 杨再强, 申梦吟, 等. 苗期低温胁迫对“红颜”草莓叶绿素含量及冠层高光谱的影响[J]. 中国农业气象, 2022, 43(2): 148-158.

XU R H, YANG Z Q, SHEN M Y, et al. Effects of low temperature stress at seedling stage on chlorophyll content and canopy hyperspectral of 'hongyan' strawberry[J]. Chinese journal of agrometeorology, 2022, 43(2): 148-158.

30
任鹏, 冯美臣, 杨武德, 等. 冬小麦冠层高光谱对低温胁迫的响应特征[J]. 光谱学与光谱分析, 2014, 34(9): 2490-2494.

REN P, FENG M C, YANG W D, et al. Response of winter wheat (Triticum aestivum L.) hyperspectral characteristics to low temperature stress[J]. Spectroscopy and spectral analysis, 2014, 34(9): 2490-2494.

31
ZHANG Y N, LUAN Q F, JIANG J M, et al. Prediction and utilization of malondialdehyde in exotic pine under drought stress using near-infrared spectroscopy[J]. Frontiers in plant science, 2021, 12: ID 735275.

文章导航

/