欢迎您访问《智慧农业(中英文)》官方网站! English
专刊--作物信息监测技术

干旱胁迫下玉米叶片叶绿素含量与含水量高光谱成像反演方法

  • 王敬湧 , 1 ,
  • 张明珍 1 ,
  • 凌华荣 2 ,
  • 王梓廷 2, 3 ,
  • 盖倞尧 , 1
展开
  • 1. 广西大学 机械工程学院,广西 南宁 530004,中国
  • 2. 广西大学 农学院,广西 南宁 530004,中国
  • 3. 广西大学广西甘蔗生物学重点实验室,广西 南宁 530004,中国
盖倞尧,博士,讲师,研究方向为植物表型技术等。E-mail:

王敬湧,研究方向为植物光谱信息处理。E-mail:

收稿日期: 2023-08-15

  网络出版日期: 2023-11-10

基金资助

国家自然科学基金青年科学基金项目(31901466)

广西科技基地和人才专项(桂科AD22035919)

A Hyperspectral Image-Based Method for Estimating Water and Chlorophyll Contents in Maize Leaves under Drought Stress

  • WANG Jingyong , 1 ,
  • ZHANG Mingzhen 1 ,
  • LING Huarong 2 ,
  • WANG Ziting 2, 3 ,
  • GAI Jingyao , 1
Expand
  • 1. School of Mechanical Engineering, Guangxi University, Nanning 530004, China
  • 2. College of Agriculture, Guangxi University, Nanning 530004, China
  • 3. Guangxi Key Laboratory of Sugarcane Biology, Guangxi University, Nanning 530004, China

Received date: 2023-08-15

  Online published: 2023-11-10

Supported by

National Natural Science Foundation of China(31901466)

Guangxi Science and Technology Base and Talent Project(桂科AD22035919)

Copyright

copyright©2023 by the authors

摘要

[目的/意义] 为实现玉米的干旱胁迫等作物生长状态的无损监测,本研究探索一种基于高光谱技术的干旱胁迫下玉米叶片叶绿素含量与含水量无损检测方法。 [方法] 首先使用高光谱相机采集不同干旱胁迫程度的苗期玉米叶片图像,并使用图像处理技术提取叶肉部分平均光谱。通过系统性地分析不同特征波长提取方法、机器学习回归模型对叶绿素含量和含水量预测性能的影响,分别建立最优叶绿素含量和含水量反演模型,并探究构建可用于叶绿素含量和含水量反演的植被系数并评估其反演能力。 [结果和讨论] 结合逐步回归(Stepwise Regression,SR)特征提取与Stacking回归可获得最优叶绿素含量预测效果(R2为0.878,均方根误差为0.317 mg/g);结合连续投影算法(Successive Projections Algorithm, SPA)特征提取与Stacking回归可获得最优含水量预测效果(R2为0.859,RMSE为3.75%);新构建的归一化差分植被指数[(R410-R559)/(R410+R559)]和比值系数(R400/R1171)分别对叶绿素含量和含水量反演精度最高且显著高于传统植被系数,R2分别为0.803和0.827,均方根误差分别为0.403 mg/g和3.28%。 [结论] 本研究构建的基于高光谱信息的反演模型与植被系数可以实现玉米叶片叶绿素含量与含水量的精确、无损检测,可为玉米生长状态实时监测提供理论依据和技术支持。

本文引用格式

王敬湧 , 张明珍 , 凌华荣 , 王梓廷 , 盖倞尧 . 干旱胁迫下玉米叶片叶绿素含量与含水量高光谱成像反演方法[J]. 智慧农业, 2023 , 5(3) : 142 -153 . DOI: 10.12133/j.smartag.SA202308018

Abstract

[Objectives] Chlorophyll content and water content are key physiological indicators of crop growth, and their non-destructive detection is a key technology to realize the monitoring of crop growth status such as drought stress. This study took maize as an object to develop a hyperspectral-based approach for the rapid and non-destructive acquisition of the leaf chlorophyll content and water content for drought stress assessment. [Methods] Drought treatment experiments were carried out in a greenhouse of the College of Agriculture, Guangxi University. Maize plants were subjected to drought stress treatment at the seedling stage (four leaves). Four drought treatments were set up for normal water treatment [CK], mild drought [W1], moderate drought [W2], and severe drought [W3], respectively. Leaf samples were collected at the 3rd, 6th, and 9th days after drought treatments, and 288 leaf samples were collected in total, with the corresponding chlorophyll content and water content measured in a standard laboratory protocol. A pair of push-broom hyperspectral cameras were used to collect images of the 288 seedling maize leaf samples, and image processing techniques were used to extract the mean spectra of the leaf lamina part. The algorithm flow framework of "pre-processing - feature extraction - machine learning inversion" was adopted for processing the extracted spectral data. The effects of different pre-processing methods, feature wavelength extraction methods and machine learning regression models were analyzed systematically on the prediction performance of chlorophyll content and water content, respectively. Accordingly, the optimal chlorophyll content and water content inversion models were constructed. Firstly, 70% of the spectral data was randomly sampled and used as the training dataset for training the inversion model, whereas the remaining 30% was used as the testing dataset to evaluate the performance of the inversion model. Subsequently, the effects of different spectral pre-processing methods on the prediction performance of chlorophyll content and water content were compared. Different feature wavelengths were extracted from the optimal pre-processed spectra using different algorithms, then their capabilities in preserve the information useful for the inversion of leaf chlorophyll content and water content were compared. Finally, the performances of different machine learning regression model were compared, and the optimal inversion model was constructed and used to visualize the chlorophyll content and water content. Additionally, the construction of vegetation coefficients were explored for the inversion of chlorophyll content and water content and evaluated their inversion ability. The performance evaluation indexes used include determination coefficient and root mean squared error (RMSE). [Results and Discussions] With the aggravation of stress, the reflectivity of leaves in the wavelength range of 400~1700 nm gradually increased with the degree of drought stress. For the inversion of leaf chlorophyll content and water content, combining stepwise regression (SR) feature extraction with Stacking regression could obtain an optimal performance for chlorophyll content prediction, with an R2 of 0.878 and an RMSE of 0.317 mg/g. Compared with the full-band stacking model, SR-Stacking not only improved R2 by 2.9%, reduced RMSE by 0.0356mg/g, but also reduced the number of model input variables from 1301 to 9. Combining the successive projection algorithm (SPA) feature extraction with Stacking regression could obtain the optimal performance for water content prediction, with an R2 of 0.859 and RMSE of 3.75%. Compared with the full-band stacking model, SPA-Stacking not only increased R2 by 0.2%, reduced RMSE by 0.03%, but also reduced the number of model input variables from 1301 to 16. As the newly constructed vegetation coefficients, normalized difference vegetation index(NDVI) [(R410-R559)/(R410+R559)] and ratio index (RI) (R400/R1171) had the highest accuracy and were significantly higher than the traditional vegetation coefficients for chlorophyll content and water content inversion, respectively. Their R2 were 0.803 and 0.827, and their RMSE were 0.403 mg/g and 3.28%, respectively. The chlorophyll content and water content of leaves were visualized. The results showed that the physiological parameters of leaves could be visualized and the differences of physiological parameters in different regions of the same leaves can be found more intuitively and in detail. [Conclusions] The inversion models and vegetation indices constructed based on hyperspectral information can achieve accurate and non-destructive measurement of chlorophyll content and water content in maize leaves. This study can provide a theoretical basis and technical support for real-time monitoring of corn growth status. Through the leaf spectral information, according to the optimal model, the water content and chlorophyll content of each pixel of the hyperspectral image can be predicted, and the distribution of water content and chlorophyll content can be intuitively displayed by color. Because the field environment is more complex, transfer learning will be carried out in future work to improve its generalization ability in different environments subsequently and strive to develop an online monitoring system for field drought and nutrient stress.

1 引 言

玉米(Zea mays L.)苗期的干旱胁迫会严重影响作物品质与产量1。快速诊断干旱胁迫程度是及时采取调控措施以缓解干旱胁迫的前提。虽然传统的实地调研作物外观形态以及检测生物学指标等方法可以准确评估作物生长状态,但需要大量人力物力,不适用于大范围的干旱胁迫在线监测2, 3。玉米叶片叶绿素含量与含水量是玉米生长过程中的重要生理指标,可以反映干旱胁迫程度。因此,对玉米叶片叶绿素含量与含水量的快速、无损检测有望实现精准农业中玉米农田大范围的干旱胁迫在线监测,进而保障玉米的品质与产量。
高光谱成像技术兴起于20世纪90年代。将光谱技术和成像技术结合,使其具有广波段覆盖、全空间信息和图谱合一的技术优势,可用于快速、无损检测物体的外部特征和内部成分。目前,国内外开展了大量基于高光谱成像技术的作物生理信息反演研究。部分研究在实验室中采集叶片的高光谱图像,通过提取叶片部分的平均光谱,经预处理并提取特征后建立生理信息反演模型。例如,孙俊等4比较了不同预处理方法,并用偏最小二乘回归(Partial Least Squares Regression,PLSR)建立了生菜叶片中氮素含量的检测模型;Gao等5使用相关性分析与随机蛙跳算法提取特征波段,随后用PLSR建立玉米叶绿素含量估测模型。部分研究使用便携式、车载、无人机等高光谱平台,采集植株、大田尺度的高光谱图像,用于建立基于高光谱图像的群体营养成分预测模型。例如,Tan等6利用无人机平台拍摄了氮胁迫下小麦不同生长时期的图像,通过融合支持向量回归与虫群优化算法提取光谱特征,并基于PLSR构建了氮含量预测模型;Shu等7构建并比较了多种植被系数用于判断玉米植株的水分状况。但现有方法大多采用特定预处理和建模方法构建作物生理信息反演模型,而对不同预处理、特征提取、建模方法及其组合在生理信息反演中的性能进行系统、全面的对比分析研究较少,尤其对于在干旱胁迫下检测玉米苗期生理信息反演方法的系统性分析研究则更少。
本研究以干旱胁迫下的玉米植株为研究对象,通过系统性地分析不同预处理方法、特征波段提取方法、回归模型对含水量、叶绿素含量预测性能的影响,建立性能最优的基于高光成像技术的叶片叶绿素含量和含水量反演模型;构建可用于叶绿素和含水量反演的植被系数,并评估其反演能力。本研究可为玉米生长信息的快速获取提供技术支持,以期实现对玉米种植的精细化管理,对提高玉米产量和品质具有重要意义。

2 材料与方法

2.1 干旱胁迫玉米叶片样本制备

实验于2022年9月在广西大学农学院温室大棚进行。玉米品种为“早生糯玉808”。在玉米苗期(4片叶)对玉米植株进行干旱胁迫处理。干旱胁迫实验设置正常水处理[田间持水量的(75±2)%,CK]、轻度干旱[田间持水量的(60±2)%,W1]、中度干旱[田间持水量的(45±2)%,W2]、重度干旱[田间持水量的(30±2)%,W3]共4个干旱梯度,每组12株,共计48株。干旱胁迫全部在大棚内进行,以防止降雨对土壤含水量的影响。在胁迫第3、6、9天的每天9∶00 am对玉米植株进行共3次采样操作。每次采样从4组处理中各选取4株玉米植株,采集每盆玉米顶端的3片叶片,用剪刀将每片叶片剪成2片,随后立即放入标本袋中带回实验室。共采集玉米叶片样本总数3×4×4×3×2=288个。

2.2 高光谱图像采集

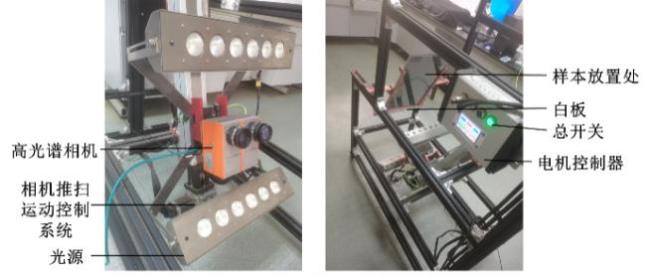
本研究使用的高光谱成像系统由光源平行放置的两个高光谱相机Specim FX10和Specim FX17(Spectral Imaging Ltd.,Oulu,Finland)、相机推扫运动控制系统和计算机组成(图1)。高光谱相机的主要技术参数见表1。在采集高光谱图像前,使用标准反射率的白板与黑板进行测量标定。图像采集在昏暗环境下(环境照度<5 lux)进行,并在采集过程中保持环境光条件一致。通过将每个叶片样本置于黑色背景的样本架中,控制电机匀速运动带动相机推扫以采集高光谱图像。分别提取FX10与FX17相机采集的400~1000 nm波段与1000~1700 nm波段,经过后处理配准叠加为一张高光谱图像,共生成玉米叶片光谱照片288张。
图1 用于采集玉米叶片光谱的高光谱成像系统

(a)光谱相机与光源 (b)推扫控制器与样本放置处

Fig. 1 The hyperspectral imaging system used to collect maize leaf spectrum

表1 高光谱相机主要技术参数

Table 1 Specs of hyperspectral cameras

技术参数 相机型号
FX10 FX17
光谱范围/nm 400~1000 900~1700
光谱分辨率/nm 5.5 8
狭缝宽度/µm 30 30
空间像素数 1024 640
像素大小/µm 8×8 15×15

2.3 玉米叶片叶绿素含量与含水量测定

高光谱图像采集完毕后,使用标准方法测定叶片中叶绿素a和叶绿素b含量8。将每片叶片避开叶脉部分迅速剪取0.1 g,捣碎后放入含有25 mL的丙酮和无水乙醇(体积比2∶1)萃取液的试剂管中,置于阴暗柜子中24 h,使叶绿素萃取分离后取出。待叶片完全发白后,将萃取液转移至比色皿中,放入分光光度计(UV-1800, Shimadzu Corporation,Kyoto,Japan),检测萃取液在663和645 nm处的吸光度。通过公式(1)~公式(3)计算叶绿素含量:
C a = 12.72 A 663     2.59 A 645 (1)
C b = 22.88 A 645     4.67 A 663 (2)
C= C a + C b =20.29 A 645 + 8.05 A 663 (3)
其中, A 663 A 645分别为萃取液在663和645 nm处的吸光度;CaCb 分别为溶液中叶绿素a和叶绿素b的含量, m g / LC为溶液的叶绿素含量, m g / L。溶液中叶绿素含量需要转换为叶片叶绿素含量Chl m g / g。计算方法如公式(4)所示。
C h l = V × C 1000   m
其中,V为萃取液体积,L;m为叶片质量,mg。
将叶片去除叶脉,使用电子天平称取叶片鲜重质量( W F),再将叶片放入蒸馏水中2 h,使其完全膨胀,取出叶片,将叶片擦干,再次称取叶片饱和质量( W S),最后将叶片放入干燥箱中,105℃杀青0.5 h,80℃恒温烘烤至叶片恒重。此时的质量为叶片干重质量( W D)。叶片(相对)含水量(Liquid Water Content,LWC)计算方法如公式(5)所示。
L W C   =   W F     W D W S     W D

2.4 数据处理方法

采集的高光谱图像中叶肉、叶脉和背景部分的光谱存在明显的差异(图2)。其中背景部分光谱整体反射率低于0.1。叶肉部分的光谱曲线呈现典型的植物特性,具有绿峰、红谷、红边等特征。叶脉部分在400~1300 nm的光谱反射率整体高于叶肉光谱反射率;而在1300~1700 nm的光谱反射率低于叶肉。由于叶片叶脉部分叶绿素含量很低,因此本研究对高光谱图像进行分割处理以去除叶脉和背景,只保留叶肉部分用于提取光谱信息。
图2 叶片各区域光谱差异以及叶肉部分分割结果

Fig. 2 The spectral differences for each leaf segment and the segmentation results for leaf lamina area

由于背景、叶肉和叶脉的光谱反射率差异主要集中在550和1100 nm波段,因此在提取以上两波段的反射率图像时使用大津法分割叶脉、叶肉和背景,保留叶肉区域图像(图2(c)),并提取区域内像素,同时计算叶肉平均光谱。
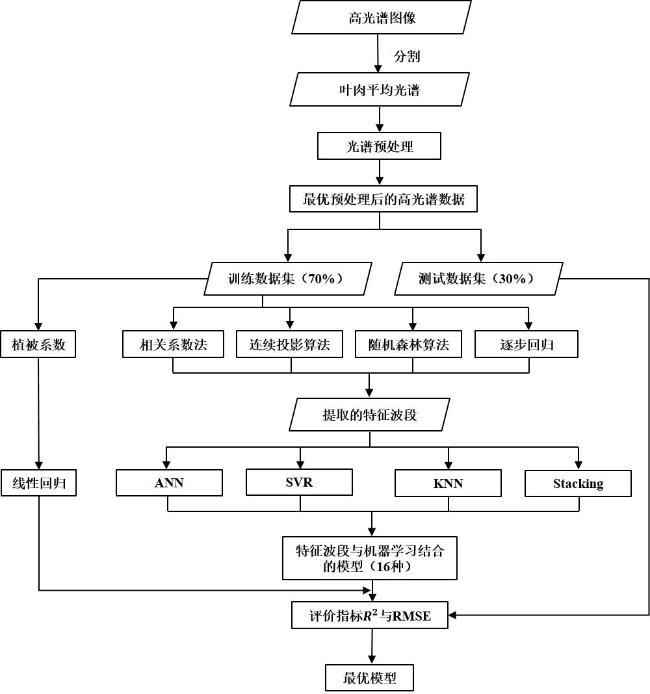
本研究采用“预处理-特征提取-机器学习反演”的算法流程框架(图3)。首先,对光谱进行预处理以消除环境、仪器等因素造成的噪声,突出光谱中有用信息。本研究分析的预处理方法包括卷积平滑法9(Savizky-Golay,SG)、多元散射校正10(Multiplicative Scatter Correction,MSC)、变量标准化11(Standard Normal Variate,SNV)、一阶导数(First Derivative,FD)和二阶导数(Second Derivative,SD)。
图3 叶绿素含量和含水量反演研究整体流程

Fig. 3 The overall process for the study of the estimation of leaf chlorophyll content and water content

其次,对预处理后的光谱进行特征提取与数据降维以减少光谱曲线中的冗余信息,防止过拟合。光谱数据降维与特征提取方法包括特征波长提取和植被系数法,特征波长提取包括连续投影算法12(Successive Projections Algorithm,SPA)、Pearson相关系数法、随机森林算法(Random Forest,RF)和逐步回归分析(Stepwise Regression,SR)。植被系数(Vegetation Index,VI)是某些特定波段反射率的线性或非线性组合。本研究分析传统植被系数(表2)对叶绿素含量和含水量的反演能力,并对几种常用植被系数(表3)的波段进行重新调整以构建新的植被系数,包括差值系数(Difference Index,DI)、比值系数(Ratio Index,RI)和归一化差值植被系数(Normalized Difference Vegetation Index,NDVI),并评估其反演能力。
表2 常用传统植被系数

Table 2 Traditional vegetation indices

植被名称及计算公式 描述

参考

文献

GI= R 554 / R 667 (6)

叶绿素

含量相关的植被系数

13
CI_730 = R 800 / R 730 1.0 (7) 14
CI_709 = R 800 / R 709 1.0 (8) 14
Chl_green =   R 800 / R 550 1.0 (9) 15
NDRE =   ( R 790 R 720 ) / ( R 790 + R 720 ) (10) 16
RGVI = R 550 / R 670 (11) 17
MTCI = ( R 754 - R 709 ) / ( R 709 + R 681 ) (12) 18
NDWI = ( R 860 R 1240 ) / ( R 860 + R 1240 ) (13)

含水量

相关的植被系数

19
MSI = R 1600 / R 820 (14) 20
hNDVI = ( R 900 R 680 ) / ( R 900 + R 680 ) (15) 21
WI =   R 900 / R 970 (16) 22
SRWI = R 820 / R 1200 (17) 23
NDII = ( R 820 R 1649 ) / ( R 820 + R 1649 ) (18) 21

注: R i为波长i nm对应的光谱反射率

表3 植被系数名称及公式

Table 3 Vegetation index names and formulas

植被系数名称及计算公式 参考文献
D I = R i / R j (19) 24
R I = R i / R j (20) 24
N D V I = ( R i + R j ) / ( R i + R j ) (21) 24

注: RiRj 分别代表波长ij nm对应的反射率

随后,利用机器学习技术构建叶绿素含量和含水量反演模型。机器学习方法包括PLSR、神经网络(Artificial Neural Network,ANN)、支持向量回归(Support Vector Regression,SVR)、K近邻(K-nearest Neighbor,KNN)和Stacking。
最后,通过系统比较不同预处理方法、数据降维方法与机器学习模型的性能,选择性能最优的叶绿素含量和含水量反演模型。本研究随机将70%的光谱样本数据(202个样本)作为训练数据集,用于比较不同预处理和特征提取方法,并训练反演模型;将剩余30%的光谱样本数据(86个样本)作为测试数据集,用于评估反演模型性能。使用的模型性能评价指标包括决定系数 R 2和均方根误差(Root Mean Squared Error,RMSE)。

3 结果与讨论

3.1 不同程度干旱胁迫下的玉米叶片光谱特征与变化趋势分析

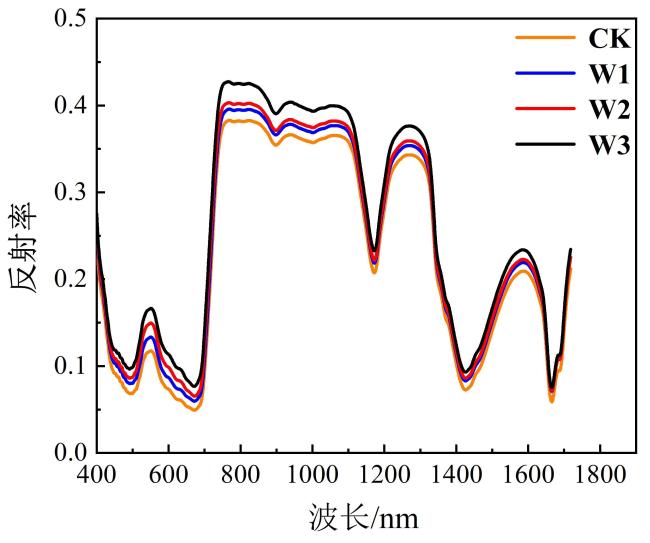
受胁迫与未受胁迫叶片表现出不同的光谱特征(图4),即随着胁迫的加重,叶片反射率在波长400~1700 nm范围内随干旱胁迫程度逐步递增,但光谱曲线总体趋势一致。
图4 不同干旱胁迫下玉米叶片光谱曲线

Fig. 4 Spectral profiles of maize leaves under different drought stresses

该现象的植物生理学原因可分波段解释:400~750 nm波段反射率受叶绿素吸收作用影响,干旱胁迫会导致玉米叶片叶绿素分解,使叶片的叶绿素含量降低;750~1350 nm波段的反射率主要受叶片内部结构的影响,干旱胁迫会使叶片内部结构发生损伤;1350~1700 nm波段的反射率受水的吸收作用影响,干旱胁迫会降低叶片的含水量。

3.2 不同光谱预处理方法的性能比较

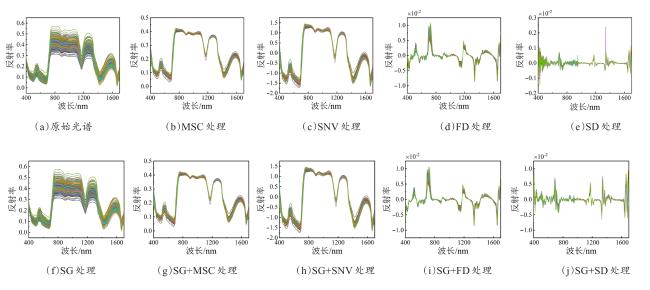
将SG、MSC、SNV、FD、SD、SG+MSC、SG+SNV、SG+FD和SG+SD共9种算法用于光谱数据预处理(图5),可见SG平滑后的光谱曲线与原始光谱差异不明显。这是由于提取光谱为叶肉部分的平均光谱,噪声较少。而经过MSC和SNV归一化处理后的光谱分布变得集中。经过FD和SD差分处理后的光谱吸收峰的数量明显增加。
图5 不同预处理后的玉米叶片反射光谱曲线图

Fig. 5 Plots of reflectance spectra of corn leaves using different preprocessing algorithms

为评估不同预处理方法的性能,将原始光谱数据和其他9种预处理后的光谱数据作为PLSR的输入,叶绿素含量和含水量作为PLSR的输出,通过5折交叉验证确定最佳主成分数参数,并使用验证集评估预测性能,进而确定最优的光谱预处理方法(表4)。SG+MSC预处理对叶绿素含量预测性能最佳;原始光谱数据对含水量预测性能最佳。因此,在后续反演模型的建立中,采用SG+MSC预处理光谱数据用于叶绿素反演;采用原始光谱数据用于含水量反演。
表4 不同预处理后光谱与原始光谱对叶绿素含量和含水量预测性能

Table 4 Inversion performance of different pre-treated and original spectra for chlorophyll content and water content

反演目标

预处理

方法

主成

分数

训练集 验证集
R t 2 R M S E t R c v 2 R M S E c v
叶绿素含 量/(mg·g-1 10 0.857 0.307 0.839 0.312
SG 10 0.866 0.298 0.832 0.318
MSC 11 0.867 0.297 0.831 0.312
SNV 12 0.873 0.289 0.823 0.326
FD 6 0.908 0.247 0.838 0.312
SD 4 0.908 0.246 0.809 0.339
SG+MSC 11 0.857 0.307 0.839 0.311
SG+SNV 12 0.872 0.291 0.825 0.324
SG+FD 6 0.884 0.277 0.830 0.320
SG+SD 4 0.898 0.260 0.807 0.341
含水量/% 11 0.877 3.05 0.843 3.57
SG 11 0.877 3.09 0.843 3.58
MSC 13 0.856 3.34 0.796 4.07
SNV 14 0.863 3.26 0.702 4.92
FD 5 0.849 3.42 0.624 5.53
SD 4 0.868 3.20 0.710 4.85
SG+MSC 13 0.855 3.35 0.796 4.07
SG+SNV 14 0.861 3.28 0.706 4.89
SG+FD 5 0.839 3.53 0.632 5.47
SG+SD 4 0.862 3.27 0.734 4.65

3.3 基于特征波长的玉米叶片叶绿素含量和含水量反演模型构建

3.3.1 特征波长提取结果分析

不同特征波长提取方法筛选获得的波段如图6所示。其中SPA算法以RMSE最小值对应变量数确定提取的特征波长数量。叶绿素含量反演提取的15个特征波长分布于整个波段范围内(图6(a));含水量反演提取的16个特征波长主要集中在大于900 nm的波长范围(图7(a))。Pearson相关系数法计算各波长反射率与叶绿素含量和含水量的相关系数,根据其绝对值从大到小对波长排序。随后依次选取不同数量波长与线性回归方法结合,分别建立叶绿素含量和含水量的反演模型以评估最优特征波长数量。最终选取相关系数绝对值通过将相关系数绝对值从大到小排序,选取前25个波长作为叶绿素含量反演的特征波长(图6(b));选取相关系数绝对值前35的波长作为含水量反演的特征波长(图7(b))。RF算法计算每个波长对叶绿素含量、含水量反演的,表征变量重要性的基尼系数25。对于叶绿素含量以及含水量反演,基尼系数较高的波长分别集中在400~800 nm波段以及800~1350 nm波段。根据基尼系数从大到小对波长排序,随后依次选取不同数量波长与线性回归方法结合,分别建立叶片叶绿素含量和含水量的反演模型以评估最优特征波长数量。最终选取基尼系数从大到小前20的波长作为叶绿素含量反演的特征波长(图6(c));从大到小选取前25个基尼系数对应的波长作为含水量反演的特征波长(图7(c))。SR算法为叶绿素含量反演选择了9个特征波长,分布于整个波段范围内(图6(d));为含水量的反演选择了13个特征波长,集中在1300 nm波长附近(图7(d))。
图6 各算法提取用于叶绿素含量反演的特征波长分布

(a)SPA算法 (b)相关系数法 (c)RF算法 (d)SR算法

Fig. 6 Distributions of the characteristic wavebands extracted for chlorophyll content inversion by algorithms

图7 各算法提取用于含水量反演的特征波长分布

(a)SPA算法 (b)相关系数法 (c)RF算法 (d)SR算法

Fig.7 Distributions of the characteristic wavebands extracted for water content inversion by each algorithm

3.3.2 基于特征波长的反演模型性能分析

为比较不同特征波段提取方法和回归方法对叶绿素含量和含水量反演性能的影响,将基于SPA、相关系数、RF、SR这4种方法提取的特征波长以及全波长共5组变量,分别作为ANN、SVR、KNN和Stacking共4种回归方法的输入。分别以叶绿素含量和含水量作为输出,各建立20种模型。其中Stacking的初始学习器采用ANN、SVR、KNN和线性回归器进行预测。通过5折交叉验证确定最佳参数,使用测试集评估模型预测性能,进而分别确定性能最优的叶绿素含量和含水量的反演模型方法。
对于叶绿素含量的预测,不同模型性能如表5所示。通过比较可知,结合SR特征提取和Stacking回归的模型为反演叶绿素含量性能最优的模型,测试集决定系数 R p 2为0.878,测试集 R M S E p为0.317 mg/g(图8)与使用全波段Stacking模型相比,结合SR特征提取和Stacking回归的模型不仅在测试集上使决定系数 R p 2提高2.90%, R M S E p降低0.036 mg/g,同时使模型的输入变量数降为9,减少99.31%。由此可以证明,SR特征提取算法能够在叶绿素含量预测中有效地提取特征波长,去除冗余信息,从而提高预测性能。
表5 不同模型对玉米叶片叶绿素含量的预测性能

Table 5 Inversion results of different models for chlorophyll content of maize leaves

特征波长提取方法

回归

方法

训练集 测试集
R t 2 R M S E t/(mg·g-1 R p 2 R M S E p/(mg·g-1
ANN 0.849 0.292 0.812 0.394
SVR 0.854 0.288 0.865 0.334
KNN 0.831 0.309 0.766 0.439
Stacking 0.870 0.272 0.849 0.353
SPA ANN 0.898 0.241 0.816 0.390
SVR 0.845 0.297 0.806 0.400
KNN 0.844 0.298 0.750 0.455
Stacking 0.869 0.273 0.840 0.364
相关系数 ANN 0.833 0.308 0.773 0.433
SVR 0.752 0.375 0.741 0.462
KNN 0.596 0.479 0.587 0.584
Stacking 0.761 0.368 0.775 0.431
RF ANN 0.807 0.331 0.774 0.432
SVR 0.764 0.366 0.735 0.468
KNN 0.615 0.467 0.594 0.579
Stacking 0.791 0.343 0.778 0.428
SR ANN 0.847 0.295 0.867 0.331
SVR 0.828 0.312 0.849 0.353
KNN 0.810 0.328 0.796 0.410
Stacking 0.855 0.287 0.878 0.317
图8 使用SR-Stacking模型对测试集数据的叶绿素含量预测结果散点图

Fig.8 Scatter plot of chlorophyll content prediction results using the SR-Stacking model on the testing dataset

对于含水量的预测,不同模型性能如表6所示。通过比较,并考虑模型输入参数量,可以确定以ANN和SVR为回归方法时,结合SPA特征提取和Stacking回归的模型为反演叶绿素含量性能最优的模型,测试集决定系数 R p 2为0.878,测试集 R M S E p为0.317 mg/g(图9)。与使用全波段Stacking模型相比,结合SPA特征提取和Stacking回归的模型不仅在测试集上决定系数 R p 2提高0.2%、 R M S E p降低0.03%,同时使模型的输入变量数降为16,减少98.77%。由此可以证明,SPA特征提取算法能够在含水量预测中有效地提取特征波长,去除冗余信息,从而提高预测性能。
表6 不同模型对玉米叶片含水量的预测性能

Table 6 Inversion performance of different models for the water content of maize leaves

特征波长

提取方法

回归方法 训练集 测试集
R t 2 R M S E t/% R p 2 R M S E p/%
ANN 0.767 3.99 0.835 4.06
SVR 0.709 4.47 0.799 4.47
KNN 0.777 3.92 0.804 4.41
Stacking 0.792 3.78 0.857 3.78
SPA ANN 0.746 4.19 0.809 4.37
SVR 0.710 4.47 0.784 4.64
KNN 0.812 3.60 0.827 4.16
Stacking 0.815 3.58 0.859 3.75
相关系数 ANN 0.597 5.28 0.711 5.37
SVR 0.508 5.83 0.595 6.36
KNN 0.643 4.96 0.699 5.48
Stacking 0.639 4.99 0.724 5.24
RF ANN 0.604 5.23 0.699 5.47
SVR 0.536 5.66 0.539 6.77
KNN 0.639 4.99 0.695 5.51
Stacking 0.633 5.04 0.762 4.87
SR ANN 0.753 4.13 0.821 4.22
SVR 0.719 4.40 0.805 4.41
KNN 0.764 4.03 0.781 4.67
Stacking 0.785 3.85 0.848 3.90
图9 使用SPA-Stacking模型对测试集数据的含水量预测结果散点图

Fig. 9 Scatter plot of water content prediction results using the SPA-Stacking model on the testing dataset

3.4 基于植被系数的玉米叶片含水量和叶绿素含量反演模型构建

使用预处理后的光谱数据构建如表2所示的传统植被系数,通过线性回归建立叶绿素含量和含水量的反演模型,各传统植被系数的预测性能如表7所示。所有基于植被系数建立的线性回归反演模型 R p 2都低于0.5,说明其对叶绿素含量和含水量预测性能较差。
表7 不同植被系数对叶绿素含量和含水量的预测性能

Table 7 Performance of different vegetation indices in the inversion of chlorophyll content and water content

反演目标 植被系数 训练集 测试集
R c 2 R M S E c R p 2 R M S E p
叶绿素含量/(mg·g-1 GI 0.130 0.704 0.015 0.902
CI_730 0.281 0.640 0.150 0.838
CI_709 0.367 0.601 0.292 0.765
Chl_green 0.523 0.522 0.438 0.687
NDRE 0.300 0.632 0.187 0.819
RGVI 0.126 0.706 0.012 0.903
MTCI 0.271 0.645 0.208 0.809
含水量/% NDWI 0.034 8.25 0.015 10.74
MSI 0.324 6.14 0.150 9.51
hNDVI 0.204 7.01 0.293 8.20
WI 0.400 5.68 0.338 7.80
SRWI 0.300 6.31 0.187 9.13
NDII 0.126 7.55 0.012 10.77
因此,探究重新选择传统植被系数中的波长,进而构建新的植被系数用于叶绿素含量和含水量预测的可行性。对于新的植被系数构建,首先根据表3中各植被系数的计算公式,计算400~1700 nm范围内所有这两种波长组合的差值系数(Difference Index,DI)、比值系数(Ratio Index,RI)和归一化植被系数(Normalized Difference Vegetation Index,NDVI);其次分析计算获得的DI、RI、NDVI与叶绿素含量和含水量的相关性(图10);对于叶绿素而言,用于计算植被系数的波段为可见光;而对于含水量而言,用于计算植被指数的波段为可见光和近红外光。最后选取相关系数绝对值最大的波段组合构建新植被系数(表8)。
图10 新构建植被系数与叶绿素含量和含水量相关系数热力图

Fig. 10 Heat maps of correlation coefficients between the newly constructed vegetation coefficients and chlorophyll content and water content, respectively

表8 新构建的植被系数对应的相关系数最大值及波长位置

Table 8 The maximum correlation coefficient and wavelength position corresponding to the newly constructed vegetation coefficient

植被系数 叶绿素含量 含水量
R m a x 波长位置(ij)/nm R m a x 波长位置(ij)/nm
DI 0.882 (420,558) 0.783 (742,1681)
RI 0.892 (420,559) 0.898 (400,1171)
NDVI 0.889 (410,559) 0.890 (410,1348)
将新构建的植被系数分别用于建立叶绿素含量和含水量的线性回归反演模型。结果表明,当使用新构建的植被系数时,预测性能相比于使用传统植被系数的预测性能具有明显提升。对于叶绿素含量反演,基于归一化植被系数NDVI(410,559)建立的回归模型预测精度最高, R p 2为0.803, R M S E p为0.403 mg/g。对于含水量反演,基于比值植被系数RI(400,1171)建立的回归模型预测精度最高, R p 2为0.827, R M S E p为3.28%(表9)。
表9 新构建植被系数对叶绿素含量和含水量预测性能

Table 9 The inversion performance of the newly constructed vegetation coefficients for chlorophyll content and water content

反演目标 植被系数 回归方程 训练集 测试集
R c 2 R M S E c R p 2 R M S E p
叶绿素含量/(mg·g-1 DI(420,558) y=28.96x+1.959 (22) 0.769 0.363 0.785 0.421
RI(420,559) y= ‒8.691x+10.914 (23) 0.774 0.358 0.791 0.415
NDVI(410,559) y=15.13x+2.268 (24) 0.784 0.351 0.803 0.403
含水量/% DI(742,1681) y=2.014x+1.340 (25) 0.731 3.42 0.799 3.53
RI(400,1171) y= ‒0.9413x+1.5327 (26) 0.788 3.04 0.827 3.28
NDVI(410,1348) y= ‒1.526x+0.5752 (27) 0.775 3.12 0.807 3.46

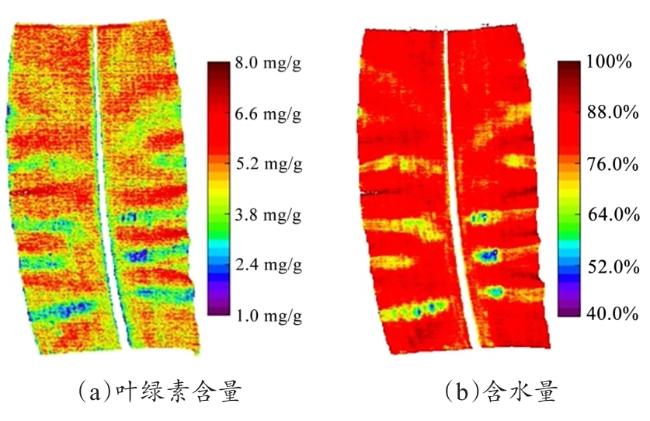
3.5 玉米叶片生理信息可视化

本研究使用SR提取的9个特征波长和SR-Stacking模型对叶片叶绿素含量进行可视化研究;使用SPA提取的16个特征波长和SPA-Stacking模型对叶片含水量进行可视化研究。通过对高光谱图像中叶肉的每个像素点进行分析,将SR选择的9个特征波长的反射率作为SR-Stacking模型的输入,输出每个像素对应的叶绿素含量;使用SPA选择的16个特征波长的反射率作为SPA-Stacking模型的输入,输出每个像素对应的含水量,并以此构建叶片的叶绿素含量与含水量分布图(图11)。结果表明,对叶片生理参数的可视化,可以更加详细、直观地发现同一叶片不同区域之间生理参数的差异,可用于玉米的生长监测、病害检测、植物育种等研究领域。
图11 玉米叶片叶绿素含量和含水量分布热力图

Fig. 11 Heatmaps of the distribution of chlorophyll content and water content of a corn leaf

4 结 论

本研究以玉米苗期叶片为对象,研究了基于高光谱成像技术的干旱胁迫下叶片生理信息(叶绿素含量和含水量)的快速无损检测方法和叶片生理信息分布的可视化方法。首先基于图像处理技术构建高光谱图像分割算法,用于提取叶肉区域并提取平均反射光谱,排除图像中背景与叶脉部分的干扰;其次,通过系统地分析不同特征波长提取方法和机器学习回归模型对叶绿素含量和含水量的预测性能的影响,分别建立了最优性能的叶绿素含量和含水量的反演模型;最后,探究了构建可用于叶绿素含量、含水量的反演的植被系数并评估了其反演能力。
研究结果表明,将光谱技术用于干旱胁迫玉米叶片生理参数的分析能够实现生理参数的准确、快速检测。对于叶绿素含量检测,使用SG+MSC预处理光谱、SR提取特征波长、建立Stacking模型可获得最优性能。对于含水量检测,使用原始光谱,SPA提取特征波长,建立Stacking模型可获得最优性能。该研究可为玉米早期干旱、营养胁迫预警提供方法和技术支持。但本研究不足在于光谱数据在室内采集,考虑到田间环境往往较为复杂,后续将对模型进行迁移学习以提高其在不同环境下的泛化能力,力争开发出适用于智慧农业的田间干旱、营养胁迫在线监测系统。

利益冲突声明

本研究不存在研究者以及与公开研究成果有关的利益冲突。

1
吕梦琪, 宋宇杰, 翁海勇, 等. 近红外高光谱成像扫描速度对拟南芥冠层含水率预测的影响[J]. 光谱学与光谱分析, 2020, 40(11): 3508-3514.

LYU M Q, SONG Y J, WENG H Y, et al. Effect of near infrared hyperspectral imaging scanning speed on prediction of water content in Arabidopsis [J]. Spectroscopy and spectral analysis, 2020, 40(11): 3508-3514.

2
张金富, 汤斌, 王建旭, 等. 基于近红外光谱的苹果可溶性固形物特征波长筛选建模对比分析[J/OL].激光与光电子学进展. (2022-11-01)[2023-08-12].

ZHANG J F, TANG B, WANG J X, et al. Comparative analysis of characteristic wavelength screening of apple soluble solids based on near-infrared spectroscopy[J/OL]. Laser & Optoelectronics Progress. (2022-11-01) [2023-08-12].

3
杨晶晶, 卢俊玮. 光谱技术在花生品质检测中的应用研究进展[J]. 作物研究, 2018, 32(4): 345-348.

YANG J J, LU J W. Research progress of spectral technology in peanut quality detection[J]. Crop research, 2018, 32(4): 345-348.

4
孙俊, 金夏明, 毛罕平, 等. 基于高光谱图像的生菜叶片氮素含量预测模型研究[J]. 分析化学, 2014, 42(5): 672-677.

SUN J, JIN X M, MAO H P, et al. A model for predicting nitrogen of lettuce leaves based on hyperspectral imaging[J]. Chinese journal of analytical chemistry, 2014, 42(5): 672-677.

5
GAO D H, LI M Z, ZHANG J Y, et al. Improvement of chlorophyll content estimation on maize leaf by vein removal in hyperspectral image[J]. Computers and electronics in agriculture, 2021, 184: ID 106077.

6
TAN K Z, WANG S W, SONG Y Z, et al. Estimating nitrogen status of rice canopy using hyperspectral reflectance combined with BPSO-SVR in cold region[J]. Chemometrics and intelligent laboratory systems, 2018, 172: 68-79.

7
SHU M Y, DONG Q Z, FEI S P, et al. Improved estimation of canopy water status in maize using UAV-based digital and hyperspectral images[J]. Computers and electronics in agriculture, 2022, 197: ID 106982.

8
LICHTENTHALER H K, WELLBURN A R. Determinations of total carotenoids and chlorophylls a and b of leaf extracts in different solvents[J]. Biochemical society transactions, 1983, 11(5): 591-592.

9
MASSAOUDI M, REFAAT S S, ABU-RUB H, et al. PLS-CNN-BiLSTM: An end-to-end algorithm-based savitzky-golay smoothing and evolution strategy for load forecasting[J]. Energies, 2020, 13(20): ID 5464.

10
BAO Y D, KONG W W, LIU F, et al. Detection of glutamic acid in oilseed rape leaves using near infrared spectroscopy and the least squares-support vector machine[J]. International journal of molecular sciences, 2012, 13(11): 14106-14114.

11
CHEN Q S, JIANG P, ZHAO J W. Measurement of total flavone content in snow lotus (Saussurea involucrate) using near infrared spectroscopy combined with interval PLS and genetic algorithm[J]. Spectrochimica acta part A: Molecular and biomolecular spectroscopy, 2010, 76(1): 50-55.

12
ARAÚJO M C U, SALDANHA T C B, GALVÃO R K H, et al. The successive projections algorithm for variable selection in spectroscopic multicomponent analysis[J]. Chemometrics and intelligent laboratory systems, 2001, 57(2): 65-73.

13
ZARCO-TEJADA P J, BERJÓN A, LÓPEZ-LOZANO R, et al. Assessing vineyard condition with hyperspectral indices: Leaf and canopy reflectance simulation in a row-structured discontinuous canopy[J]. Remote sensing of environment, 2005, 99(3): 271-287.

14
MEHDAOUI R, ANANE M. Exploitation of the red-edge bands of sentinel 2 to improve the estimation of durum wheat yield in Grombalia region (Northeastern Tunisia)[J]. International journal of remote sensing, 2020, 41(23): 8986-9008.

15
GITELSON A A, KEYDAN G P, MERZLYAK M N. Three-band model for noninvasive estimation of chlorophyll, carotenoids, and anthocyanin contents in higher plant leaves[J]. Geophysical research letters, 2006, 33(11): 431-433.

16
FITZGERALD G, RODRIGUEZ D, O'LEARY G. Measuring and predicting canopy nitrogen nutrition in wheat using a spectral index: The canopy chlorophyll content index (CCCI)[J]. Field crops research, 2010, 116(3): 318-324.

17
JORDAN C F. Derivation of leaf-area index from quality of light on the forest floor[J]. Ecology, 1969, 50(4): 663-666.

18
DASH J, CURRAN P J. The MERIS terrestrial chlorophyll index[J]. International journal of remote sensing, 2004, 25(23): 5403-5413.

19
GAO B C. NDWI: A normalized difference water index for remote sensing of vegetation liquid water from space[J]. Remote sensing of environment, 1996, 58(3): 257-266.

20
HUNT E R, ROCK B N. Detection of changes in leaf water content using near- and middle-Infrared reflectances[J]. Remote sensing of environment, 1989, 30(1): 43-54.

21
ZHANG J J, ZHANG W, XIONG S P, et al. Comparison of new hyperspectral index and machine learning models for prediction of winter wheat leaf water content[J]. Plant methods, 2021, 17(1): 1-14.

22
PENUELAS J, PINOL J, OGAYA R, et al. Estimation of plant water concentration by the reflectance Water Index WI (R900/R970)[J]. International journal of remote sensing, 1997, 18(13): 2869-2875.

23
ZARCO-TEJADA P J, USTIN S L. Modeling canopy water content for carbon estimates from MODIS data at land EOS validation sites[C]// IGARSS 2001. Scanning the Present and Resolving the Future. Proceedings. IEEE 2001 International Geoscience and Remote Sensing Symposium (Cat. No.01CH37217). Piscataway, New Jersey, USA: IEEE, 2002: 342-344.

24
SUN H, FENG M C, XIAO L J, et al. Assessment of plant water status in winter wheat (Triticum aestivum L.) based on canopy spectral indices[J]. PLoS one, 2019, 14(6): ID e0216890.

25
MENZE B.H., KELM B.M., MASUCH R . et al. A comparison of random forest and its Gini importance with standard chemometric methods for the feature selection and classification of spectral data[J]. BMC Bioinformatics, 2009, 10(1): 1-16.

文章导航

/