


0 引 言
电容耦合非接触电导检测(Capacitively Coupled Contactless Conductivity Detection, C4D)因其极高的准确性、灵敏度及无需直接接触溶液等优 点,在农业土壤、农业用水等复杂农业环境样品检测[1, 2]中应用广泛。C4D信号中的特征峰高度[3]或面积[4]与样品离子浓度在一定范围内存在线性关系。因此,C4D信号峰检测是进一步定量样品中离子浓度的关键步骤。然而,C4D信号会受到多种因素的影响,如样品不纯、基线漂移和仪器产生的随机噪声[5, 6],这可能会导致识别出假峰或漏识别真峰。此外,通过可视化手动验证峰检测结果非常耗时,这对峰检测提出了巨大挑战。因此,设计一种自动且准确的C4D信号峰检测方法对定量复杂农业环境样品离子浓度具有重要意义。
目前,峰自动识别算法主要有导数法[7, 8]、曲线拟合法[9, 10]、滑动窗口法[11, 12]、自适应寻峰法[13, 14]、小波变换法[15-18]等。Zhai等[19]通过检测农作物表面毒死蜱物质得到的谱图,利用自适应缩放和二阶导数结合的方法识别谱图中的特征峰;Hong等[20]利用分数阶导数的方法识别农业土壤中的重金属离子谱图中的特征峰;李传文等[21]通过毛细管结合电容耦合非接触电导检测(Capillary Electrophoresis and Capacitively Coupled Contactless Conductivity Detection, CE-C4D)仪器检测农业土壤中的养分离子,利用导数法和高斯曲线拟合的方法识别谱图中的特征峰。以上方法虽然能够有效识别出特征峰,但也会识别出因噪声产生的假峰或识别的峰值位置不准确。
相比于其他谱峰自动识别方法,小波变换因其受干扰影响较小、对弱峰和重叠峰识别效果较好[22, 23]等优势在谱峰自动识别算法中应用广泛。Du等[15]应用基于连续小波变换的峰值检测算法,降低了噪声和基线漂移对峰检测的干扰,此方法虽然提高了对弱峰的识别,但对重叠峰的检测结果并不理想。Liu等[16]改进了母小波以缩短其线宽,识别谱峰并取得了良好的效果。该方法在重叠峰检测方面有较好的表现,但仍会导致弱峰丢失和识别假峰。Zheng等[17]提出了改进连续小波变换的方法,将小波变换与疯狂攀登算法相结合可以有效识别弱峰和重叠峰,但也会识别出较多的假峰。Zhou等[18]提出了基于图像分割的峰值检测算法,与基于遗传算法的最大类间方差法(Otsu)结合,克服了传统Otsu方法无法处理长尾单峰直方图的不足,能准确识别弱峰和重叠峰,识别出较少的假峰。然而,该方法计算过于复杂。
综上所述,自动准确的峰值检测方法既要有效识别弱峰和重叠峰,又要保持较低的误发现率。针对该问题,本研究提出一种基于连续小波变换结合粒子群优化的最大类间方差法分割图像(Continuous Wavelet Transform Combined with Particle Swarm Optimization of Ostu to Segment Image,CWTSPSO)算法,从而将小波空间中的峰值区域与背景分离,同时消除假脊,结合提取脊线对C4D信号进行峰识别和峰筛选得到准确峰位置,实现土壤养分离子的谱峰自动识别。
1 理论与方法
1.1 连续小波变换
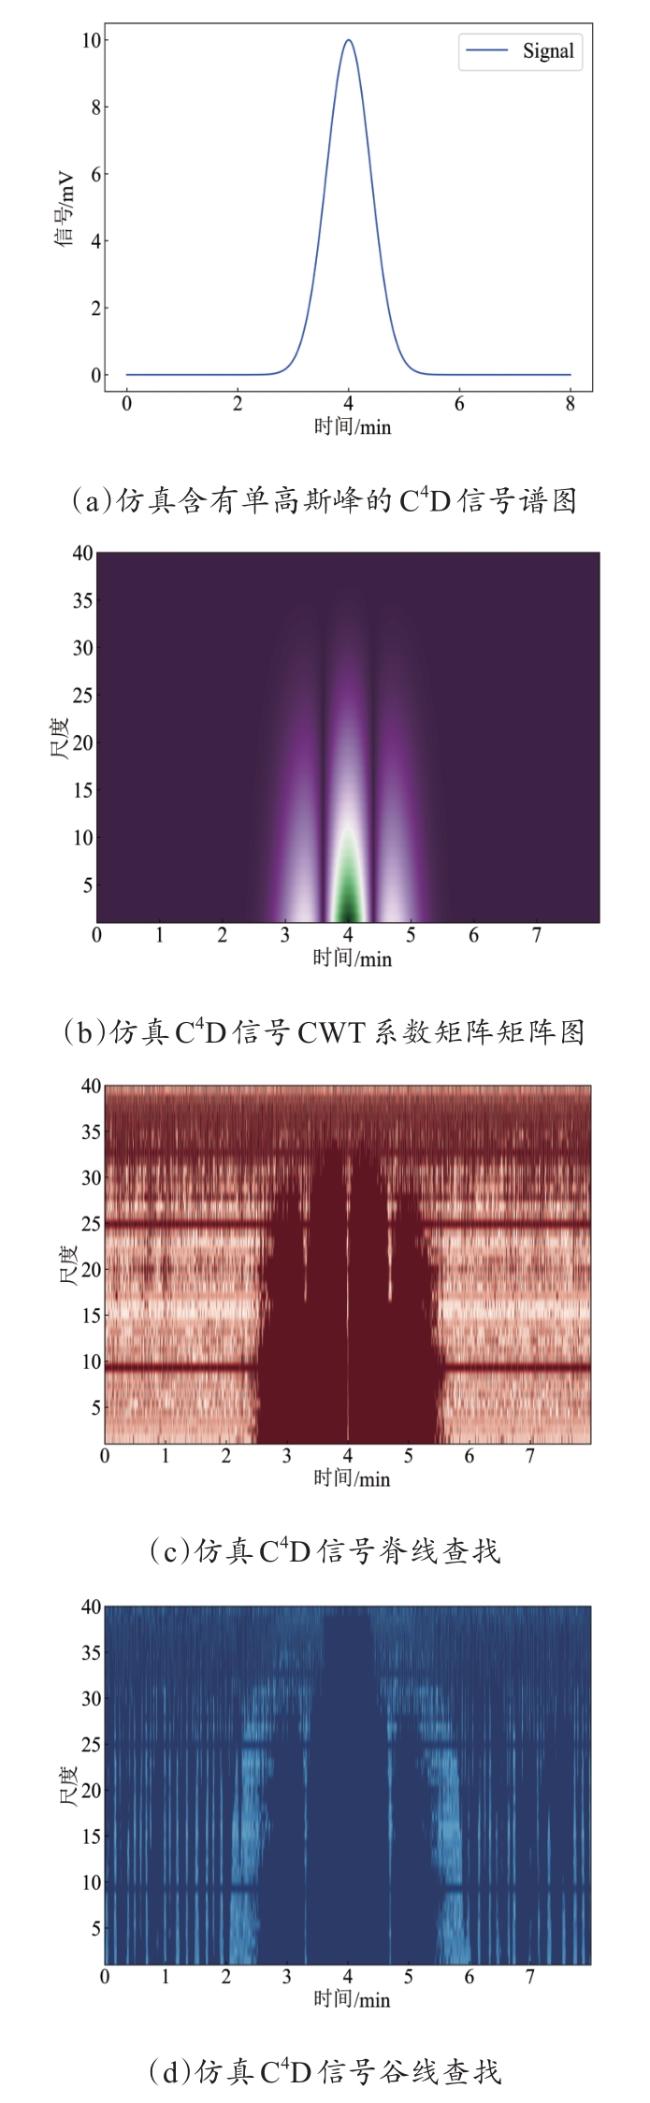
连续小波变换(Continuous Wavelet Transform, CWT)通过在每个尺度的平移变换,使C4D信号中的峰值信息更加明显。CWT表示为公式(1) 。
式中: 为输入信号; 为时间,s; 为尺度参数; 为平移参数; 为小波母函数。
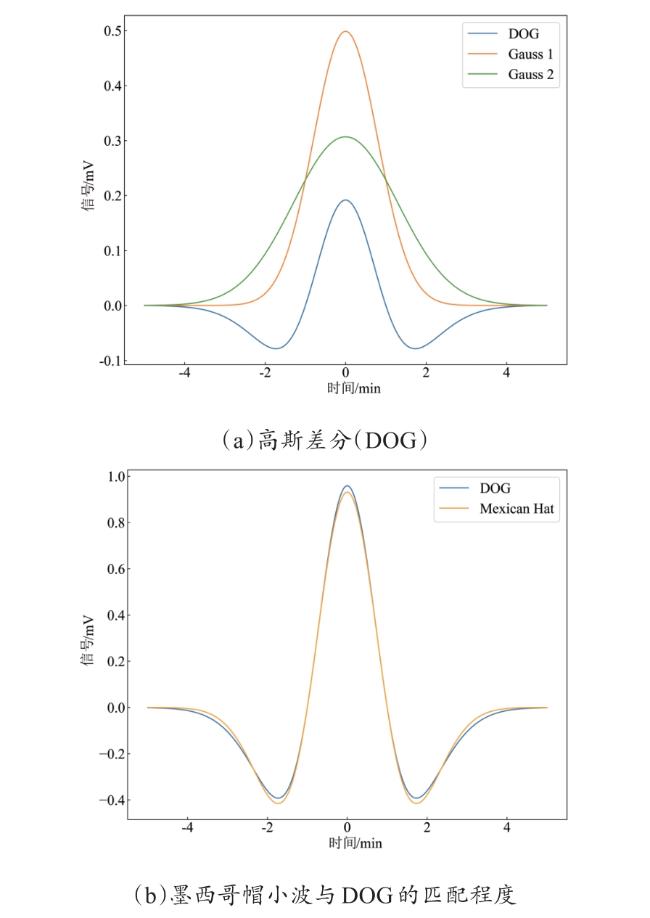
C4D信号峰与高斯峰的形状类似[21]。基于此特征,本研究选择具有近似对称性和一个主高斯峰的墨西哥帽小波,通过墨西哥帽小波对C4D信号进行CWT,建立CWT系数矩阵。
1.2 小波空间中的脊和谷
式中: 为布尔二维矩阵; 为CWT系数矩阵中的一个元素; 和 分别为滑动坐标和尺度。
为找出每一个刻度上的极值,首先设置一个窗口大小为3的滑动窗口用于搜索CWT系数矩阵的局部极值,搜索到的局部极值形成局部最大值布尔矩阵和局部最小值布尔矩阵。但是,当窗口过大时会导致寻找到的局部极值点比较稀疏或不明显;当窗口选择过小,无法确定合适的中值作为局部最大值及局部最小值。
1.3 灰度转换
将CWT系数矩阵转换为灰度图像后再分割灰度图像。由于CWT系数之间的差异较大,为防止灰度的分辨率过低而无法有效识别脊线和谷线区域,使用Logistic映射模式[25]。Logistic映射为非线性映射,可以根据图像的特性自动调整映射函数的参数,如公式(4) 所示。
式中: 为CWT系数矩阵中特定元素的转换值; 为CWT系数矩阵中该元素的值; 为连续小波变换矩阵的均值; 为CWT系数矩阵的标准差。
对CWT系数矩阵中的每个值进行处理。较大的值对应较亮的像素;较小的值对应较暗的像素。通过均值和标准差进行缩放和偏移,应用Logistic函数,将值映射到[0,255]的范围内。
1.4 PSO结合Otsu
PSO优化Otsu最佳分割阈值寻找步骤:
1)粒子群的个体初始化:设定粒子种群数量为15,另外15个粒子的灰度阈值设置为0~255灰度级内的随机整数。
2)设置每个粒子的初始速度:设定粒子的初始速度为5。
3)计算每个粒子的最佳位置和全局最佳位置:计算每个粒子的最大类间方差,并找到全局最大类间方差确定其位置。
4)判断算法是否结束:如果全局最大方差对应的位置不是最优值则重复1)~3)步骤,直到找到最佳分割阈值。
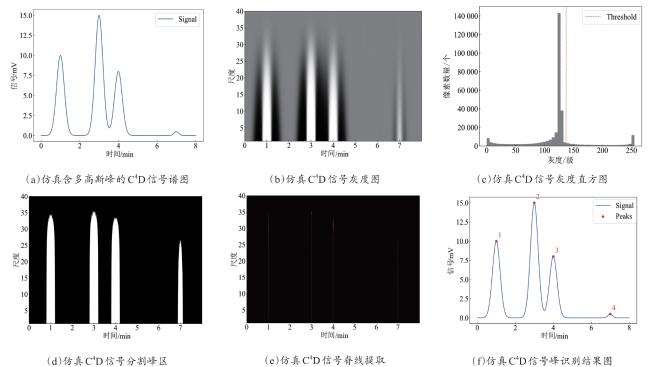
CWT系数矩阵经Logistic映射转换成灰度图像后,应用PSO结合Otsu对灰度图进行分割,峰值区域的灰度值高于平缓区域的灰度值,从而分割出峰值区域。
1.5 峰值识别
在CWT系数矩阵中获取过滤后的脊线和谷线结合PSO-Otsu算法分割出的灰度图像,识别特征峰。峰值识别步骤:
1)提取经PSO-Otsu算法从灰度图像中分割出来的峰区域内的脊线。
2)为消除不规则噪声产生的假峰,根据脊线的长度设置阈值,提取大于该阈值的脊线。
3)根据过滤后的脊线,寻找脊线两侧的谷线,并通过谷线获取峰区域的起点和终点。
4)根据筛选的脊线识别峰区域的峰值位置。
5)根据C4D信号峰位特性对识别的峰值位置进行过滤,特征峰不会过度密集。对于具有相同或相近横坐标的峰,仅保留具有最大纵坐标值的峰。设置边缘阈值,删除位于C4D信号的边缘区域内因CWT产生的假峰,以避免误识别。
在上述峰值识别的过程中,经过PSO-Otsu处理后的峰值区域,在每个峰值区域只会出现一个峰,有效避免假峰,准确识别出真峰,对于弱峰和重叠峰能准确识别出峰值位置。
2 实验结果和讨论
2.1 实验数据
2.1.1 模拟C4D信号谱图数据
为验证所提峰值检测算法的性能,根据公式(5) 仿真生成含有高斯白噪声的C4D信号谱图。
表1 峰识别研究的高斯峰仿真数据Table 1 Gaussian peak simulation data for peak recognition research |
| 峰 | |||
|---|---|---|---|
| 1 2 3 4 | 10.0 9.0 8.0 0.5 | 1.0 3.0 3.6 7.0 | 0.12 0.20 0.18 0.12 |
为进一步评估CWTSPSO方法进行峰值检测的准确性,使用公式(5) 继续生成3组C4D信号数据集,每个数据集里分别含有41、61和102个高斯峰。
2.1.2 真实C4D离子信号谱图数据
通过本课题组研发的毛细管电泳(Capillary Electrophoresis,CE)结合C4D装置(CE-C4D)检测不同浓度的标准离子溶液和真实土壤样品溶液(土壤均采集于在安徽省合肥市农田)。首先,确保仪器部件接线正确,依次打开高压电源、检测器和采集程序。将预处理好的土壤样品溶液放置在毛细管进样口处,进样电压设为10 kV,然后开始仪器的电注射程序,高压模块放电驱动毛细管两端溶液中离子在毛细管中运动[4]。对于钾离子、铵根离子等阳离子检测,采用阳离子缓冲液,电泳电压设置为+14 kV;对于硝酸盐离子、磷酸盐等阴离子检测,采用磷酸盐缓冲溶液和硝酸盐缓冲溶液,电泳电压设置为-14 kV。高压供电后,采集程序将开始记录电泳信号频谱图,目标离子电泳峰出现后,关闭高压电源并停止采集程序,数据在计算机上自动保存[28]。通过CE-C4D装置检测标准溶液和土壤样品溶液,得到的离子谱图包括铵根离子、钾离子、硝酸根离子、磷酸根离子标准溶液谱图,以及农田土壤样品溶液谱图。得到的谱图数据可用于本研究提出的谱峰自动识别算法的验证。
2.2 CWTSPSO的可行性和有效性
本研究通过多组含有噪声的模拟C4D信号谱图验证CWTSPSO在谱峰识别中的可行性和有效性。CWTSPSO具体识别仿真峰的实验结果,如图3所示。
2.3 CWTSPSO的可靠性
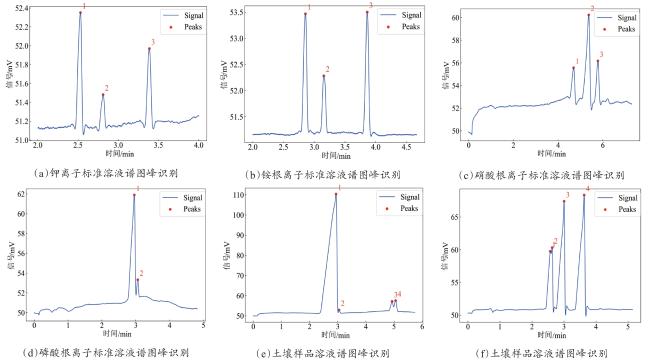
本研究使用真实C4D信号谱图验证CWTSPSO在谱峰识别中的可靠性,通过CE-C4D设备检测样品溶液得到C4D信号谱图。CWTSPSO检测真实C4D信号谱图的实验结果,如图4所示。
2.4 峰值检测结果和比较
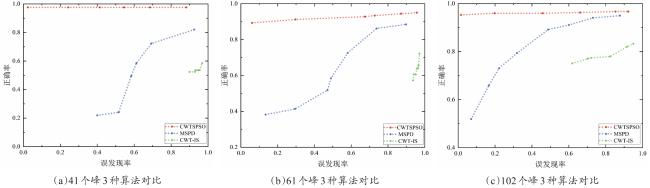
为进一步评估CWTSPSO算法的峰值检测性能,与多尺度峰值检测(Multi Scale Peak Detection, MSPD)和基于CWT的图像分割(Continuous Wavelet Transform and Image Segmentation, CWT-IS)两种方法进行比较。MSPD方法是Zhang等[29]用Python语言开发的开源算法,是在连续小波变换的基础上,充分利用小波空间中的附加信息(包括脊、谷和过零)提出的多尺度峰检测。该方法可从https://github.com/zmzhang/libPeak获得。CWT-IS是Yang等[25]在MATLAB中开发的一种算法。连续小波变换结合图像分割,在图像分割中使用基于模糊数学理论的改进版Otsu方法分割峰值区域,识别特征峰。该方法可以从参考文献[25]的补充信息中下载。使用受试者工作特征(Receiver Operating Characteristic, ROC)曲线作为衡量谱峰识别算法的优劣准则。ROC的误发现率(False Discovery Rate, FDR)和正确率(True Positive Rate, TPR)可以通过公式(6) 和公式(7) 计算。
式中: 为在真值峰值误差范围内检测到的峰值数,个; 为未被检测到的峰值数,个; 为真实峰的数量,个; 为误检测到峰的数量,个。对于具有相同 的峰值检测方法, 越大,方法性能越好。可以逐步调整各方法的阈值,计算出相应的 和 。
在本研究中,选择仿真的3组数据集,分别含有41、61和102个高斯峰。每组数据都通过3种峰检测法重复处理。通过改变每种方法中的阈值参数,可以获得每组C4D仿真信号的 值和 值。CWT-IS的参数设置为20~300,MSPD的阈值从0.001逐渐增加到1,CWTSPSO的阈值从0.001逐渐增加到0.07。根据重复实验每组仿真信号的 值和 值的平均值 绘制每种方法的最终ROC曲线。通过3种方法处理含有41、61和102个峰的仿真数据得到的ROC曲线如图5所示,CWTSPSO的ROC曲线均保持在0.9以上,CWT-IS的 在相同的 下最小,CWTSPSO的 在所有相同的 下都远高于CWT-IS和MSPD的值。
为进一步评估不同方法的峰检测性能,使用 度量值作为比较3种方法峰检测性能的另一个标准。 是误发现率和正确率之间的综合折中,以量化算法的性能。一个更大的 意味着更好的峰检测性能。 定义为公式(8) 。
通过3种方法获得的 对比结果列于表2中。显然,CWTSPSO方法获得的这3组数据集 均大于MSPD和CWT-IS,CWTSPSO的 度量值最高分别为0.976、0.915和0.969,MSPD和CWT-IS的 度量值最高的1组分别为0.754和0.505。通过PSO优化的Otsu算法找到最佳分割阈值分割灰度图像后,即使是弱峰,峰值区域也会很明显,证明CWTSPSO可以实现具有更高正确率的峰检测,同时保持较低的误发现率。
表2 3种算法不同组数据测量值Table 2 Measurements of different groups of data with three algorithms |
| 方法 | 41 peaks | 61 peaks | 102 peaks |
|---|---|---|---|
| CWTSPSO MSPD CWT-IS | 0.976 0.467 0.168 | 0.915 0.545 0.114 | 0.969 0.754 0.505 |
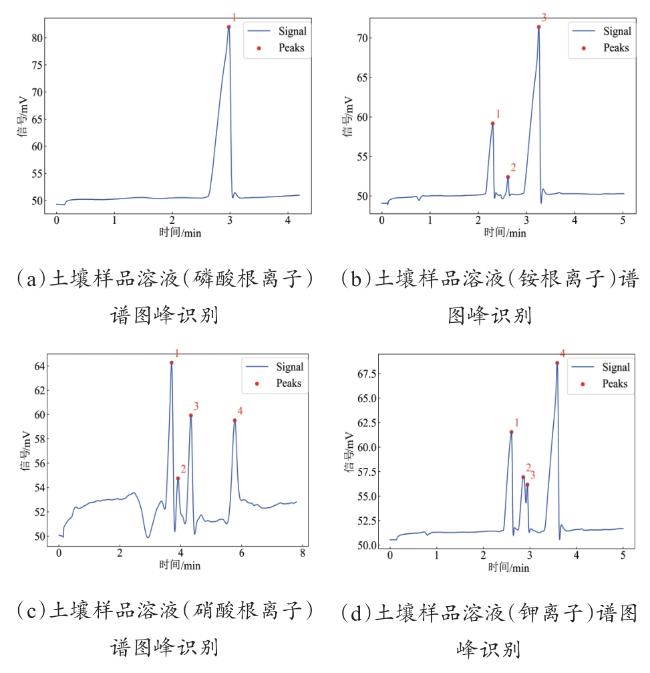
2.5 CWTSPSO在农业土壤养分离子检测的应用
本研究使用CE-C4D装置分别检测4份农田土壤中的养分离子,包括磷酸根离子、铵根离子、钾离子和硝酸根离子谱图。使用CWTSPSO算法识别谱图中的特征峰。通过图6检测结果可知,对于检测磷酸根离子、铵根离子谱图中的单峰,图6(a)中的峰1、图6(b)中的峰1、2和3均可识别;对于检测钾离子、硝酸根离子谱图中重叠峰和弱峰;图6(c)中的峰1和峰2、图6(d)中峰2和峰3的都能准确识别。综合图4(e)可知,谱图中的弱峰也能精准识别。另外,CWTSPSO算法不受基线漂移的影响,对于因电压波动和噪声产生的假峰能有效过滤,不会识别出假峰,极少出现误识别。因此,本研究所提出的CWTSPSO算法可用于非接触电导检测农业土壤养分离子谱图中的特征峰识别。
3 结 论
本研究提出了基于连续小波变化的粒子群优化结合最大类间方差法的谱峰自动识别算法用于识别C4D信号中的特征峰。首先,将C4D信号连续小波变换后,搜索局部极值,使用阶梯扫描法连接局部极值成脊线和谷线。其次,利用PSO-Otsu方法找到将CWT系数转换为灰度图像的最佳分割阈值,分割灰度图像,提取出真实的峰值区域,将真实的峰值区域结合脊线和谷线提取出真实区域内的脊线。最后,筛选出真峰所在的准确位置。与其他方法相比,本研究提出的CWTSPSO方法表现出更好的峰检测性能,对C4D信号的弱峰和重叠峰能够精准识别,有效提升了C4D信号的谱峰识别率和精准性。通过此方法,对于后续的峰面积计算来定量样品离子浓度含量能够更准确,为土壤精准施肥和农作物生长管理提供有力支持。


