欢迎您访问《智慧农业(中英文)》官方网站! English
专刊--农业信息感知与模型

用于小麦多生长阶段倒伏边界精准检测的分层交互特征金字塔网络

  • 庞春晖 1, 6, 7 ,
  • 陈鹏 , 1, 6, 7 ,
  • 夏懿 1 ,
  • 章军 1 ,
  • 王兵 2 ,
  • 邹岩 3, 4 ,
  • 陈天娇 3, 4 ,
  • 康辰瑞 3, 5 ,
  • 梁栋 , 1
展开
  • 1. 安徽大学农业生态大数据分析与应用技术国家地方联合工程研究中心/信息材料与智能感知安徽省实验室/安徽大学互联网学院,安徽 合肥 230601,中国
  • 2. 安徽财经大学 管理科学与工程学院,安徽 蚌埠 233030,中国
  • 3. 中国科学院合肥物质科学院智能机械研究所,安徽 合肥 230031,中国
  • 4. 中国科学技术大学,安徽 合肥 230031,中国
  • 5. 西南科技大学,四川 绵阳 621010,中国
  • 6. 农业传感器与智能感知安徽省技术创新中心,中科合肥智慧农业协同创新研究院,安徽 合肥 231131,中国
  • 7. 安徽鹏视智能科技有限公司,安徽 合肥 230000,中国
1. 陈 鹏, E-mail:
2. 梁 栋, E-mail:

庞春晖, E-mail:

收稿日期: 2023-10-03

  网络出版日期: 2024-04-25

基金资助

国家自然科学基金项目(62072002;62273001)

安徽省科技重大专项(202003a06020016)

安徽省现代农业产业技术体系建设专项资金(2021—2025)

安徽省高校优秀科研创新团队(2022AH010005)

HI-FPN: A Hierarchical Interactive Feature Pyramid Network for Accurate Wheat Lodging Localization Across Multiple Growth Periods

  • PANG Chunhui 1, 6, 7 ,
  • CHEN Peng , 1, 6, 7 ,
  • XIA Yi 1 ,
  • ZHANG Jun 1 ,
  • WANG Bing 2 ,
  • ZOU Yan 3, 4 ,
  • CHEN Tianjiao 3, 4 ,
  • KANG Chenrui 3, 5 ,
  • LIANG Dong , 1
Expand
  • 1. National Engineering Research Center for Agro-Ecological Big Data Analysis & Application/ Information Materials and Intelligent Sensing Laboratory of Anhui Province/ Institutes of Physical Science and Information Technology & School of Internet, Anhui University, Hefei 230601, China
  • 2. School of Management Science and Engineering, Anhui University of Finance & Economics, Bengbu 233030, China
  • 3. Institute of Intelligent Machines, Hefei Institutes of Physical Science, Chinese Academy of Science, Hefei 230031, China
  • 4. University of Science and Technology of China, Hefei 230031, China
  • 5. Southwest University of Science and Technology, Mianyang 621010, China
  • 6. Agricultural Sensors and Intelligent Perception Technology Innovation Center of Anhui Province, Zhongke Hefei Institutes of Collaborative Research and Innovation for Intelligent Agriculture, Hefei 231131, China
  • 7. Anhui Rocvision Intelligent Technology Co. , Ltd, Hefei 230000, China
1. CHEN Peng, Ph.D., Professor, research interests are computer vision and data analysis. E-mail: ;
2. LIANG Dong, Ph.D., Professor, research interests are computer vision and smart agriculture. E-mail:

PANG Chunhui, research interests is computer vision. E-mail:

Received date: 2023-10-03

  Online published: 2024-04-25

Supported by

National Natural Science Foundation of China Projects(62072002;62273001)

Anhui Provincial Major Science and Technology Special Project(202003a06020016)

Supported by the Special Fund for Anhui Agriculture Research System (2021-2025)

Excellent Scientific Research Innovation Team of Anhui Province Universities(2022AH010005)

Copyright

copyright©2024 by the authors

摘要

[目的/意义] 传统的小麦倒伏检测方法需要人工进行田间观测和记录,这种方法存在主观、效率低、劳动强度大等问题,难以满足大规模的小麦倒伏检测的需求。基于深度学习的小麦倒伏检测技术虽已在一定程度上得到应用,但普遍局限于对小麦单一发育阶段的倒伏识别,而倒伏可能发生在小麦生长的各个时期,不同时期倒伏特征变化复杂,这给模型特征捕捉能力带来考验。本研究旨在探索一种基于深度学习技术的多生育期小麦倒伏区域检测方法。 [方法] 用无人机采集小麦灌浆期、早熟期、晚熟期这三个关键生长阶段的RGB图像,通过数据增强等技术构建出多生育期小麦倒伏数据集。提出一种小麦倒伏提取模型Lodging2Former,该模型在Mask2Former的基础上加以改进,引入分层交互式特征金字塔网络(Hierarchical Interactive Feature Pyramid Network, HI-FPN ),用于提高模型在复杂田间背景干扰下对于多个生长阶段小麦倒伏特征的捕捉能力。 [结果和讨论] 所提出的Lodging2Former模型相较于现存的多种主流算法,如Mask R-CNN (Mask Region-Based Convolutional Neural Network)、SOLOv2(Segmenting Objects by Locations, Version 2)以及Mask2Former,在平均精度均值(mean Average Precision, mAP)上展现出显著优势。在阈值分别为0.5、0.75以及0.5~0.95的条件下,模型的mAP值分别达到了79.5%、40.2%和43.4%,相比Mask2Former模型,mAP性能提升了1.3%~4.3%。 [结论] 提出的HI-FPN网络可以有效利用图像中的上下文语义和细节信息,通过提取丰富的多尺度特征,增强了模型对小麦在不同生长阶段倒伏区域的检测能力,证实了HI-FPN在多生育期小麦倒伏检测中的应用潜力和价值。

本文引用格式

庞春晖 , 陈鹏 , 夏懿 , 章军 , 王兵 , 邹岩 , 陈天娇 , 康辰瑞 , 梁栋 . 用于小麦多生长阶段倒伏边界精准检测的分层交互特征金字塔网络[J]. 智慧农业, 2024 , 6(2) : 128 -139 . DOI: 10.12133/j.smartag.SA202310002

Abstract

[Objective] Wheat lodging is one of the key isuess threatening stable and high yields. Lodging detection technology based on deep learning generally limited to identifying lodging at a single growth stage of wheat, while lodging may occur at various stages of the growth cycle. Moreover, the morphological characteristics of lodging vary significantly as the growth period progresses, posing a challenge to the feature capturing ability of deep learning models. The aim is exploring a deep learning-based method for detecting wheat lodging boundaries across multiple growth stages to achieve automatic and accurate monitoring of wheat lodging. [Methods] A model called Lodging2Former was proposed, which integrates the innovative hierarchical interactive feature pyramid network (HI-FPN ) on top of the advanced segmentation model Mask2Former. The key focus of this network design lies in enhancing the fusion and interaction between feature maps at adjacent hierarchical levels, enabling the model to effectively integrate feature information at different scales. Building upon this, even in complex field backgrounds, the Lodging2Former model significantly enhances the recognition and capturing capabilities of wheat lodging features at multiple growth stages. [Results and Discussions] The Lodging2Former model demonstrated superiority in mean average precision (mAP) compared to several mainstream algorithms such as mask region-based convolutional neural network (Mask R-CNN), segmenting objects by locations (SOLOv2), and Mask2Former. When applied to the scenario of detecting lodging in mixed growth stage wheat, the model achieved mAP values of 79.5%, 40.2%, and 43.4% at thresholds of 0.5, 0.75, and 0.5 to 0.95, respectively. Compared to Mask2Former, the performance of the improved model was enhanced by 1.3% to 4.3%. Compared to SOLOv2, a growth of 9.9% to 30.7% in mAP was achieved; and compared to the classic Mask R-CNN, a significant improvement of 24.2% to 26.4% was obtained. Furthermore, regardless of the IoU threshold standard, the Lodging2Former exhibited the best detection performance, demonstrating good robustness and adaptability in the face of potential influencing factors such as field environment changes. [Conclusions] The experimental results indicated that the proposed HI-FPN network could effectively utilize contextual semantics and detailed information in images. By extracting rich multi-scale features, it enabled the Lodging2Former model to more accurately detect lodging areas of wheat across different growth stages, confirming the potential and value of HI-FPN in detecting lodging in multi-growth-stage wheat.

0 Introduction

Wheat is a crucial cereal crop globally, serving as a significant source of starch and energy for human consumption. It boasts the largest cultivation area, highest yield, and broadest distribution among all cereal crops [ 1]. Wheat lodging, characterized by plants losing balance and tilting, bending [ 2] or breaking due to environmental hazards like wind or hailstorms [ 3], along with its structural complexity, poses a challenge. Wheat lodging negatively impacts crop yield and quality, leading to substantial harm to wheat harvests [ 4]. Therefore, accurate and timely monitoring of wheat lodging status is essential for gathering disaster information, guiding post-disaster emergency management measures, estimating potential yield loss, and processing insurance claims [ 5]. Regular monitoring of wheat lodging is crucial for advancing sustainable agriculture, fostering rural economic growth, and upholding global food security.
Currently, the primary methods for assessing wheat lodging status involve manual evaluation and remote sensing image analysis. Manual assessment requires researchers to visit the fields, conduct surveys, and manually assess the crop's lodging status. This process is labor-intensive, time-consuming, and subjective, making it impractical for large-scale evaluations [ 6]. In recent years, remote sensing image analysis, utilizing techniques like synthetic aperture radar satellite images, has been used for observing crop lodging [ 7]. However, this method has limitations in temporal and spatial resolution, hindering its effectiveness for monitoring crop lodging in real-time. Advancements in unmanned aerial vehicles (UAVs) have provided a solution to these challenges. UAVs offer adaptable and high-resolution spatial data collection capabilities, equipped with multiple sensors to capture various physiological information and crop images. Due to these advantages, UAVs are extensively utilized in addressing agricultural production issues [ 8].
In terms of feature extraction, traditional methods rely on manual extraction of features like plant height, tilt angle, and leaf rotation angle to assess wheat lodging [ 9]. This manual approach is time-consuming, error-prone, and demands domain expertise and subjective judgment. For extensive datasets, it may lack scalability, efficiency, and could encounter reproducibility and generalizability issues. The advancement in computer computational power has led to the popularity of automatic feature extraction methods based on deep learning [ 10]. These methods can directly learn task-specific features from raw data without the need for prior knowledge or manual designs. They have been rapidly developed and effectively utilized in monitoring crop lodging. For instance, employing deep learning algorithms like Faster Region-based Convolutional Neural Network (Faster R-CNN) [ 11] or YOLO [ 12] to identify lodged areas of wheat is a common practice. This technique relies on bounding box regression to detect and determine the size and position of lodged areas. However, it may struggle to accurately detect non-rectangular areas or manage variations in lighting, camera angles, and lodged area sizes, potentially resulting in errors and noise [ 13].
To tackle these challenges, researchers have explored segmentation techniques. These methods involve classifying each pixel in an image, leading to improved accuracy in localizing and classifying lodged areas in wheat [ 14]. By leveraging these advanced techniques, farmers can effectively identify and address wheat lodging, thereby optimizing crop management practices and increasing overall yield. For example, Zhao et al. [ 15] employed a deep learning U-Net model with UAV RGB and multispectral images to detect instances of rice lodging, achieving significant Dice coefficients of 0.944 2 and 0.928 4. Su et al. [ 16] introduced an improved U-Net network named LodgeNet, which combines features from dense block, DenseNet, attention mechanism, and jump connection, achieving an accuracy of 0.973 in rice lodging detection. Additionally, Zhang et al. [ 17] proposed a combination of transfer learning and DeepLab3+ to identify wheat lodging across different growth stages, surpassing the performance of the U-Net algorithm.
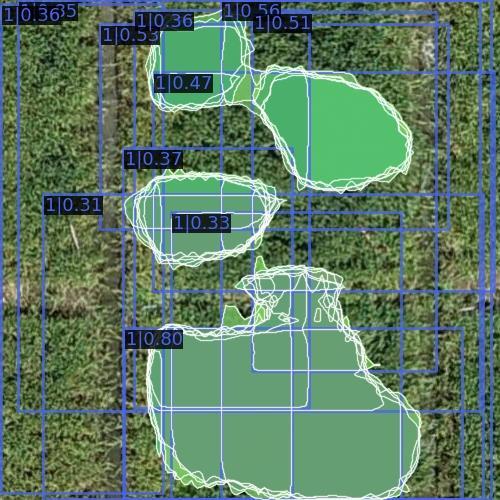
Traditional approaches for addressing multiscale challenges include the Feature Pyramid Network (FPN) [ 18], U-Net [ 19], and Multi-Head Attention [ 20]. However, to improve the effectiveness of attention mechanisms, many state-of-the-art models have incorporated multiple decoder layers. These layers enable more precise and detailed predictions by leveraging the hierarchical representations obtained from the encoder. One common challenge in such architectures is the lack of coherence in mask predictions across the decoder layers, which can negatively impact both the optimization process and the overall model performance. When there are significant disparities in mask predictions, each layer ends up with different optimization targets, impeding the model's ability to converge towards a unified objective. This inconsistency can pose significant challenges in tasks requiring accurate localization or in-depth comprehension. The issue is illustrated in Fig. 1, stacking is observed in various domains as a consequence of inconsistent mask predictions between successive decoder layers.
Fig. 1 Visualization of Mask R-CNN detection results for wheat lodging in UAV images during the grain filling stage
Previously, deep learning-based wheat lodging detection techniques had been applied to some extent, but they were generally limited to identifying lodging at a single growth stage of wheat. The failure to consider the variations in lodging features across multiple growth stages made these techniques less applicable to real-world agricultural production scenarios. To address this issue, a high-quality multi-growth-stage wheat lodging dataset was established and the Lodging2Former model was introduced, which integrated the advanced segmentation model Mask2Former with the Hierarchical Interactive Feature Pyramid Network (HI-FPN) innovatively proposed. This design of network underscored the fusion and interaction among adjacent hierarchical feature maps, thereby enabling the model to effectively integrate multi-scale feature information. Consequently, it improved the model's capability to discern lodging characteristics of wheat at different growth stages amidst complex field backgrounds. The aim was to achieve automated and accurate detection of lodging conditions across multiple stages of wheat growth, thereby effectively supporting the scientific management and disaster prevention and control of wheat production.

1 Materials and Methods

1.1 Study area

The study area, encompassing approximately 4 200 square meters of wheat-growing land, is situated within the hilly landscape of eastern China, specifically in Baihu town, Lujiang county, Anhui province, at coordinates 117.27°E and 31.13°N. This region features typical monsoon climate characteristics and falls within the subtropical monsoon climate zone. The climate is distinguished by distinct four seasons and notable temperature variations between cold and hot weather. The annual average temperature is recorded at 16.5 °C, with an annual average precipitation of 1 272.8 mm, predominantly concentrated during summer and reduced in spring and autumn. The average annual relative humidity stands at 78%, creating favorable air moisture levels for crop growth. There are approximately 1 762.2 hours of sunshine annually, providing well-lit conditions for crops. The primary cropping system in this region involves double-cropping with winter wheat and summer rice. Winter wheat is the main grain crop during the winter season, known for its high cold tolerance and extended phenological period. In contrast, summer rice dominates during the summer, adapted to the high-temperature and high-rainfall climate of the area. This cropping system optimally utilizes the climate and land resources, thereby achieving the goal of consistent and high agricultural production.

1.2 Dataset construction

1.2.1 Data collection

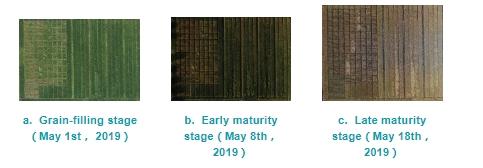
The data was collected on May 1st, May 8th, and May 18th, 2019, corresponding to three key growth stages of wheat (cv. Ningmai 13): the grain filling stage, early maturity stage, and late maturity stage. The selection of these three periods can cover crucial time points during the wheat growth cycle where lodging risk is higher, thus providing lodging data that is more relevant to practical applications. A DJI Phantom 4 Pro drone was utilized to photograph the entire field area, flying at a speed of 2 m/s and a height of 25 m. The onboard visible light camera (DJI_FC6310R) captured images with a resolution of 5472 × 3648 pixels, providing a spatial resolution of 0.5 cm per pixel. The complete images, as shown in Fig. 2, were generated by processing and stitching the captured images together utilizing the Photoscan software. Following the guidance of agricultural experts, LabelMe software was employed to manually label the lodging areas to extract information on the affected regions. Lodging areas refer to the inclined regions in the wheat caused by factors such as wind, rain, or disease. These areas exhibit noticeable variations in texture and color compared to the upright-growing wheat. Aerial images captured by drones reveal that the lodging areas possess a more disordered texture and stand out visually. The contrast between light and dark was more pronounced in the lodging areas than in the non-lodging wheat.
Fig. 2 The captured visible light images of the three growth stages by drone

1.2.2 Data pre-processing

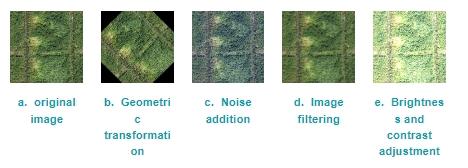
To enhance the diversity and usability of the dataset, a random window extraction method was employed to divide the original images into smaller 512×512 window images. Following the exclusion of non-lodging areas, 46 images were acquired during the grain filling period, 59 images during the early maturity period, and 65 images during the late maturity period. A total of 24 images were randomly chosen for testing, ensuring an equal representation from each growth stage. To tackle the challenge of imbalanced samples, data augmentation techniques were utilized, encompassing geometric transformations, noise addition, image filtering, and adjustments to brightness and contrast, as illustrated in Fig. 3. In instances where was an overabundance of lodging samples during specific periods, random deletion was performed. The resultant dataset comprised a total of 1 460 images, exhibiting a relatively even distribution across the various growth stages. This methodology was implemented to mitigate data bias, as unbalanced data can skew outcomes. Subsequently, the dataset was divided into a training set and a validation set in a 4:1 ratio. The training set was utilized for model training, while the validation set served for model evaluation. To prevent data leakage, it was imperative to ensure that each original image and its corresponding enhanced image were grouped together in either the training set or the validation set. This precautionary measure aimed to avert the inadvertent utilization of enhancement data information from the validation set during the training phase, which could lead to inaccurate evaluations.
Fig. 3 Data augmentation using the grain-filling period image as an example
This dataset encompasses three growth stages of wheat, collected and processed through drone aerial photography and image processing software. This methodology ensured the precision and comprehensiveness of the dataset, providing reliable real-world data to underpin research on lodging segmentation algorithms across a spectrum of wheat growth conditions. The significance of this dataset lied in its ability to illustrate the challenges stemming from morphological changes in wheat appearance, shape, and color, thus establishing it as a valuable point of reference with tangible practical implications.

1.3 Methodology for establishing the Lodging2Former

1.3.1 Introduction to the Mask2Former

Mask2Former is an advanced image segmentation model based on the Transformer architecture, which draws inspiration from the successful experience of Transformer models in the field of natural language processing and applies it to visual tasks, particularly in the area of image segmentation. In Mask2Former, the model utilizes Transformer's self-attention mechanism and Masked Attention mechanism to process image features, enabling it to understand and explore pixel relationships in the image from a global perspective, thereby improving segmentation accuracy. Additionally, the model introduces multi-scale feature fusion and multi-head self-attention mechanism to better capture changes in image features at different scales, especially demonstrating significant advantages for segmentation of small objects or complex scenes.

1.3.2 Network design of the Lodging2Former

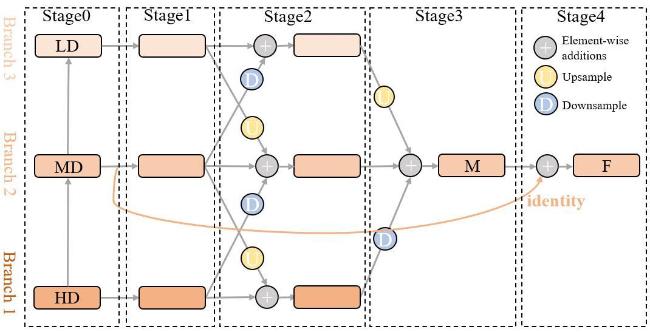
Fig. 4 illustrates the pipeline of the proposed enhanced Mask2Former method, referred to as Lodging2Former. It integrates a novel module called the HI-FPN to augment the conventional FPN network. Fig. 5 presents a detailed diagram of the Fusion Refine Model (FRM), depicting the core elements of the HI-FPN architecture.
Fig. 4 The overall flowchart of the proposed Lodging2Former method
Fig. 5 Illustration of the fusion refine model (FRM)

1.3.3 Hierarchical Interactive Feature Pyramid Network

The innovative concept of the Hierarchical Interactive Feature Pyramid Network was introduced, which leverages a feature fusion mechanism between neighboring levels to bolster interaction among diverse feature scales. This approach addressed the challenge of diluted high-level semantic information and the inability of low-level spatial information to impact high-level data in traditional FPN networks. Moreover, the utilization of a residual learning strategy empowered the model to efficiently incorporate features from various scales as complements, facilitating a more accurate capture of crucial feature details and fortifying the model's robustness.
HI-FPN consists of four FRM modules, as illustrated in Fig. 4. Details regarding FRM2 and FRM3 are depicted in Fig. 5, covering Stages 1, 2, and 3. Stage 0 corresponds to the characteristics obtained from the backbone, representing high, medium, and low definitions from bottom to top. Stage 1 involves processing the three-level feature maps using convolutional, batch normalization, and ReLU layers to ensure equal channel numbers, laying the groundwork for subsequent interactions. Stage 2 is the interaction layer, facilitating separate interaction of the three-level feature maps. The low-resolution features are upsampled using nearest neighbor interpolation, while the high-resolution features are downsampled through average pooling. The sum of these features is then combined with the middle-definition features through element-wise addition. Simultaneously, the middle-definition features are upsampled and downsampled individually and merged with the high-definition and low-definition features, respectively, through element-wise addition. This process yields fused and refined features at three distinct definitions. In Stage 3, the three feature maps at different scales are integrated and interacted with each other to generate further fused and refined features of medium scale. Finally, in Stage 4, they are added element-wise to the identification mapping of the mid-scale feature map, employing a residual learning approach to ensure that features from other scales serve as supplements only, allowing more crucial feature information to be captured and generated. Similarly, FRM1 comprises Branch 1 and Branch 2, while FRM4 is composed of Branch 2 and Branch 3.
Given the input feature maps f 1, f 2, f 3, and f 4 obtained from the backbone, the output F i of the i t h FRM may be expressed using the Equation (1).
F i = I f i + M i
Where I represents the identity mapping of residual learning; M i represents the feature after branch merging for the i t h. M i can be represented by the Equation (2).
M i = B j f j + B j + 1 f j + 1 ,       i = 1 j = 1 3 B j f j + i - 2 ,          i = 2 ,   3 B j f j + 1 + B j - 1 f j - 1   ,      i = 4
Where B represents the overall operation of the j t h branch, and the specific operations for each branch can be found in Fig. 5.

1.3.4 Mask Ground Truth Generation

Accurately labeling masks was crucial for the task of segmenting lodging in wheat using data collected at different growth stages in the field. Wheat has varying characteristics at different growth stages, which complicates the precise delimitation of lodging boundaries and extraction of features at different time periods. With guidance from agricultural experts, the "LabelMe" software was used to annotate regions of wheat lodging. Through interactive engagement with the software interface, pixel-precise contours of the lodging areas were marked, generating corresponding annotation files. To enhance both efficiency and accuracy in the annotation process, polygonal regions were employed to outline the boundaries of the lodging, thereby reducing the influence of external noise. Additionally, the zoom in and out functionality facilitated more intricate drawings and enables better visualization of the areas. After the annotation was completed, a JSON format file containing detailed annotation data was generated, which meticulously documented the outlines and labels of each lodging area. As shown in Fig. 6, the visualization of the labeling information formed lodging mask images, clearly presenting the areas affected by wheat lodging during the three growth stages. This provided an important data foundation for subsequent lodging segmentation training tasks.
Fig. 6 Mask images of wheat lodging at three growth stages

Note: The red zone corresponds to the lodging region, whereas the black zone corresponds to the background

1.4 Experiment environment and parameter configuration

The research was conducted on a workstation featuring an AMD Ryzen TM 7 5800H central processing unit (CPU, 3.2 GHz) and an NVIDIA GeForce RTX 3060 graphics processing unit (GPU, 6 GB). The implementation phase relied on the MMDetection deep learning framework using Python 3.8. The AdamW optimizer was employed to optimize the model parameters and dynamically adjust the learning rate during training. The initial learning rate was set at 0.000 1 with a weight decay rate of 0.05. A smaller epsilon value was utilized to ensure numerical stability. The learning rate followed a strategy of piece-wise constant decay over 100 training epochs, with a 0.1 factor reduction occurring at the 50 th and 75 th epochs.

1.5 Evaluation metrics

To evaluate the segmentation results of different models at different intersection over union (IoU) thresholds, the mean intersection over union (mIoU) and mean average precision (mAP) metrics were utilized to evaluate model quality.
The mIoU is the average ratio of the intersection area between the predicted results and the ground truth labels to the union area between them for all classes, as shown in Equation 3. Its values range from 0 to 1, with higher values indicating a better match between the model's predicted segmentation area and the actual annotated area, meaning a better segmentation effect of the model.
m I o U = 1 N i = 1 N T P i F N i + F P i + T P i
Where true positive (TP) refers to samples that are predicted to be positive and are actually positive; false positive (FP) is used when samples are predicted to be positive but are actually negative; false negative (FN) is when samples are predicted to be negative but are actually positive.
The mAP evaluates the overall accuracy of a model across all categories. It comprehensively considers the accuracy and recall of detection results for different categories. The higher the mAP, the better the model's performance in terms of detection accuracy and recall for each category. This means that the model can not only correctly identify various types of objects but also cover as many targets as possible while maintaining relatively low false positive and false negative rates. Further details are outlined in the Equation 4.
m A P = 1 N i = 1 N T P i F P i + T P i

2 Results and analysis

2.1 Comparison of detection performance before and after model improvement

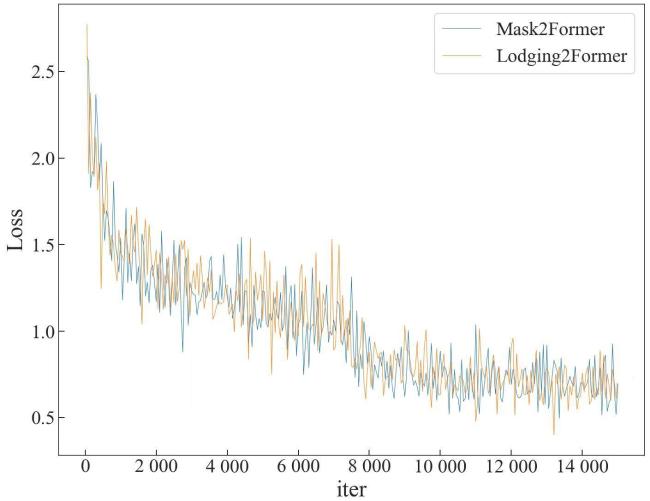
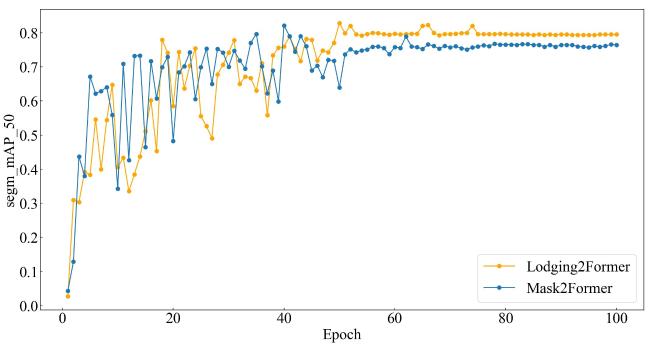
The effectiveness of the proposed approach was evaluated by comparing the models' loss and mAP metrics before and after the improvement. Fig. 7 and Fig. 8 depict the results curves. The loss metric measures the disparity between predicted outcomes and actual results, providing insights into the models' convergence, convergence rate, and training performance. Initially, both models eventually converged based on the loss curves, with similar convergence rates, indicating that the improvement did not negatively impact their convergence. Upon examining the mAP curves of the models pre- and post-improvement, it was noted that as the models approached convergence, the curve smoothed out. The improved model demonstrated a superior mAP, indicating a positive impact of the improvement on wheat lodging segmentation accuracy at a threshold of 0.5. However, both the original and improved models encountered challenges posed by the dataset, which includes complex interferences from field backgrounds and variations in wheat morphology, color, and texture across three growth stages. These factors may influence the model's performance, resulting in accuracy that may not be exceptionally high but is more aligned with real-world applications.
Fig. 7 Comparison of Loss Curves between the Mask2Former model and the Lodging2Former model
Fig. 8 Comparison of mAP Curves between the Mask2Former model and the Lodging2Former model

2.2 Comparison of detection performance with the State-of-the-Art Methods

As per studies [ 21, 22], Lodging2Former was compared with other cutting-edge segmentation-based techniques for detecting lodging in wheat at different growth stages. Table 1 presents the quantitative results. Traditional approaches such as mask region-based convolutional neural network (Mask-RCNN) [ 23], Segmenting Objects by Locations, Version 2 (SOLOV2) [ 24], and Mask2Former [ 25] were compared with the proposed Lodging2Former method.
Table 1 Comparison of mAP and mIoU results of different state-of-the-art models at different growth stages
Growth Stages Method mIoU mAP
0.5 0.2 0.01 0.5 0.75 0.5:0.95

Multiple

stages

Mask-RCNN 54.2 57.1 57.0 54.4 13.8 19.2
SOLOV2 34.9 54.4 58.4 69.6 9.5 25.0
Mask2Former 63.7 63.7 63.7 78.2 36.2 39.1
Lodging2Former 66.0 66.0 68.7 79.5 40.2 43.4
Grain-filling stage Mask-RCNN 64.9 65.1 66.8 60.4 6.9 16.0
SOLOV2 61.2 61.2 62.6 80.5 5.2 25.4
Mask2Former 72.4 72.4 72.4 95.6 60.4 48.4
Lodging2Former 73.0 73.0 73.0 97.4 60.8 50.2
Early maturity stage Mask-RCNN 78.4 79.8 79.8 80.5 31.0 35.7
SOLOV2 48.7 67.1 71.1 89.0 26.6 43.7
Mask2Former 76.5 76.5 76.5 94.7 60.1 59.0
Lodging2Former 81.4 81.4 81.4 96.6 60.2 59.1
Late maturity stage Mask-RCNN 43.8 45.1 45.6 37.9 2.6 9.8
SOLOV2 36.4 36.4 37.8 41.7 3.8 15.6
Mask2Former 45.8 45.8 45.8 53.5 11.8 20.0
Lodging2Former 47.8 47.8 47.8 53.8 11.8 20.6
The results indicate that this approach achieves superior performance in both mIoU and mAP metrics. Specifically, this method demonstrates enhancements in mAP by 1.3%, 4%, and 4.3% over Mask2Former, reaching mAP scores of 79.5%, 40.2%, and 43.4% at thresholds of 0.5, 0.75, and 0.5:0.95, respectively. At the same thresholds, this method outperforms SOLOV2 with mAP improvements of 9.9%, 30.7%, and 18.4%. Moreover, Lodging2Former achieves mAP improvements of 25.1%, 26.4%, and 24.2% compared to Mask-RCNN at the same thresholds.
This indicates that although other methods are designed for object segmentation in general, Lodging2Former focuses on the challenging task of multi-stage wheat lodging segmentation. By introducing the HI-FPN network to better address the issue of capturing lodging features in multiple growth stages of wheat, superior performance beyond general segmentation models has been achieved in metrics such as mAP and mIoU. Additionally, the system exhibits robust performance across different thresholds, highlighting its resilience to environmental factors that may influence detection accuracy. This robustness is critical for practical application.
Furthermore, the performance of traditional models on the built dataset is suboptimal, especially at higher thresholds, underscoring the dataset's complexity and the necessity for model improvements to better suit real-world scenarios.

2.3 Comparison of model detection performance at different growth stages

Based on the quantitative comparison results presented in Table 1, the lodging detection mAP reaches its peak during the Grain-filling stage, with a rate of 97.4%. This is followed by the early maturity stage, while the lowest detection rate was observed during the late maturity stage. The variance in detection effectiveness can be attributed to the distinct characteristics of wheat at different growth stages. During the grain-filling stage, wheat growth remains stable, exhibiting a consistent emerald green hue with a uniform and delicate surface texture. This uniformity facilitates detecting changes after lodging, enabling the model to identify lodging situations more accurately. During the initial phase of maturity, wheat plants take on a golden yellow or light yellow hue, and the texture gradually becomes rougher, making them more vulnerable to external forces and increasing the likelihood of lodging. These changes necessitate the model to adjust more sensitively to changes in color and texture, which results in a slight decline in detection accuracy. During the concluding stage of maturity, the wheat plants' growth weakens, and lodging incidents become more frequent. The color of the plants can appear unevenly yellow or brown with complex and diverse texture changes. These complicated alterations in color and texture pose a challenge in detecting lodging as they can be mistaken for changes caused by lodging. As a result, identifying lodging in wheat over multiple periods is a significant challenge in this study. The suggested improvements have significantly increased the detection accuracy at each development stage, outperforming conventional models. This indicates the potential usefulness of the suggested method in extracting characteristics from multi-period wheat data.
During the grain-filling stage, wheat growth remains stable, displaying a consistent emerald green color with a uniform and delicate surface texture. This consistency helps in detecting post-lodging changes, enabling the model to identify lodging instances more accurately. As wheat grows to the early maturity phase, it acquires a golden yellow or light yellow tint, and the texture gradually becomes rougher, making the plants more susceptible to external pressures and raising the risk of lodging. These changes require the model to adjust more sensitively to shifts in color and texture, leading to a slight decrease in detection accuracy.
In the late maturity stage, wheat growth weakens, leading to more frequent lodging incidents. The plants may display an uneven yellow or brown color with complex and diverse texture variations. These intricate changes in color and texture present a challenge in lodging detection as they can be mistaken for alterations caused by lodging. Therefore, identifying lodging in wheat across multiple stages poses a significant challenge in this research. The proposed improvements have notably boosted detection accuracy at each growth stage, surpassing traditional models. This underscores the potential utility of the proposed method in extracting features from multi-stage wheat data.

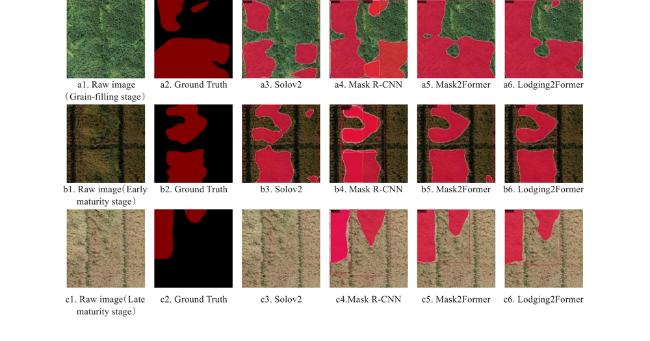
2.4 Visualization Results

The visual detection results of lodging in wheat at different growth stages using Lodging2Former and other segmentation models mentioned above are shown in Fig. 9. The results demonstrate that Lodging2Former can more accurately identify the lodging area of wheat, while establishing clear boundaries. This method closely corresponds to the manually labeled ground truth guided by agricultural experts. It performs effectively across the three growth stages. The strength of this method lies in integrating explicit modeling of discrepancies and utilizing neighborhood feature resampling through HI-FPN.
Fig. 9 Visualization results of wheat lodging detection sampling tests at different growth stages using different methods

2.5 Model generalization experiment

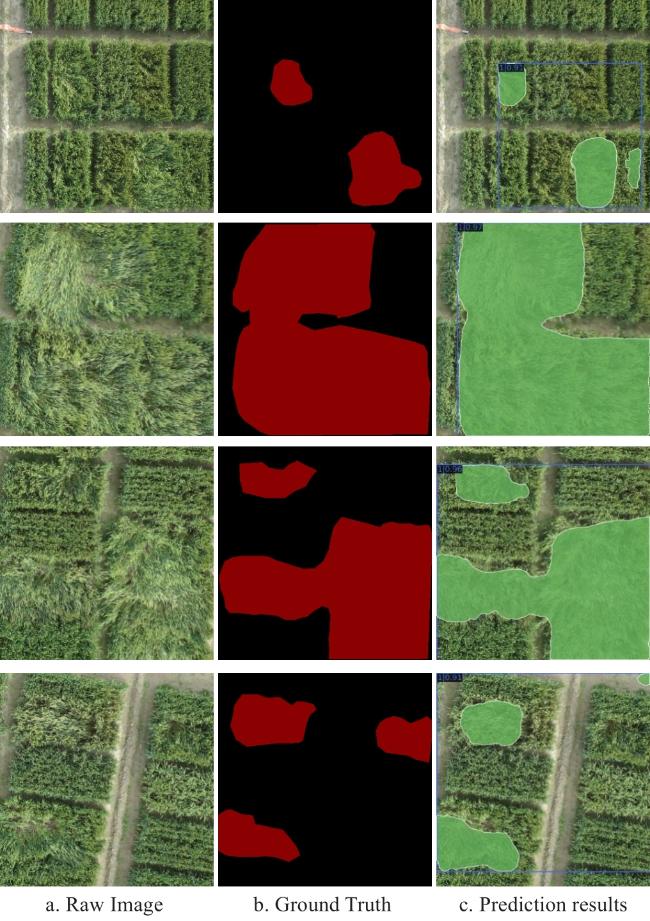
To further investigate the generalization ability of the Lodging2Former model, it was applied to the wheat lodging dataset compiled by Singh et al. [ 26] to validate its effectiveness in accurately segmenting wheat lodging areas in different scenarios. The visualization of the detection results is shown in Fig.10. By observing the original images and the model's predicted results, it could be visually seen that the Lodging2Former model successfully identified and segmented the wheat lodging areas in the dataset. Its results closely approximating the manually annotated ground truth, despite some minor occurrences of missed detections. Even when faced with data from different sources, the model still demonstrated robust segmentation performance, proving the practical applicability of the proposed method in real-world agricultural scenarios.
Fig. 10 Visualization of prediction results for wheat lodging detection using the Lodging2Former on publicly available datasets

3 Discussion and Conclusions

3.1 Discussion

Currently, research on a universal model that can effectively and accurately segment lodging areas of wheat across multiple growth stages is relatively scarce. This study aims to enhance the model's ability to discern and precisely segment the subtle differences in lodging characteristics among wheat plants at different growth phases by designing and validating the application of HI-FPN network within the Mask2Former model. Zhang et al. [ 17] proposed a method for identifying lodging in wheat across multiple growth stages, utilizing the DeepLabv3+ network combined with transfer learning. At the early flowering stage, late flowering stage, and early maturity stage, the precision reached 0.81, 0.85, and 0.88, respectively. Although the U-Net method demonstrated slightly higher performance in certain metrics during testing, the approach presented overall yielded superior segmentation results. The concept of transfer learning is a valuable technique worthy of consideration in this study. Adopting a transfer learning strategy can help alleviate the limitation of insufficient data and enhance the overall generalization ability of the model. Yu et al. [ 27] integrated the convolutional long short-term memory (ConvLSTM ) model and the convolutional attention module (CBAM ) to propose a wheat lodging segmentation model that effectively operates across multiple growth stages, achieving a precision within the range of 0.932 to 0.952. When dealing with spatiotemporal data, ConvLSTM can effectively utilize the dynamic features inherent in time series and capture spatial local features through convolution. This characteristic offers new insights for this research, suggesting the potential to incorporate a temporal processing module containing ConvLSTM layers into the backbone, thereby enabling the model to interpret and harness time series information effectively.

3.2 Conclusions

This research focuses on the challenges in wheat lodging detection, particularly concerning complex background interference and the identification of varying lodging characteristics across multiple growth stages. An innovative network structure, named HI-FPN, was conceived to tackle these issues.
1) The wheat lodging dataset that was constructed covered three essential growth periods during the wheat's life cycle where the risk of lodging is commonly observed: the grain-filling stage, early maturity stage, and late maturity stage. Its meticulous manual mask annotations served as a robust data underpinning for conducting experiments on multi-growth-stage segmentation of wheat lodging regions.
2) A HI-FPN structure,designed to enhance the model's capability of capturing wheat lodging features across various growth stages within complex backgrounds by leveraging a mechanism that integrates multi-scale feature interactions. Integrating this HI-FPN into the advanced segmentation model Mask2Former led to the formulation of the Lodging2Former model, specifically targeting multi-growth-stage wheat lodging detection.
3) The improved Lodging2Former model achieved remarkable performance in detecting wheat lodging across multiple growth stages, demonstrating a significant uplift over the original Mask2Former. Specifically, at threshold values of 0.5, 0.75, and 0.5:0.95, the mAP was reported as 79.5%, 40.2%, and 43.4% respectively, representing an increase of 1.3%, 4%, and 4.3% compared to the unmodified Mask2Former. Moreover, in each growth stage, the Lodging2Former's mAP surpassed that of existing segmentation models, such as Mask R-CNN, SOLOv2, and Mask2Former.
Conclusively, HI-FPN significantly enhanced the detection capability of the Lodging2Former model for wheat lodging across multiple growth stages. The model proposed consistently demonstrated higher detection precision across all developmental periods compared to common segmentation models. In future research, more data on wheat lodging from additional growth stages and on a larger scale will be collected to further improve the model's performance through the integration of various methods and extensive training. Additionally, attempts will be made to apply the HI-FPN-based approach to lodging studies in other crops to validate its effectiveness and applicability in different environments and crop types.

COMPETING INTERESTS

All authors declare no competing interests.

1
WEGREN S K. Challenges to global food security: A policy approach to the 2021–2022 food crisis[J]. World food policy, 2023, 9( 1): 127- 148.

2
KISZONAS A M, MORRIS C F. Wheat breeding for quality: A historical review[J]. Cereal chemistry, 2018, 95( 1): 17- 34.

3
WU W, MA B L. A new method for assessing plant lodging and the impact of management options on lodging in canola crop production[J]. Scientific reports, 2016, 6: ID 31890.

4
BERRY P M, SPINK J. Predicting yield losses caused by lodging in wheat[J]. Field crops research, 2012, 137: 19- 26.

5
GULATI A, TERWAY P, HUSSAIN S. Crop insurance in India: Key issues and way forward[R/OL]. Working paper, 2018. [ 2023-09-20].

6
SHAH L, YAHYA M, SHAH S M A, et al. Improving lodging resistance: using wheat and rice as classical examples[J]. International journal of molecular sciences, 2019, 20( 17): ID 4211.

7
ZHANG H S, LIN H, LI Y, et al. Mapping urban impervious surface with dual-polarimetric SAR data: An improved method[J]. Landscape and urban planning, 2016, 151: 55- 63.

8
ZHANG Z, FLORES P, IGATHINATHANE C, et al. Wheat lodging detection from UAS imagery using machine learning algorithms[J]. Remote sensing, 2020, 12( 11): ID 1838.

9
LOWE D G. Distinctive image features from scale-invariant keypoints[J]. International journal of computer vision, 2004, 60( 2): 91- 110.

10
KITANO B T, MENDES C C T, GEUS A R, et al. Corn plant counting using deep learning and UAV images[J]. IEEE geoscience and remote sensing letters, 2024: 1- 5.

11
REN S, HE K, GIRSHICK R, et al. Faster R-CNN: Towards real-time object detection with region proposal networks[J]. IEEE trans pattern anal Mach intell, 2017, 39( 6): 1137- 1149.

12
JIANG P Y, ERGU D J, LIU F Y, et al. A review of yolo algorithm developments[J]. Procedia computer science, 2022, 199: 1066- 1073.

13
SAMET N, HICSONMEZ S, AKBAS E. Reducing label noise in anchor-free object detection[EB/OL]. arXiv: 2008.01167, 2020.

14
YANG B H, ZHU Y, ZHOU S J. Accurate wheat lodging extraction from multi-channel UAV images using a lightweight network model[J]. Sensors, 2021, 21( 20): ID 6826.

15
ZHAO X, YUAN Y, SONG M, et al. Use of unmanned aerial vehicle imagery and deep learning unet to extract rice lodging[J]. Sensors, 2019, 19( 18): ID 3859.

16
SU Z B, WANG Y, XU Q, et al. LodgeNet: Improved rice lodging recognition using semantic segmentation of UAV high-resolution remote sensing images[J]. Computers and electronics in agriculture, 2022, 196: ID 106873.

17
ZHANG D Y, DING Y, CHEN P F, et al. Automatic extraction of wheat lodging area based on transfer learning method and deeplabv3+ network[J]. Computers and electronics in agriculture, 2020, 179: ID 105845.

18
LIN T Y, DOLLAR P, GIRSHICK R, et al. Feature pyramid networks for object detection[C]// 2017 IEEE Conference on Computer Vision and Pattern Recognition (CVPR). Piscataway, New Jersey, USA: IEEE, 2017: 2117- 2125.

19
RONNEBERGER O, FISCHER P, BROX T. U-net: Convolutional networks for biomedical image segmentation[C]// In: Medical Image Computing and Computer-Assisted Intervention-MICCAI 2015: 18th International Conference. Munich, Germany: Springer 2015: 234- 241.

20
VASWANI A, SHAZEER N, PARMAR N, et al. Attention is all you need[C]// 31st Conference on Neural Information Processing Systems (NIPS 2017). Long Beach, USA: NIPS, 2017.

21
DAI Q F, GUO Y H, LI Z, et al. Citrus disease image generation and classification based on improved FastGAN and EfficientNet-B5[J]. Agronomy, 2023, 13( 4): ID 988.

22
ZHANG L, DU J M, DONG S F, et al. AM-ResNet: Low-energy-consumption addition-multiplication hybrid ResNet for pest recognition[J]. Computers and electronics in agriculture, 2022, 202: ID 107357.

23
HE K M, GKIOXARI G, DOLLAR P, et al. Mask R-CNN[C]// 2017 IEEE International Conference on Computer Vision (ICCV). Piscataway, New Jersey, USA: IEEE, 2017: 2961- 2969.

24
WANG X, ZHANG R, KONG T, et al. Solov2: Dynamic and fast instance segmentation[C]// 34th Conference on Neural Information Processing Systems (NeurIPS 2020). Vancouver, Canada: NeurIPS, 2020.

25
CHENG B W, MISRA I, SCHWING A G, et al. Masked-attention mask transformer for universal image segmentation[C]// 2022 IEEE/CVF Conference on Computer Vision and Pattern Recognition (CVPR). Piscataway, New Jersey, USA: IEEE, 2022: 1290- 1299.

26
SINGH D, WANG X, KUMAR U, et al. High-throughput phenotyping enabled genetic dissection of crop lodging in wheat[J]. Frontiers in plant science, 2019, 10: ID 412524.

27
YU J, CHENG T, CAI N, et al. Wheat lodging segmentation based on Lstm_PSPNet deep learning network[J]. Drones, 2023, 7( 2): ID 143.

文章导航

/