


0 引 言
1 数据与材料

2 水稻病害图像生成网络设计
2.1 循环生成对抗网络

2.2 改进的CycleGAN网络
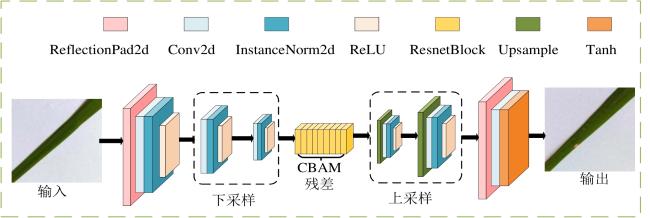
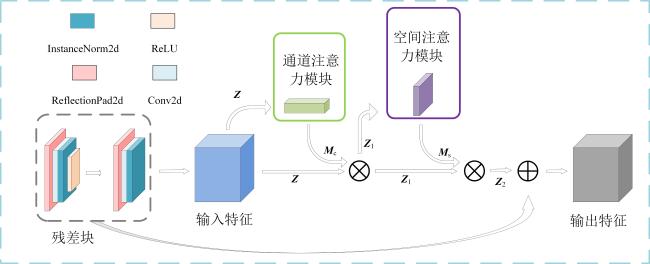
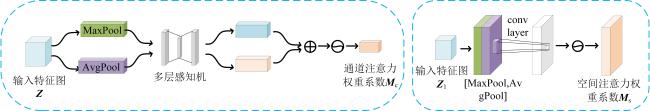
2.2.1 生成器设计
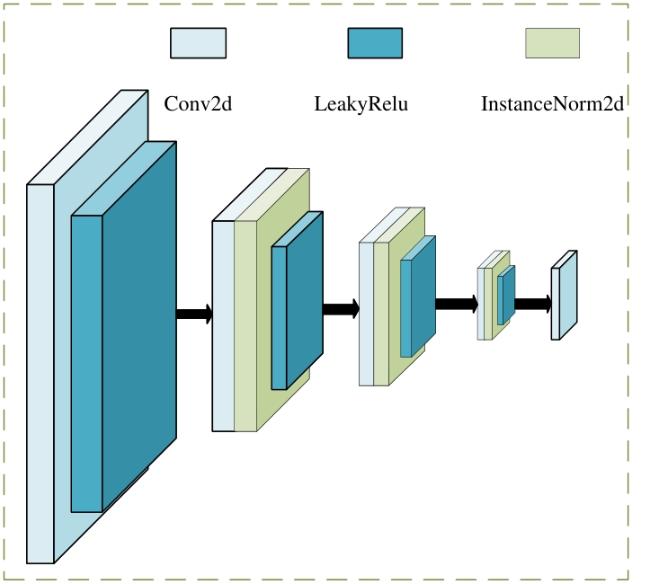
2.2.2 判别器设计
2.2.3 损失函数的优化

2.3 评价指标
3 实验与结果
3.1 实验平台和参数设置
3.2 实验结果与分析
3.2.1 不同网络性能对比实验
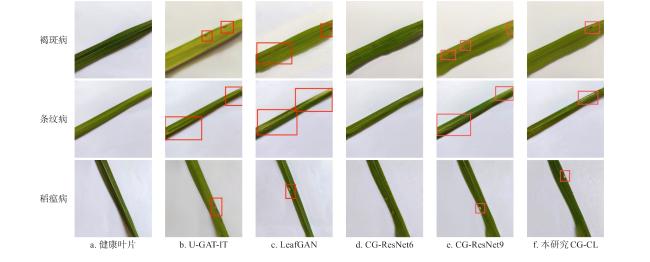

表2 不同网络生成水稻叶部病害图像的SSIM和PNSR指标对比Table 2 Comparison of SSIM and PNSR indexes of rice leaf disease images generated by different networks |
| 病害种类 | SSIM↑ | PSNR/dB ↑ | ||||||||
|---|---|---|---|---|---|---|---|---|---|---|
| U-GAT-IT | LeafGAN | CG-ResNet6 | CG-ResNet9 | 本研究CG-CL | U-GAT-IT | LeafGAN | CG-ResNet6 | CG-ResNet9 | 本研究CG-CL | |
| 褐斑病 | 0.849 | 0.867 | 0.845 | 0.857 | 0.884 | 22.124 | 22.457 | 22.042 | 22.511 | 23.293 |
| 条纹病 | 0.805 | 0.809 | 0.797 | 0.827 | 0.852 | 20.709 | 20.923 | 20.618 | 20.751 | 22.971 |
| 稻瘟病 | 0.775 | 0.777 | 0.771 | 0.786 | 0.812 | 19.009 | 20.827 | 18.740 | 19.494 | 21.090 |
3.2.2 不同注意力机制对网络性能的影响
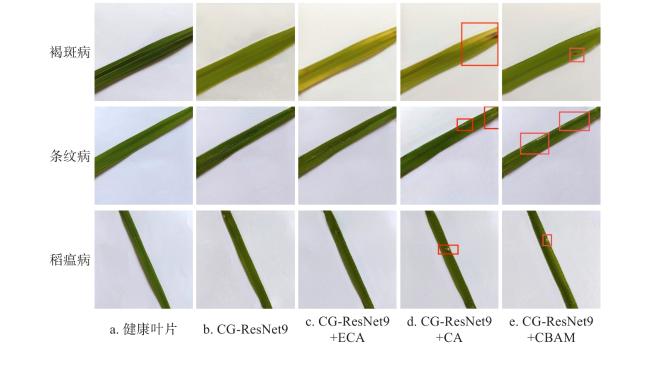
图10 不同注意力机制网络生成的水稻叶部病害效果Fig.10 Effects of rice leaf diseases generated by different attention mechanism networks |
表3 不同注意力机制网络生成水稻叶部病害图像的SSIM和PNSR指标对比Table 3 Comparison of SSIM and PNSR indexes in rice leaf disease images generated by different attention mechanism networks |
| 病害种类 | SSIM↑ | PSNR/dB ↑ | ||||||
|---|---|---|---|---|---|---|---|---|
| CG-ResNet9 | CG-ResNet9+ECA | CG-ResNet9+CA | CG-ResNet9+CBAM | CG-ResNet9 | CG-ResNet9+ECA | CG-ResNet9+CA | CG-ResNet9+CBAM | |
| 褐斑病 | 0.857 | 0.855 | 0.861 | 0.862 | 22.511 | 22.554 | 22.853 | 23.109 |
| 条纹病 | 0.827 | 0.828 | 0.829 | 0.835 | 20.751 | 20.992 | 20.898 | 21.386 |
| 稻瘟病 | 0.786 | 0.802 | 0.802 | 0.804 | 19.494 | 19.544 | 19.550 | 19.574 |
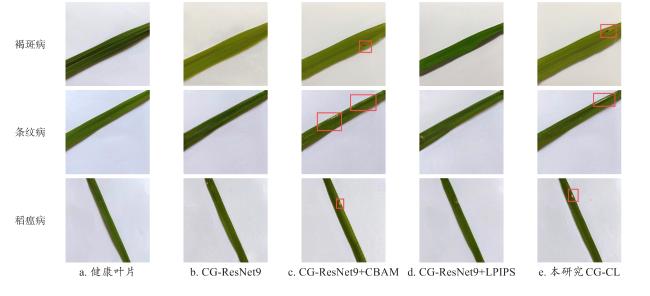
3.2.3 消融实验与分析
表4 不同结构网络生成水稻叶部病害图像的SSIM和PNSR指标对比Table 4 Comparison of SSIM and PNSR indexes of rice leaf disease images generated by different structural networks |
| 病害种类 | SSIM↑ | PSNR/dB ↑ | ||||||
|---|---|---|---|---|---|---|---|---|
| CG-ResNet9 | CG-ResNet9+CBAM | CG-ResNet9+LPIPS | 本研究 CG-CL | CG-ResNet9 | CG-ResNet9+CBAM | CG-ResNet9+LPIPS | 本研究 CG-CL | |
| 褐斑病 | 0.857 | 0.862 | 0.878 | 0.884 | 22.511 | 23.109 | 22.622 | 23.293 |
| 条纹病 | 0.827 | 0.835 | 0.839 | 0.852 | 20.751 | 21.386 | 21.741 | 22.971 |
| 稻瘟病 | 0.786 | 0.804 | 0.796 | 0.812 | 19.494 | 19.574 | 20.347 | 21.090 |
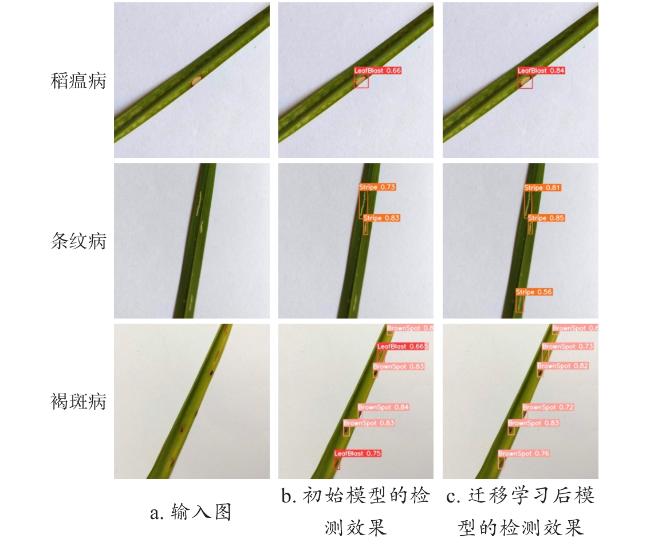
3.2.4 数据增强对病害识别性能的影响
表5 训练目标检测网络的数据集分布情况Table 5 Data set distribution of the training target detection network |
| 数据集类型 | 训练集/张 | 验证集/张 | 测试集/张 | 总数/张 |
|---|---|---|---|---|
| 真实数据集 | 280 | 80 | 40 | 400 |
| 增强数据集 | 280 | 80 | 40 | 400 |
表6 YOLOv5s迁移学习前后水稻叶部病害识别性能Table 6 Rice leaf disease recognition performance before and after YOLOv5s transfer learning |
| 病害类型 | 初始模型 | 迁移训练后模型 | ||||
|---|---|---|---|---|---|---|
| P/% | R/% | mAP/% | P/% | R/% | mAP/% | |
| 褐斑病 | 78.0 | 53.9 | 64.7 | 94.6 | 80.0 | 91.9 |
| 条纹病 | 65.4 | 45.4 | 51.5 | 89.7 | 64.9 | 81.0 |
| 稻瘟病 | 95.5 | 82.0 | 91.2 | 97.2 | 97.7 | 97.5 |
| 综合 | 79.7 | 60.4 | 69.1 | 93.8 | 80.9 | 90.1 |
表7 YOLOv7-tiny迁移学习前后水稻叶部病害识别性能Table 7 Rice leaf disease recognition performance before and after YOLOv7-tiny transfer learning |
| 病害类型 | 初始模型 | 迁移训练后模型 | ||||
|---|---|---|---|---|---|---|
| P/% | R/% | mAP/% | P/% | R/% | mAP/% | |
| 褐斑病 | 92.0 | 91.0 | 95.0 | 93.8 | 98.5 | 96.9 |
| 条纹病 | 87.0 | 92.2 | 95.5 | 91.9 | 92.6 | 97.7 |
| 稻瘟病 | 96.7 | 97.9 | 99.3 | 97.1 | 100.0 | 99.6 |
| 综合 | 91.9 | 93.7 | 96.6 | 94.2 | 97.0 | 98.1 |
表8 YOLOv8s迁移学习前后水稻叶部病害识别性能Table 8 Rice leaf disease recognition performance before and after YOLOv8s transfer learning |
| 病害类型 | 初始模型 | 迁移训练后模型 | ||||
|---|---|---|---|---|---|---|
| P/% | R/% | mAP/% | P/% | R/% | mAP/% | |
| 褐斑病 | 89.8 | 89.4 | 94.4 | 95.2 | 92.7 | 96.3 |
| 条纹病 | 83.3 | 84.1 | 89.5 | 91.4 | 85.0 | 92.7 |
| 稻瘟病 | 96.5 | 97.8 | 97.9 | 98.4 | 98.9 | 98.4 |
| 综合 | 89.9 | 90.4 | 93.9 | 95.0 | 92.2 | 95.8 |


