


0 引 言
1 数据与方法
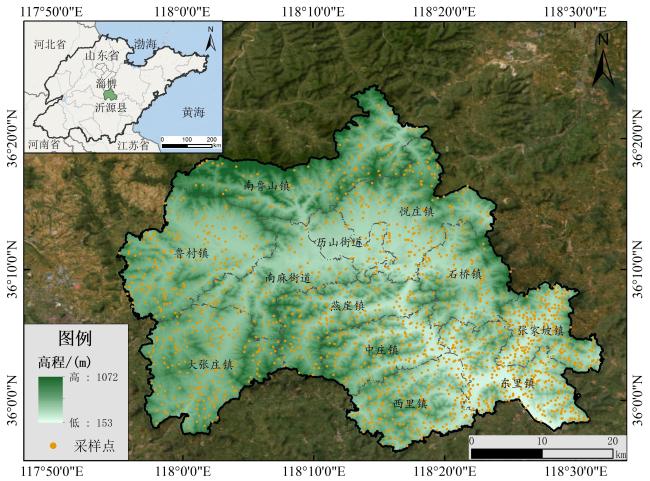
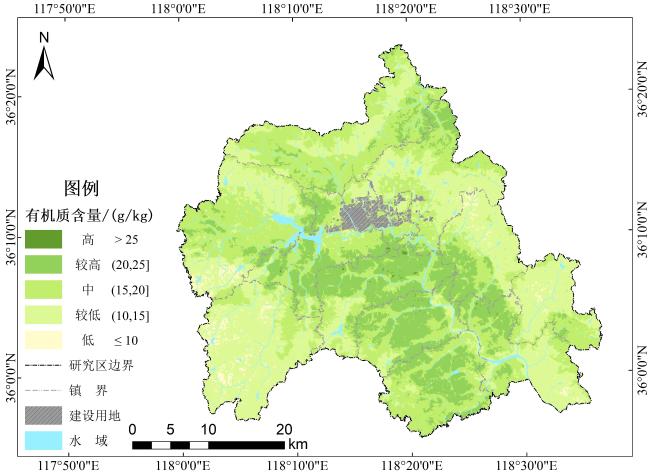
1.1 研究区概况
1.2 数据来源与预处理
1.2.1 土壤样品采集与预处理
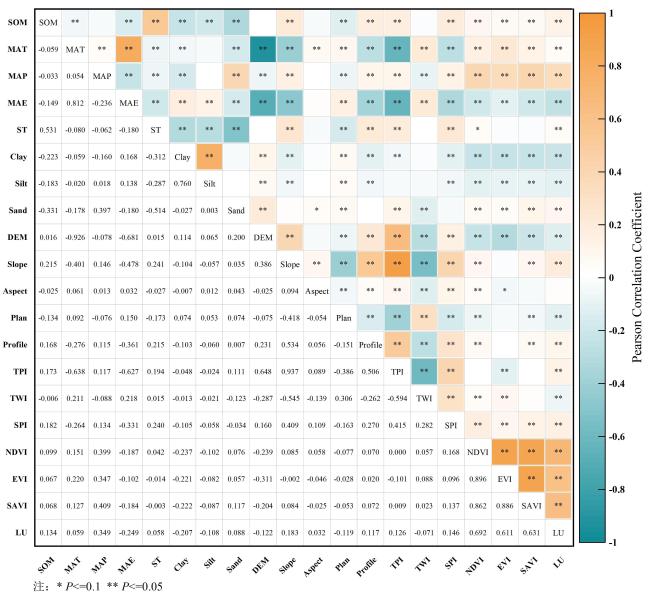
1.2.2 环境变量选取与预处理
表1 SOM制图模型的环境变量及来源Table 1 Environmental variables and data sources for the SOM prediction model |
| 类别 | 名称 | 来源 | 分辨率/m |
|---|---|---|---|
| 气候 | 年均温(Mean Annual Temperature, MAT) | 《1901—2023年中国1 km分辨率逐月平均气温、降水量、潜在蒸发散量数据集》 (国家地球系统科学数据中心,https://www.geodata.cn/) | 1 000 |
| 年降水(Mean Annual Precipitation, MAP) | |||
| 年蒸散(Mean Annual Evapotranspiration, MAE) | |||
| 土壤 | 土壤类型(Soil Type, ST) | 全国第二次土壤普查土壤类型图 | – |
| 黏粒含量(Clay) | 《中国高分辨率国家土壤信息格网基本属性数据集_90米土壤砂粒、粉粒、黏粒含量》(国家地球系统科学数据中心,https://www.geodata.cn/) | 90 | |
| 粉粒含量(Silt) | |||
| 砂粒含量(Sand) | |||
| 地形 | 高程(DEM) | ASTER GDEM 30 M数据 (地理空间数据云,https://www.gscloud.cn/) | 30 |
| 坡度(Slope) | |||
| 坡向(Aspect) | |||
| 平面曲率(Plan) | |||
| 剖面曲率(Profile) | |||
| 地形位置指数(Topographic Position Index, TPI) | |||
| 地形湿度指数(Topographic Wetness Index, TWI) | |||
| 径流强度指数(Stream Power Index, SPI) | |||
| 植被 | 归一化植被指数(Normalized Difference Vegetation Index, NDVI) | 《Landsat 8-9 OLI/TIRS C2 L2》 (地理空间数据云,https://www.gscloud.cn/) | 30 |
| 增强型植被指数(Enhanced Vegetation Index, EVI) | |||
| 土壤调整植被指数(Soil-Adjusted Vegetation Index, SAVI) | |||
| 土地利用 | 土地利用方式(Land Use, LU) | 国土变更调查数据 | – |
1.3 研究方法
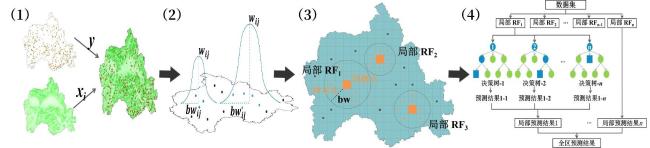
1.3.1 制图模型构建
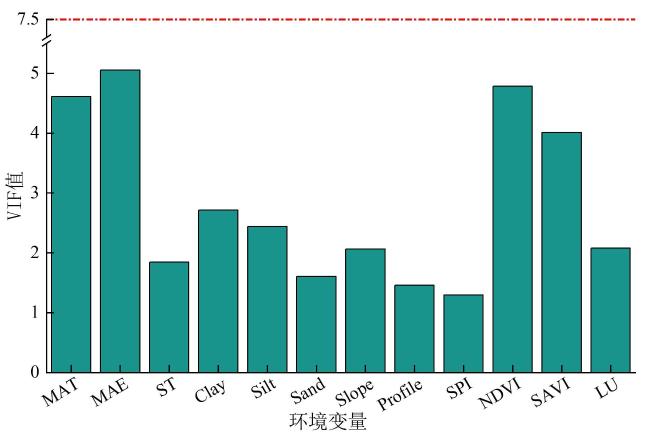
1.3.2 环境变量筛选
1.3.3 制图精度检验
2 结果与分析
2.1 描述性统计分析
表2 山东省沂源县SOM描述性统计Table 2 Descriptive statistics of SOM in Yiyuan county, Shandong province |
| 数量 | 最小值/(g/kg) | 最大值/(g/kg) | 平均值/(g/kg) | 标准差/(g/kg) | 变异系数/% | 偏度 | 峰度 |
|---|---|---|---|---|---|---|---|
| 1 565 | 2.0 | 51.1 | 15.62 | 7.45 | 47.70 | 0.53 | -0.17 |
表3 山东省耕地质量监测SOM指标分级标准Table 3 Classification standards for SOM indicators in cultivated land quality monitoring of Shandong province |
| 级别/(g/kg) | Ⅰ级(高)>25.0 | Ⅱ级(较高)(20.0,25.0] | Ⅲ级(中)(15.0,20.0] | Ⅳ级(较低)(10.0,15.0] | Ⅴ级(低)≤10.0 |
|---|---|---|---|---|---|
| 样点数量 | 170 | 173 | 371 | 501 | 350 |
| 样点占比/% | 10.86 | 11.05 | 23.71 | 32.01 | 22.37 |
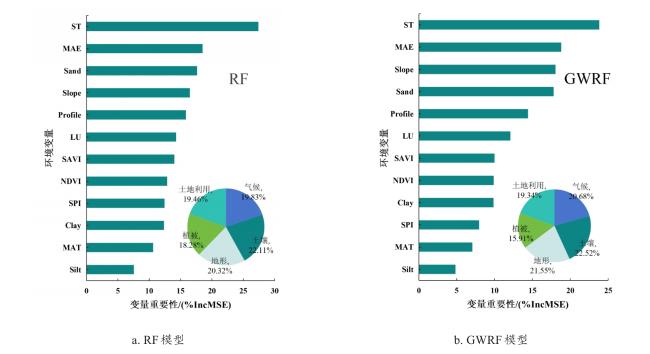
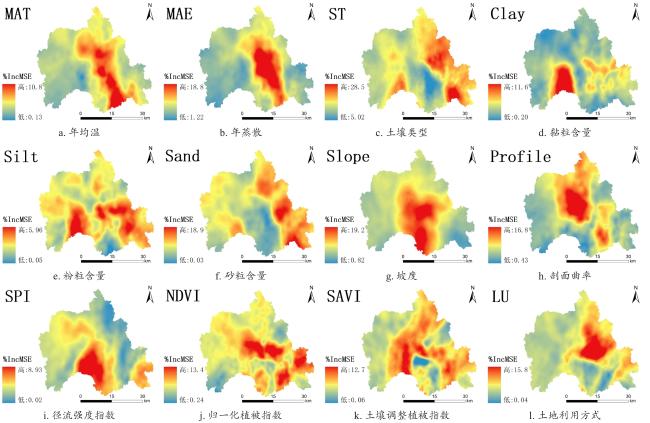
2.2 环境变量筛选
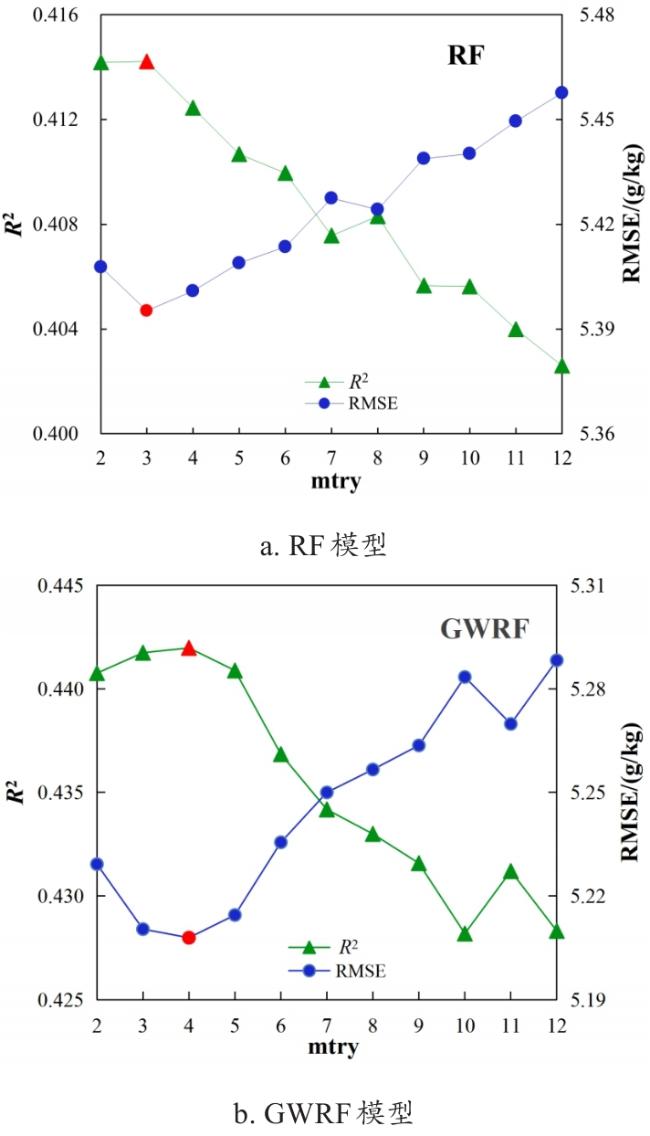
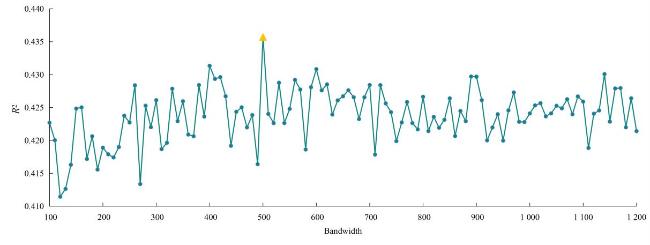
2.3 制图模型构建
表4 SOM数字制图MLR模型与GWR 模型结果Table 4 Results of the MLR model and the GWR model for SOM digital mapping |
| 模型 | RSS | AICc | R 2 | Adjusted R 2 |
|---|---|---|---|---|
| MLR | 37 851.59 | 9 319.46 | 0.38 | 0.32 |
| GWR | 29 578.75 | 8 711.93 | 0.46 | 0.37 |
表5 SOM数字制图MLR模型与GWR 模型回归系数Table 5 Regression coefficients of the MLR model and the GWR model for SOM digital mapping |
| 环境变量 | MLR模型 回归系数 | GWR模型回归系数 | |||
|---|---|---|---|---|---|
| 最小值 | 中位数 | 最大值 | 平均值 | ||
| 截距 | 7.29* | -18.03 | 8.47 | 51.12 | 12.23* |
| MAT | -1.65 | -59.31 | -0.84 | 21.06 | -8.71* |
| MAE | -1.56* | -24.90 | -2.68 | 13.62 | -3.13* |
| ST | 16.11* | 10.06 | 15.01 | 22.00 | 15.13* |
| Clay | -4.12* | -10.61 | -0.47 | 12.68 | -0.46 |
| Silt | 0.57 | -10.95 | -2.68 | 13.46 | -1.80 |
| Sand | 5.79* | -16.09 | -3.87 | 11.37 | -3.93* |
| Slope | 1.75 | -15.59 | -0.05 | 25.21 | 1.35 |
| Profile | 0.61 | -22.67 | -0.08 | 22.36 | -1.18 |
| SPI | 2.80 | -13.66 | 2.22 | 16.88 | 2.22 |
| NDVI | 1.95 | -35.79 | -1.73 | 26.47 | -2.17 |
| SAVI | -1.30 | -30.65 | 0.17 | 35.21 | 0.92 |
| LU | 3.88* | -18.11 | 1.75 | 13.11 | 1.93 |
|
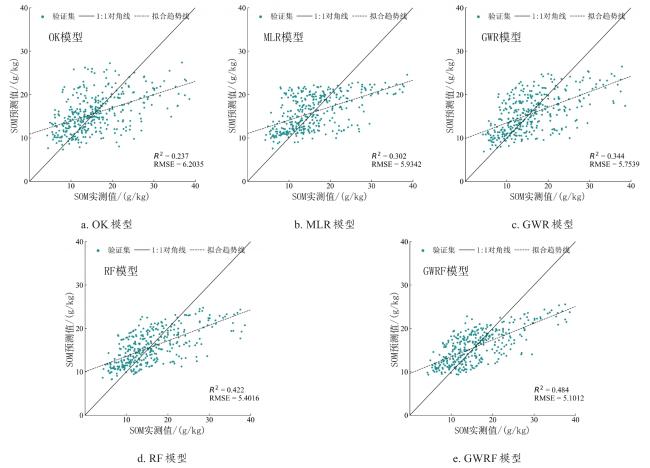
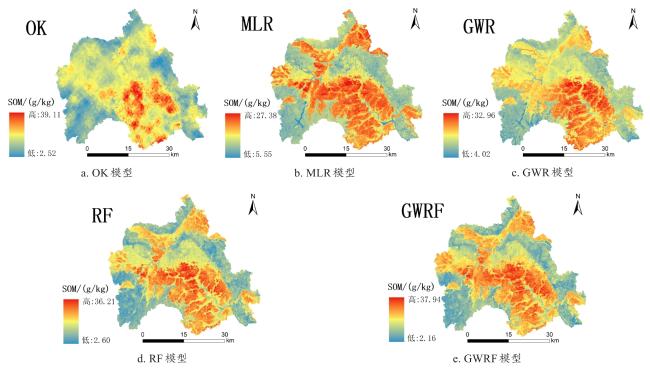
2.4 模型性能对比
表6 SOM制图模型精度对比Table 6 Accuracy comparison of SOM mapping models |
| 制图模型 | OK | MLR | GWR | RF | GWRF |
|---|---|---|---|---|---|
| R 2 | 0.24 | 0.32 | 0.35 | 0.41 | 0.48 |
| RMSE | 6.18 | 5.85 | 5.71 | 5.48 | 5.12 |
表7 SOM数字制图GWRF与其他模型预测精度差异显著性检验Table 7 Significance test of prediction accuracy differences between GWRF and other models for SOM digital mapping |
| 模型对比 | 指标 | 平均差值 | t | 自由度 | 显著性(P值) |
|---|---|---|---|---|---|
| GWRF-OK | R 2 | 0.24 | 29.79 | 19 | <0.01 |
| RMSE | -1.06 | -35.55 | 19 | <0.01 | |
| GWRF-MLR | R² | 0.16 | 19.03 | 19 | <0.01 |
| RMSE | -0.73 | -23.26 | 19 | <0.01 | |
| GWRF-GWR | R² | 0.13 | 13.91 | 19 | <0.01 |
| RMSE | -0.59 | -18.03 | 19 | <0.01 | |
| GWRF-RF | R² | 0.07 | 4.32 | 19 | <0.01 |
| RMSE | -0.36 | -5.56 | 19 | <0.01 |
|


