


0 引 言
高光谱遥感技术凭借其精细的光谱分辨率,能够捕捉作物叶片生化成分的细微变化,已成为冬小麦叶绿素含量快速监测、长势精准诊断及田间变量管理的核心技术手段[1]。叶绿素含量作为反映作物光合能力与营养状况的关键指标,其跨区域精准反演对指导区域尺度农业生产、保障粮食安全具有重要意义[2]。然而,现有高光谱反演模型多基于单一区域或局部环境条件构建,当应用于土壤类型、气候特征或田间管理存在差异的目标区域时,往往因源域与目标域的光谱特征分布异质性引发“域偏移”,导致模型预测精度显著下降[3]。传统解决方案依赖于在目标区域重新采集大量标注样本进行模型重构,不仅耗时费力、成本高昂,且难以满足大范围动态监测的实际需求[4]。因此,探索能够适应环境异质性且降低目标域样本依赖的跨区域叶绿素反演方法,已成为当前农业遥感领域急需解决的关键科学问题。
迁移学习作为机器学习的一个重要分支,其核心优势就在于通过挖掘源域已有的知识经验,提升模型在目标域的学习性能,为解决域偏移问题提供了有效思路[5]。近年来,迁移学习已在计算机视觉[6]、自然语言处理[7]等领域取得突破性进展,并成功应用于遥感图像分类[8]、作物病害识别[9]、生物量估算[10]等农业遥感任务,初步验证了跨区域适应的可行性。然而,在作物叶绿素等生化参数的高光谱反演领域,现有研究仍主要集中于单一区域内的模型优化,对跨区域迁移学习的系统性探索相对匮乏。少数涉及跨区域迁移的研究存在样本量有限、迁移策略单一等问题,未能充分揭示域偏移的复杂性与多源性,且缺乏对迁移机制的可解释性分析[11]。此外,现有研究多聚焦于模型预测精度的提升,对预测结果的不确定性量化与可靠性评估关注不足,限制了其在实际农业生产监测中的业务化应用[12]。
针对上述问题,本研究以冬小麦为研究对象,基于新乡和周口两个区域的高光谱与叶绿素含量配对数据集,系统量化两地的域偏移程度,进而提出一种多层次协同的稳健自适应迁移学习框架(Robust Adaptive Transfer Learning, RATL)。随后,从特征层、样本层和模型层协同实现跨区域知识迁移,并通过可解释性分析与不确定性量化,揭示迁移机制并验证预测可靠性,旨在为跨区域作物生化参数遥感监测提供兼具鲁棒性与可信度的技术方案。
1 材料与方法
1.1 研究区域概况
本研究选取207个冬小麦品种,包括黄淮地区品种和一些国外品种,实验于2023—2024年生长季在新乡(35.30°N,113.85°E)和周口(33.62°N,114.65°E)两个不同环境进行。两地均属暖温带大陆性季风气候,平均海拔分别为70 m和50 m。两地土壤类型存在差异,新乡以褐潮土为主,周口则以潮土为主。两地种植小麦品种完全一致,按照完全随机区组设置,采集高光谱和叶绿素数据,两地大田管理措施一致,确保品种因素不成为域偏移的来源。小区面积为3.6 m2 (1.2 m×3 m),新乡和周口分别采集了725个和766个样品的叶片土壤与作物分析仪器开发值(Soil and Plant Analyzer Development, SPAD)和冠层高光谱反射率。
1.2 数据采集
冠层高光谱反射率使用ASD FieldSpec地物光谱仪(FieldSpec 3, Analytical Spectral Devices, Boulder, CO, USA)采集。测量选择在晴朗无云天气(10∶00—14∶00)进行。光谱仪视场角25°,分辨率在350~1 000 nm范围内为3 nm,在1 000~2 500 nm则降至10 nm。为了确保测量精度,使用白色校准面板进行参考校准,并且每10个小区测量后重复校准过程。在每个实验小区内,从4个不同的位置收集光谱数据,探针垂直放置在冠层表面上方1 m 的固定高度。在每个采样点,采集10个读数,每个小区共进行40次光谱测量。采集的光谱数据使用viewspec软件(ASD公司,Boulder, CO, USA)进行处理。随后,从数据集中排除异常的光谱曲线,并对每个小区的光谱曲线进行平均,作为各自小区的反射率数据。叶片的相对叶绿素含量用SPAD仪采集。在测量过程中,从每个地块中选取3株,随后测量每株旗叶上的SPAD值,在每个叶片的不同位置取3个读数,并计算所有测量值的平均值作为该小区的SPAD值。本研究视SPAD与叶绿素含量为线性对应关系,后文统称为叶绿素含量。
1.3 高光谱数据预处理与特征构建
1.3.1 数据预处理
结合地物光谱仪的性能特点与大气对太阳辐射的吸收规律,去除信噪比过低或信息无效的波段区间,主要包括仪器响应不稳定的≤350 nm波段、受大气中水汽强烈吸收影响的1 350~1 460 nm和1 790~1 960 nm波段,以及探测器灵敏度急剧下降的≥2 395 nm波段。最终,保留了400~2 400 nm共计1 719个有效波段用于后续分析。
采用Savitzky-Golay平滑滤波(窗口长度=9,多项式阶数=2)对每条光谱曲线进行独立处理。然后对平滑后的光谱进行标准化处理,鉴于不同生理区间光谱基线差异显著,本研究采用了分段标准化(Segment Standard Normal Variate, SNV)策略,将全光谱划分为可见光-红边区(400~750 nm)、近红外平台区(750~1 350 nm)、短波红外1区(1 450~1 785 nm)和短波红外2区(2 000~2 400 nm)4个区段,分别计算各区段光谱的均值与标准差,并在段间设置5 nm的重叠区进行平滑过渡,以避免不同生理过程对应的光谱基线差异被过度压缩,从而消除叶片表面的乘性散射效应。SNV变换为公式(1) 。
式中: x 为单条光谱向量; μ 和 σ 分别为该光谱所有波段的均值向量和标准差向量。
对平滑标准化后的光谱数据计算一阶导数,以增强叶绿素敏感吸收特征,消除基线漂移影响。
1.3.2 特征选择与构建
选取15个对叶绿素含量敏感且具有明确生理意义的经典植被指数(表1),涵盖叶片色素含量、光合效率及生理状态等多个维度。将预处理后的1 719个光谱波段与15个植被指数合并,构建1 734维综合特征集,为后续迁移学习建模提供丰富的信息基础。
表1 冬小麦叶绿素含量估算的植被指数及其计算公式Table 1 Vegetation index and its calculation formula for estimating chlorophyll content of winter wheat |
| | | |
|---|---|---|
| | | |
| | (2) | |
| | | (3) |
| | | (4) |
| | | |
| | | (6) |
| | | (7) |
| | | (8) |
| | | (9) |
| | (10) | |
| | mND705 | (11) |
| | | (12) |
| | | (13) |
| | | 组合指数= (14) |
| | | (15) |
|
1.4 域偏移度量化
为定量评估源域与目标域间的真实分布差异,本研究从统计分布、相关性及特征空间距离3个层面系统量化域偏移。计算两地SPAD值的描述性统计量并进行独立样本t检验与K-S(Kolmogorov-Smirnov)[22]检验,分析其整体分布形态与差异显著性。再分别计算源域和目标域中各光谱波段与SPAD值的Pearson相关系数,以揭示光谱-生理响应关系是否随区域发生系统性变化。最后,在特征空间中使用多种度量指标进行深入评估,包括计算高维光谱的最大均值差异[23](Maximum Mean Difference, MMD)以衡量整体分布相似性,利用Wasserstein(沃瑟斯坦)距离[24]反映分布转换难度,并通过主成分分析(Principal Component Analysis, PCA)[25]降维后计算马氏距离来表征核心特征空间中的分布偏离程度,从而全面、多层次地刻画域偏移的复杂性与结构特征。
1.5 稳健自适应迁移学习框架
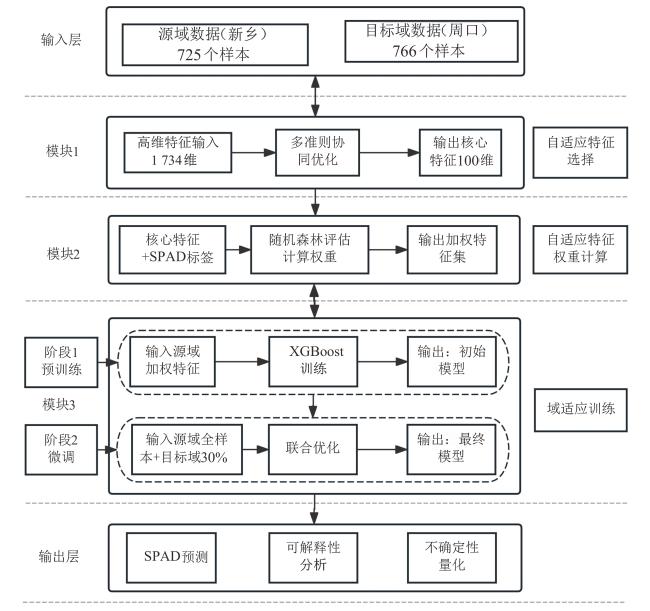
为解决高光谱叶绿素反演中因环境异质性导致的“域偏移”问题,本研究提出一种自适应迁移学习框架(Robust Adaptive Transfer Learning, RATL)。框架通过自适应特征选择、自适应特征权重计算与域适应训练3个模块递进协作,从源域(新乡)中提取可迁移的普适性知识,并使其适应目标域(周口)的数据分布。最终实现跨区域叶绿素含量的高精度、高稳健性反演。RATL以极端梯度提升(eXtreme Gradient Boosting, XGBoost)作为核心回归预测器。其整体流程如图1所示。
1.5.1 自适应特征选择模块
本模块旨在从高维光谱特征中筛选出兼具强预测能力与跨区域稳定性的核心特征子集,作为后续迁移学习的稳健输入,从而从源头上缓解维度灾难与过拟合风险。为此,采用一种多准则协同优化策略,综合评估每个特征在源域与目标域中的相关性表现。具体而言,通过公式(16) 量化各特征对叶绿素含量的预测重要性,在充分利用双域信息的同时,适度赋予源域略高的权重,以反映其标注数据的可靠性。
式中: 为组合相关系数; 和 为权重系数,本研究取 ; 分别为源域和目标域中单个特征与叶绿素含量的相关系数。
本研究考虑到红边波段(680~750 nm)对叶绿素含量变化的高度敏感性,该光谱区间内的特征在评估过程中被赋予1.5倍的增强权重,以强化其生理指示作用。同时,引入稳定性约束机制,优先保留那些在源域与目标域中相关性方向一致、强度相近的特征,有效剔除仅在单一区域偶然显著的非稳健变量。通过上述协同筛选机制,最终从由1 719个原始光谱波段与15个植被指数构成的1 734维初始特征空间中,通过5折交叉验证测试了50、80、100、120、150、200共6种特征数配置,发现特征数从50增至100时R 2提升显著,而从100增至200时R 2提升不明显,因此100维是性能-效率平衡的明确拐点。同时,自适应特征选择模块中设定的稳定性阈值(Si≥0.75)使合格特征自动收敛至97~106维,取整后为100。精炼出的这100个核心特征是最具判别力的,且具有良好的跨区域泛化能力。该特征子集不仅提升了模型的可解释性,也为后续的特征加权调整与域适应训练奠定了坚实基础。
1.5.2 自适应特征权重计算
本模块的核心是为筛选出的特征赋予差异化的权重,以量化并强化其对跨区域迁移的贡献。权重越高的特征,表明在目标域中越重要,且与叶绿素的响应关系在两地越一致,即该特征越稳定、越值得在迁移中被重点信赖。为实现这一目标,本模块采用随机森林(Random Forest)[26]进行特征重要性评估。权重的计算综合了3个维度信息:
1)源域重要性 。在源域数据上训练随机森林,获取特征重要性分数,代表该特征在原始区域的预测价值,如公式(17) 所示。
式中: 为特征 在源域上的重要性得分; 为随机森林中决策树的数量(标量); 为特征 在第 棵树中带来的损失减少量。
2)目标域重要性 。在有限的目标域迁移样本上训练随机森林,获取重要性分数,代表该特征在新区域的预测潜力。
3)响应稳定性 。计算每个特征与叶绿素含量的相关系数在源域与目标域间的绝对差异,用以度量该特征生理响应关系的区域一致性,如公式(18) 所示。
式中: 为特征 的响应稳定性得分; 和 分别为特征 在源域和目标域中与叶绿素含量的相关系数。
计算得到的权重 公式(19)所示,将直接作用于对应特征。
式中: 为特征 的最终权重; 和 分别为特征 在源域和目标域上的重要性得分; 为特征 的稳定性得分; 、 、 分别为所有特征的重要性向量和稳定性向量; 表示取向量所有元素的平均值。分母中 + + 为向量加法,结果仍为向量,取均值后得到标量。
在后续的模型训练中,每个特征值将乘以相应的 进行缩放。在输入数据层面实现特征加权,使其在训练过程中,模型(XGBoost)会自然地对高权重特征投入更多的关注和学习资源,从而引导模型的学习方向,增强其泛化能力。
1.5.3 域适应训练策略
模块利用经过选择和加权后的特征,执行渐进式联合训练,完成最终的域适应与预测。采用分层采样从目标域中选取30%的样本作为迁移样本,与全部源域样本进行联合训练。训练分为两个阶段进行。首先进行预训练,仅使用源域加权特征训练XGBoost初始模型。然后进行微调,加入目标域迁移样本,使用总体损失函数 进行联合优化。总体损失 [公式(20) ]由回归损失 (均方误差)和域适应损失 组成。
式中: 为总损失;L regression为均方误差;L domain为域适应损失; 为超参数,本研究设置为1。
通过1个域鉴别器网络实现,其目标是混淆模型对样本来源于源域还是目标域的判断,从而驱使特征提取器学习到对域变化不敏感的“域不变特征”。超参数 (设为0.1)用于平衡两项损失的贡献。经过上述自适应过程训练完成的XGBoost模型即为RATL框架的最终输出模型。其超参数设置如表2所示。选择XGBoost是因为其在处理结构化数据、拟合非线性关系及防止过拟合方面具有卓越性能,能够充分利用加权后的稳健特征集进行高精度回归预测。
表2 XGBoost模型超参数设置Table 2 XGBoost model hyperparameter settings |
| 参数 | 取值 | 说明 |
|---|---|---|
| n_estimators | 100 | 提升树的数量 |
| max_depth | 6 | 单棵树的最大深度 |
| learning_rate | 0.1 | 学习率 |
| subsample | 0.8 | 样本采样比例 |
| colsample_bytree | 0.8 | 特征采样比例 |
| reg_alpha | 0.1 | L1正则化系数 |
| reg_lambda | 1.0 | L2正则化系数 |
| random_state | 42 | 随机种子 |
|
1.6 对比方法与实验设计
1.6.1 对比迁移学习方法
为全面评估RATL框架的有效性,本研究选取了3种经典的迁移学习方法作为对比。
1)直接迁移:在源域数据上训练XGBoost模型,直接在目标域数据上测试,作为性能基准。
2)迁移成分分析(Transfer Component Analysis, TCA)[27]:该方法通过在再生核希尔伯特空间中学习1个非线性映射,将源域和目标域数据投影到1个公共的子空间,并在该子空间中最小化两地数据的最大均值差异,以此实现特征层面的边缘分布对齐。本研究中引入此方法,旨在验证仅基于MMD进行整体(边缘)分布对齐的策略,对于缓解本研究中复杂的农业光谱域偏移是否有效。
3)相关对齐(CORrelation ALignment, CORAL)[28]:侧重于对齐两域数据特征之间的二阶统计关系(协方差结构)。假设1个线性变换可以使源域和目标域数据的特征相关性趋于一致。通过与该方法对比,可以检验基于线性二阶统计量对齐的策略在处理非线性、高维农业光谱数据时的适用性及其局限。
1.6.2 实验场景设置
为系统评估迁移学习方法在跨区域叶绿素反演中的有效性,并公平比较不同策略的性能增益,本研究设计了4种对照实验场景。场景A(源域性能)仅使用新乡全部数据进行5折交叉验证,用于评估模型在源域内部的拟合能力与基准性。场景B(直接迁移基准)在新乡数据上训练模型后直接应用于周口数据测试,反映未处理域偏移时模型性能的自然下降,作为后续方法比较的基准。场景C(迁移学习对比)是核心对照实验,在训练阶段与场景B完全一致(即仅使用新乡数据且不引入任何周口标签),但通过迁移学习方法在特征层面实现域适应对齐后再在周口数据上测试,该设置确保性能差异仅由域适应算法引起,排除了训练样本变化的干扰。场景D(理想性能上限)将新乡与周口所有数据合并进行5折交叉验证,模拟目标域拥有充足标注数据的理想建模条件,为跨区域反演性能提供理论上限参考。
1.6.3 评估指标
采用以下指标[公式(21)~公式(25) ]:决定系数(Coefficient of Determination, R 2)、均方根误差(Root Mean Square Error, RMSE)、平均绝对误差(Mean Absolute Error, MAE)和性能偏差比(Ratio of Performance to Deviation, RPD)。为直观衡量迁移学习带来的改善,定义迁移增益ΔR 2为迁移学习方法相对于直接迁移(场景B)在R 2指标上的提升百分比。
式中 为实际值; 为预测值; 为实际值的平均值;n为样本数量;SD y 为实测值的标准差。
1.7 可解释性分析与不确定性量化
1.7.1 SHAP可解释性分析
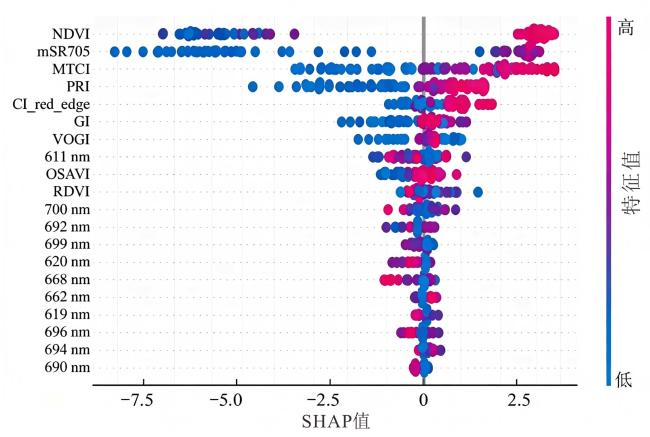
采用SHAP(SHapley Additive exPlanations)[29]框架分析模型决策机制,基于合作博弈理论计算特征对预测结果的贡献度[公式(26) ]。在本研究中,主要利用SHAP特征重要性摘要图对迁移学习前后的模型进行对比分析。该图可同时展示特征重要性排序、特征效应方向和特征交互的初步观察,通过对比RATL框架与基准模型的SHAP摘要图,能够直观揭示迁移学习如何改变模型所依赖的关键特征及其决策逻辑,从可解释性角度验证RATL引导模型聚焦于跨区域稳健的“域不变特征”的有效性。
式中: 为第i个特征的Shapley值; 为所有特征的集合; 为不包括特征 的子集; 和 分别表示子集和全集的大小; 为仅使用特征子集 的模型预测值。
1.7.2 预测不确定性量化
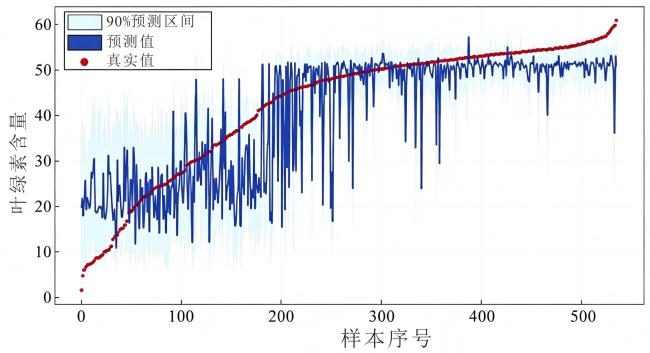
为评估模型预测的可靠性与置信度,本研究采用分位数回归森林(Quantile Regression Forests, QRF)[30]方法生成预测区间,而非单一的预测点值,并通过预测区间覆盖率(Prediction Interval Coverage Probability, PICP)[30]和平均预测区间宽度(Mean Prediction Interval Width, MPIW)[30]这两个互补指标进行评估。PICP为测试集上真实叶绿素含量值落在模型给出的对应预测区间内的样本比例。PICP越接近预设的置信水平(本研究设定为90%),表明预测区间的可靠性越高,即区间估计是校准准确的。MPIW为所有样本预测区间宽度的平均值,在保证PICP满足要求的前提下,MPIW越小,表明预测区间的精确性越高,即模型的不确定性估计越精确,而非简单通过增加区间宽度来覆盖更多真实值,如公式(27) 和公式(28) 所示。
式中:n为测试样本总数; 为第i个样本的叶绿素含量真实值;Li 和Ui 分别为模型为第i个样本生成的预测区间的下限与上限;I(·)为指示函数,当括号内条件为真时取值为1,否则为0。
2 结果与分析
2.1 数据统计分析
表3 新乡与周口冬小麦叶绿素含量描述性统计Table 3 Descriptive statistics of chlorophyll content of winter wheat in Xinxiang and Zhoukou |
| | | |
|---|---|---|
| | | |
| | | |
| | | |
| | | |
| | | |
| | | |
| | | |
| | | |
| | | |
| | | |
| | | |
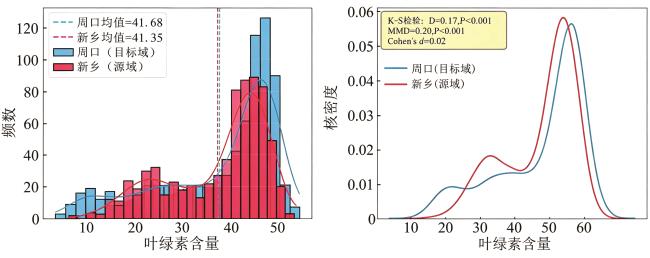
通过光谱特征域偏移量化计算。MMD值为0.20(P<0.001),表明两地高维光谱特征的整体分布存在显著差异。Wasserstein距离为0.39,提示将一地光谱分布转换为另一地需要中等调整代价。PCA降维后的投影域差异为0.21,表明核心特征空间中两地分布中心仍明显分离。关键波段相关系数差异均值为0.30,说明光谱与叶绿素的响应关系存在区域性微小变化,进一步证实跨区域应用中域偏移的客观性与复杂性。
2.2 波段选择结果可视化
自适应特征选择算法筛选出的100个核心特征在光谱曲线上的分布如图3所示。红边区域(680~750 nm)共有71个原始波段,其中42个被选中,选择比例达59.2%,显著高于其他光谱区域,表明算法成功实现了对叶绿素敏感波段的自动增强。选中特征覆盖可见光(400~700 nm)、近红外(700~1 300 nm)和短波红外(1 300~2 400 nm)全区间,且在新乡与周口两地光谱曲线上的分布位置基本对应,体现了特征的跨区域稳定性。
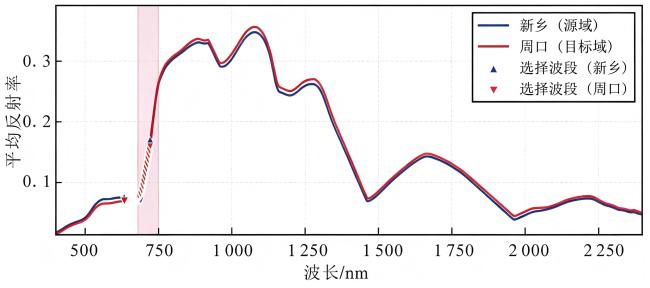
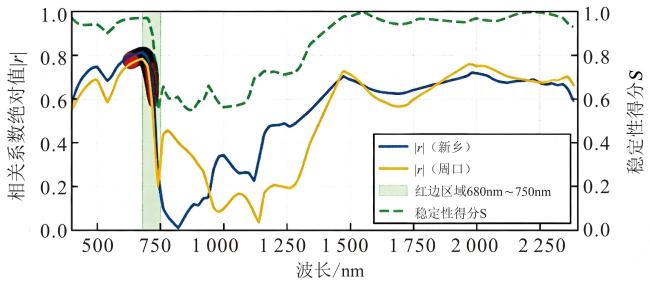
图4从量化角度验证了自适应特征选择算法的有效性,展示了选中特征与叶绿素含量的相关性及稳定性对比。红边区域波段不仅与叶绿素含量的相关性(|r|值)较高,且在两地间的稳定性得分(S值)普遍高于0.8,表明这些波段对叶绿素的响应具有显著的区域一致性。选中特征在新乡和周口的平均相关系数绝对值分别为0.45和0.42,平均稳定性得分为0.83,验证了自适应特征选择策略的有效性——优先筛选相关性高且跨区域稳定的核心特征。
2.3 模型性能对比
为评估不同实验设置下的模型性能,本研究设置了4种对照场景。场景A(源域内部验证)与场景D(两地合并理想情况)的性能如表4所示。源域内部验证的R 2达0.74,RMSE为6.08,RPD=1.97 (>1.8),满足农业遥感应用需求。两地数据合并后的R 2略降至0.71,RMSE上升至7.26,进一步证实两地数据分布的固有差异,凸显了跨区域迁移学习的必要性。
表4 新乡内部验证(场景A)与两地合并性能(场景D)的模型性能Table 4 Model performance for Xinxiang internal validation (Scenario A) and the ideal upper bound using combined data from both regions (Scenario D) |
| | | | | |
|---|---|---|---|---|
| | | | | |
| | | | | |
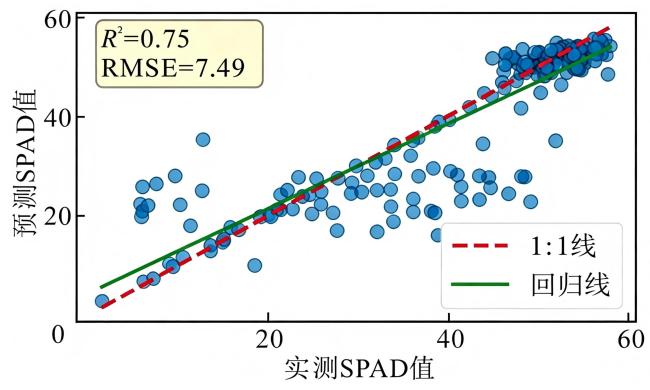
在4种实验场景中,源域内部验证(场景A)取得R 2=0.74、RPD=1.97的稳定表现,为后续比较奠定基础。场景C(跨区域迁移学习对比)的性能如表5所示。直接迁移受域偏移影响显著,R 2仅为0.61,RMSE达9.40,RPD=1.60。TCA和CORAL通过线性对齐策略,将R 2分别提升至0.64和0.65,迁移增益为5.0%和6.3%,但RMSE仍高于8.90。RATL框架通过3层协同迁移,实现R 2=0.75,RMSE=7.49,MAE=4.61,RPD=2.01,迁移增益高达23.40%,显著优于传统线性迁移方法。RATL的预测值与实测值沿1:1线紧密分布(图5),系统偏差基本消除,其性能达到场景D(理想上限)的105.60%,证实了该框架对跨区域偏移的缓解效果。
表5 迁移学习方法性能对比Table 5 Performance comparison of transfer learning methods |
| | | | | | | |
|---|---|---|---|---|---|---|
| | | | | | | |
| | | | | | | |
| | | | | | | |
| | | | | | | |
|
2.4 可解释性分析
SHAP特征重要性摘要图(图6)显示,RATL迁移后模型的特征重要性排序发生显著变化:排名前三的特征均为红边-近红外区域的植被指数,分别为mSR705、NDVI和GI,而源域模型中重要性最高的特征为绿光区的PRI。SHAP依赖分析表明,这些红边特征值的增大会持续推动叶绿素预测值升高,且在两地数据中的响应趋势一致。这一结果证实,RATL框架成功引导模型从易受局部环境干扰的特征,转向依赖对叶绿素变化高度敏感且跨区域稳定的“域不变”生理特征(尤其是红边波段),使模型决策逻辑更具区域适应性与物理解释性。应性和物理解释性。
2.5 不确定性分析
表6 RATL与直接迁移不确定性对比(90%名义置信水平)Table 6 Comparison of uncertainty between RATL and direct migration ( 90% nominal confidence level) |
| | | | | | | |
|---|---|---|---|---|---|---|
| | | | | | | |
| | | | | | | |
3 讨 论
跨区域作物叶绿素含量高光谱反演的核心挑战在于环境异质性引发的“域偏移”问题,即源域与目标域的光谱-叶绿素响应关系存在差异[1, 3]。现有迁移学习方法多通过单一维度的特征对齐缓解域偏移,但农业遥感场景中的域偏移由土壤类型、气候条件等多种因素共同导致,呈现非线性与结构性特征[31],近年来,迁移学习在农业遥感中的应用逐渐增多。SANAEIFAR等[32]采用基于Transformer的波段选择模型进行小麦病害分类,其波段选择策略与本研究的特征选择模块思路一致,但未考虑跨区域域适应问题。YIN等[33]提出注意力驱动的迁移学习框架用于时域颤振检测,其动态权重调整机制与RATL的自适应权重计算具有相似的特点,但RATL进一步引入了域适应损失实现端到端优化。且专门针对高光谱数据的多维特性设计。相比之下,RATL的创新在于3模块的递进协同:特征选择从源头筛选稳健特征,权重计算量化迁移贡献,域适应训练实现模型优化,3个模块形成闭环,而非简单的串联组合。
TCA和CORAL分别代表了基于统计矩对齐的经典方法。TCA通过最小化MMD实现全局分布对齐,适用于线性域偏移;CORAL对齐协方差矩阵,捕捉二阶统计关系。然而,农业高光谱数据的域偏移往往呈现非线性且特征维度间响应异质性[34],不同波段对叶绿素的响应在不同区域存在差异,单一对齐策略难以应对。标签指示条件对齐(Label-indicate Conditional Alignment, LiCa)框架[35]通过标签指示的条件对齐处理高光谱异谱现象,但其针对像素级分类任务设计,计算复杂度高。RATL则通过特征权重调整实现类似的条件对齐效果,对红边波段等高稳定性特征赋予高权重,对易变异特征赋予低权重,在降低计算成本的同时,更适合大田实时反演应用。本研究中TCA和CORAL的迁移增益分别仅为5.0%和6.3%,而RATL达23.40%,证实了多层次协同策略对复杂农业域偏移的适应性优势。
SHAP分析已成为农业遥感模型诊断的重要工具。LI等[36]利用极端梯度提升-沙普利加性解释(eXtreme Gradient Boosting-SHapley Additive exPlanations, XGBoost-SHA)分析菊花总黄酮预测,验证了SHAP在特征重要性排序中的有效性,但未涉及迁移学习场景。本研究创新性地将SHAP用于迁移前后模型行为对比,揭示了RATL引导模型从绿光区PRI(易受环境干扰)转向红边区植被指数(mSR705、NDVI、GI,生理本质特征)的机制。这一发现为迁移学习模型的“黑箱”问题提供了农业遥感领域的解决方案,即可解释性不仅用于验证模型合理性,更用于诊断迁移学习的有效性。此外,BANET等[37]在作物根系图像分割中提出分层次域适应策略,证实了细粒度域适应优于粗粒度全局对齐,这与RATL的3模块分层设计思路一致,表明分层域适应是处理农业图像域偏移的普适性策略。
本研究仍存在一定局限性。首先,研究仅关注空间域偏移(跨区域),未考虑时间域偏移(不同生育期)的影响,而作物光谱特征会随冠层结构、生理状态的变化产生新的域偏移[39]。其次,RATL 框架的计算复杂度较高,难以直接应用于实时动态监测。未来研究可进一步拓展框架的时空适应性,构建能够同时应对空间与时间域偏移的动态迁移学习模型;同时,通过算法轻量化(如特征降维优化、模型蒸馏),推动技术在大范围农业生产监测中的业务化应用。
4 结 论
本研究针对高光谱遥感反演冬小麦叶绿素含量的跨区域“域偏移”问题,提出稳健自适应迁移学习框架(RATL),通过自适应特征选择、特征权重调整与域适应训练3模块协同,实现了源域与目标域的有效知识迁移。基于新乡与周口1 491份样本的实验表明,两地光谱特征存在显著域偏移(MMD=0.20,P<0.001),直接迁移模型性能受限(R 2=0.61)。RATL框架在目标域取得最优预测性能(R 2=0.75,RMSE=7.49),较直接迁移提升23.4%,达到两地全数据训练理想效果的105.60%。可解释性分析证实,RATL框架增强了模型对红边波段等“域不变特征”的依赖,决策逻辑更具生理合理性。不确定性量化表明,RATL能够提供覆盖合理、宽度适配的预测区间(PICP=79.52%,MPIW=17.47),提升了预测结果的可靠性。本研究提出的RATL框架为解决农业遥感中的跨区域建模问题提供了有效方法,对推动叶绿素含量遥感监测的区域化、业务化应用具有重要实际意义。