Welcome to Smart Agriculture 中文
Information Perception and Acquisition

Edge extraction method of remote sensing UAV terrace image based on topographic feature

  • Yang Yanan 1 ,
  • Kang Yang 1 ,
  • Fan Xiao 1 ,
  • Chang Yadong 1 ,
  • Zhang Hanwen 2 ,
  • Zhang Hongming , 1
Expand
  • 1. College of Information Engineering, Northwest A & F University, Yangling 712100, China
  • 2. College of Mechanical and Electronic Engineering, Northwest A & F University, Yangling 712100, China

Received date: 2019-08-19

  Revised date: 2019-11-15

  Online published: 2019-12-24

Highlights

Terraces achieve water storage and sediment function by slowing down the slope and soil erosion. This kind of terraced or wave-section farmland built along the contour line on is a high-yield and stable farmland facility with key construction in the dry farming area. It provides a strong guarantee for increasing grain production and farmers' income. In recent years, Gansu province has carried out a large amount of construction on terraces, however, due to the poor quality of the previous construction and management, the terraced facilities are in danger of being destroyed. In order to prevent and repair the terraces, it is necessary to timely and accurately extract the terrace information. The segmentation of terraces can be obtained by edge extraction, but the effect of satellite data is not ideal. With the continuous development of remote sensing technology of drones, the acquisition of high-precision terrace topographic information has become possible. In this research, the slope is extracted from the digital elevation model data in the data preprocessing stage, then the orthophoto data of the three experimental areas are merged with the corresponding slope data, respectively. Then the rough edge extraction method based on Canny operator and the fine edge extraction method based on multi-scale segmentation are used to perform edge detection on two data sources. Finally, the influence of slope on the extraction of terraced edges of remote sensing images of UAVs was analyzed based on the overall accuracy of edge detection and user accuracy. The experimental results showed that, in the rough edge extraction method, the data source accuracy of the fusion slope and image was improved by 23.97% in the OA precision evaluation, and the average improvement in the UV accuracy was 20.68%. In the fine edge extraction method, the accuracy based on the data source 2 was also increased by 17.84% on average in the OA accuracy evaluation of the data source 1, and by an average of 19.0% in the UV accuracy evaluation. The research shows that in the extraction of terraced edges of UAV remote sensing images, adding certain terrain features can achieve better edge extraction results.

Cite this article

Yang Yanan , Kang Yang , Fan Xiao , Chang Yadong , Zhang Hanwen , Zhang Hongming . Edge extraction method of remote sensing UAV terrace image based on topographic feature[J]. Smart Agriculture, 2019 , 1(4) : 50 -61 . DOI: 10.12133/j.smartag.2019.1.4.201908-SA005

1 引言

梯田是在坡耕地上沿等高线修筑的阶台式或波浪式断面农田,通过减缓坡度,减轻土壤侵蚀来提高土地作物产量[1]。修建梯田极大地提高了坡耕地的农业生产能力[2],其蓄水的功能[3]对旱作农业发展及生态环境十分必要[4,5]。多年来,在中央强农惠农政策的指引和支持下,中国北方黄土丘陵区大力推进以坡改梯为重点的高产稳产农田建设,提高了旱作区农业综合生产能力[6],但由于前期修筑质量不佳以及管理养护不善,梯田设施面临破坏的危险[7]。梯田边缘真实地反映梯田的形状、位置、轮廓等信息,及时准确地掌握梯田边缘信息为预防和修护加固梯田提供重要的依据,同时对于梯田区域的种植面积、种植范围的统计,以及对梯田和旱作区农业建设的发展具有重要的意义[8]
传统的梯田信息获取主要通过实地调查实现,但人工统计费时费力。随着高分辨率影像处理技术的不断发展,利用高分辨率遥感影像提取梯田边缘成为可能[9,10]。与高分辨率卫星遥感数据相比,利用无人机航摄系统[11]获取高分辨率遥感影像具有运行和维护成本低[12]、操作简单灵活、获取数据快速准确等优势[13]。因此,无人机遥感成为地物信息提取等方面的主要信息获取方式[14],也是智慧农业的主要技术之一[15]
传统的边缘提取方法主要基于影像数据[16]。Eckert等[17]基于高分辨率卫星梯田影像数据,采用面向对象的方法进行识别与分类。首先对研究区的光谱特征、纹理特征以及形状特征采用支持向量机(Support Vector Machine,SVM)方法构建分类模型,进而对梯田进行大面积提取,最终的提取精度为81.25%,但是该方法不能有效提取梯田田坎间断裂的田面,技术有待进一步提升。刘丽霞等[18]提出改进Canny边缘检测的遥感影像分割方法。选择多光谱遥感影像为数据源,结合Canny算子采用引导滤波方法对图像进行平滑处理,解决了高斯滤波在进行图像平滑时边缘模糊的问题,对“椒盐现象”起到了较好的改善效果。但是该方法在分割时会将阴影部分错分为边缘。Chang等[19]提出一种新的高分辨率合成孔径雷达(Synthetic Aperture Radar,SAR)图像边缘检测方法。采用基于面积像素差异的(Scanning Window Central,SWC)检测方法,实现最佳边缘检测,并提出一种改进的能量函数主动控制方法来确定边缘的位置。陶舒等[20]基于高分辨率遥感影像提出面向对象的多尺度分割边缘提取流程。首先将研究区的高分辨率遥感影像进行第一层分割,提取潜在道路;第二层改变分割尺度,利用面积阈值等特征来进行划分。Zhang等[21]分别采用边缘特征统计算法、模板匹配算法和傅里叶变换算法来进行梯田的识别和提取。其中边缘特征统计算法根据训练样本区域来确定识别的窗口大小以及有效边缘线条数的特征阈值,基于有效边缘线条数作为模板对二值化图像进行分类并自动进行提取。模板匹配算法根据图像的灰度特征建立识别模板,通过计算方差阈值对样本进行分类。傅里叶变换方法基于梯田纹理特征,通过计算谱线方向,确定特征阈值后对样本进行分类。但是以上方法都没有进一步探索地形数据如坡度融合影像对边缘提取效果的影响。
本研究在前人研究的基础上,利用无人机航空摄影获取的高分辨率遥感梯田正射影像及地形数据,采用粗边缘提取和精细边缘提取两种边缘提取方法,对比仅正射影像、正射影像和坡度融合的两种数据源提取效果。结果表明,坡度数据对提高梯田边缘提取的精确度起到了积极的作用。本研究可以为无人机遥感影像边缘提取提供地形特征多源数据有效性证明。

2 研究区概况与数据预处理

2.1 研究区概况

中国黄土丘陵沟壑区水土流失严重,大量坡耕地严重制约了农业的生产。为保护生态环境并改善人民生产生活条件,地方政府在各类坡面修建了梯田等人工工程设施[22]。甘肃省榆中县政府自20世纪六七十年代起开始兴修梯田,县区内梯田范围清晰,面积6269.30km2[23]
本研究选取甘肃省榆中地区的龙泉乡旱梯田区,该区总面积84km2,地理坐标N35°34'4″~N35°40'56″,E104°10'58″~E104°19'51″,平均海拔2160 m,地形以沟壑梁峁为主,研究区内梯田边缘清晰,具有一定的典型性[24]
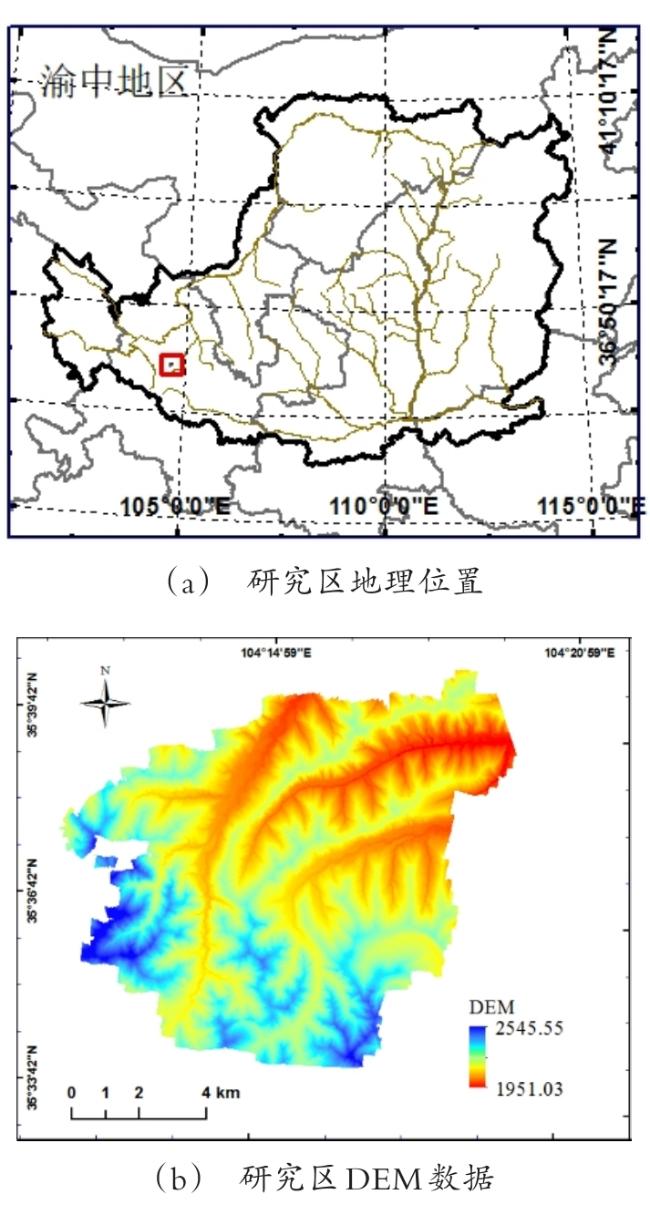
图1(a)是该区域地理位置图,图1(b)是该区域的数字高程模型(Digital Elevation Model,DEM)数据。
图1 研究区地理位置及DEM数据

Fig.1 Geographic location coordinates and DEM data of research area

2.2 数据基础及预处理

2.2.1 数据基础

研究区影像采用安翔动力AF1000型无人机于2016年3月拍摄,拍摄期间风力小于4级,天气晴朗且能见度高,全程总计耗时约24 h。搭载SONY A5100相机,单幅影像面积约340m×500 m,影像分辨率为0.05m。基于该精度要求,在样本区内的梯田边缘、道路交叉口中心共布设83个地面控制点,使用实时动态定位(Real-time Kinematic,RTK)进行测量。
采集到的原始数据使用Agisoft PhotoScan软件进行处理,首先导入影像、POS数据及控制点数据,然后将全部区域分成25个测区块进行处理,每块有5000幅左右图像,逐一进行点云提取和立体模型建立,最后合并,进行纹理提取,获得数字表面模型(Digital Surface Model,DSM)[25]。将点云数据分为地面点和非地面点两类,非地面点作为噪声进行处理。滤波处理后得到剔除非地面点的DEM数据,该DEM数据分辨率为0.5 m[26]。依据无人机影像制作的1:500地形图的平面和高程精度均满足GB/T 7930-2008[27]对1:500平地、丘陵的成图要求。
课题组从研究区域截取3块梯田样本区,其正射影像如图2所示。样本区1(图2(a))田面分布交错,边缘特征多样,比较明显。样本区2(图2(b))田面光谱复杂,边缘规则但狭窄,样本区内包含少量道路。样本区3(图2(c))田面纹理复杂,边缘不规则且弯曲度大,样本区内包含大量道路和少量丘陵。
图2 样本区正射影像图

(a)样本区1正射影像 (b)样本区2正射影像 (c)样本区3正射影像

Fig.2 Orthophoto map of sample area

2.2.2 数据预处理

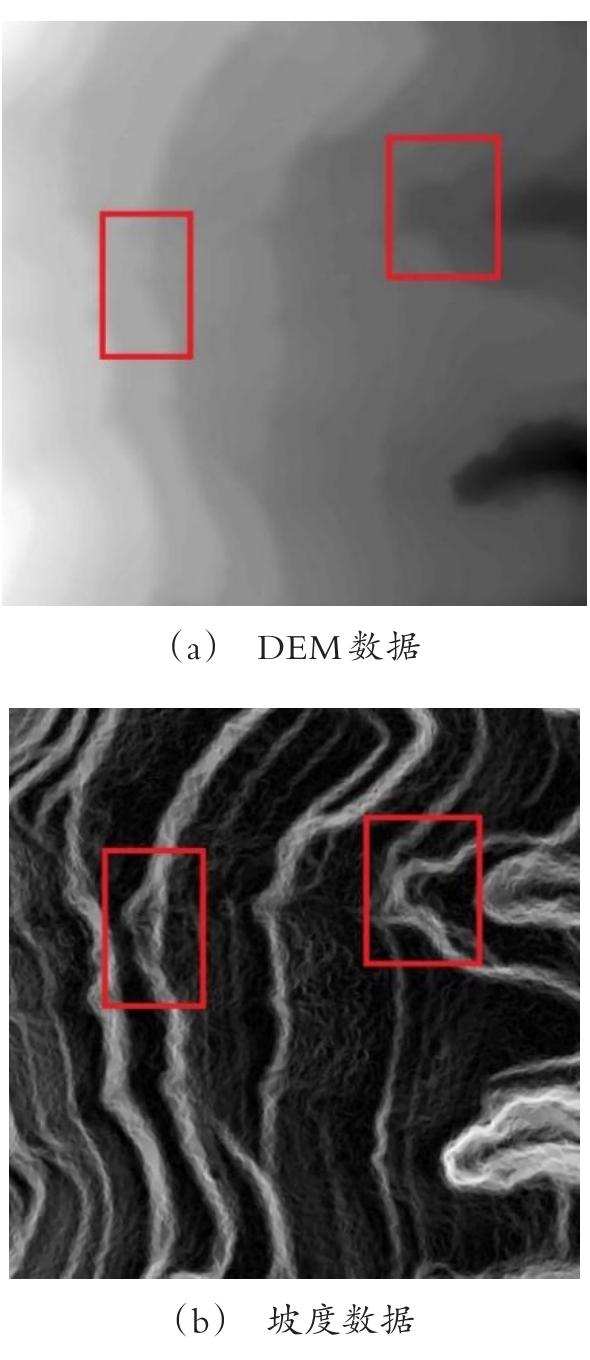
图3红色边框区域所示,由于DEM数据在梯田边缘处的变化远不如坡度数据明显,本研究使用ArcGIS10.5软件通过DEM数据计算,得到样本区的坡度数据,并分别使用无人机正射影像、无人机正射影像和坡度融合这两种数据对梯田边缘进行提取。
图3 DEM数据及坡度数据

Fig.3 DEM data and slope data

3 试验方法

本研究将正射影像、正射影像和坡度融合的两种数据源,依次使用基于Canny算子的边缘提取方法[24]进行粗边缘提取和基于多尺度分割方法[26]进行精细边缘提取,最终分别对比两种方法正射影像、正射影像和坡度融合的两种数据源的边缘提取效果。

3.1 粗边缘提取方法

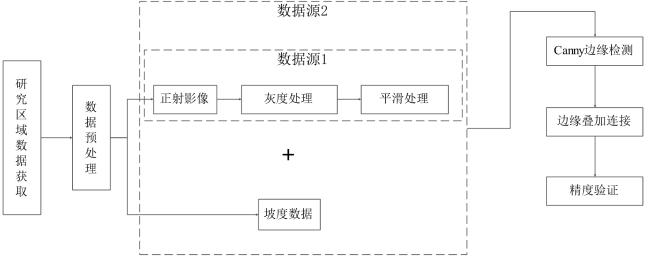
首先对正射影像进行灰度处理和平滑处理,处理后的影像作为数据源1,将数据源1与该样本区对应的坡度数据融合作为数据源2。最后分别对数据源1和数据源2使用Canny检测算子进行边缘检测,两种数据源检测得到的边缘分别叠加连接到原始的正射影像图中并进行精度验证和对比。方法流程图如图4所示。
图4 粗边缘提取方法流程图

Fig.4 Rough edge extraction method flow chart

3.1.1 影像灰度处理及平滑处理

无人机正射梯田影像中,田面上纹理复杂并存在大量点状干扰,为降低正射影像中田面复杂的细节干扰,同时不使田面的边缘结构模糊,本研究使用粗边缘提取方法将图像进行灰度转换和平滑处理。
正射影像转换灰度图像方法见公式(1):
F i , j = 0.299 F i , j r + 0.299 F i , j g + 0.299 F i , j b
其中, F i , j 为像素点 i , j 转换后的灰度值, F i , j r 为像素点 i , j 的红色分量, F i , j g 为像素点 i , j 的绿色分量, F i , j b 为像素点 i , j 的蓝色分量。
采用高斯平滑[28] 方法对转换后的灰度图进行平滑处理,其公式为:
f i , j = k = 0 m - 1 l = 0 n - 1 e - k 2 - l 2 2 δ 2 f ( i - k , j - l )
其中,δ为方差,值为1;m,n为窗口数量,值均为3; f i , j 为像素点 i , j 的灰度值;k为求和下标,k=1,2,……,l为求和下标,l=1,2,……。

3.1.2 Canny边缘检测

Canny检测算子主要包括计算梯度幅值和方向、梯度幅值的非极大值抑制、双阈值方法检测和伪边缘剔除4个部分。与Sobel和Roberts等边缘检测算子相比[29],Canny算子具有单边缘响应、信噪比高和定位准确等优点,在边缘提取方面应用较广[30]
(1)梯度幅值和方向的计算
首先对平滑后的影像数据及坡度数据中的像素点使用一阶微分算子进行卷积计算,计算出该像素点的梯度及方向,一阶微分算子 H 1 H 2 见公式(3):
H 1 = - 1   1 1 1 H 2 = 1 1   - 1   - 1
梯度和方向的计算公式如公示(4)和(5):
G x m , n = f m . n H 1 m , n G y m , n = f m . n H 2 m , n
G m , n = G x 2 m , n + G y 2 ( m , n ) θ g m , n = a r c t a n G x ( m , n ) G y ( m , n )
其中, G x m , n 为像素点(m,n)处的x坐标方向梯度, G y m , n 为像素点(m,n)处的y坐标方向梯度, G m , n θ g m , n 分别为像素点(m,n)处的梯度和方向, f m . n 是像素点 m , n 的灰度值。
(2)幅值非极大值抑制和双阈值检测
为确定梯田边缘,从全局梯度中选择保留局部最大值,并对极大值以外的其他梯度设置2个阈值 t h 1 t h 2 进行抑制, t h 1 =0.5 t h 2 ,非极大值抑制之后提取到梯田的候选边缘。
(3)伪边缘剔除
田面复杂的纹理特征容易检测出虚假边缘,本研究根据表1的边缘检测规则,对梯田坡度和影像数据的伪边缘通过遍历的方式进行剔除,步骤如下:
表1 研究区域梯田地物特征规则表

Table 1 Terrace land feature classification rule of research area

地物对象 梯田边缘 丘陵 道路
边缘长度(pix) >100 >300 >200
坡度(°) 7~20 <15 0~6
坡度变化率(%) <7 >20 0~2
① 将图像按顺序扫描,找到第1个没有标记并且满足梯田边缘规则的像素点,将其压入栈内。
② 设①中的像素点为 ( x 0 , y 0 ) ,以 ( x 0 , y 0 ) 为中心,遍历 ( x 0 , y 0 ) 的邻域是否有标记的像素点,如果有,将该像素点与 ( x 0 , y 0 ) 合并在同一区域内,也压入栈内。
③ 从堆栈中取出一个像素,把它当作 ( x 0 , y 0 ) ,返回到步骤②操作。
④ 当堆栈为空时,判断合并的区域像素个数,满足梯田边缘规则中的边缘长度则返回到①;不满足则剔除该区域之后返回步骤①。
⑤ 重复步骤①~④直到图像中每个像素点都被标记。

3.2 精细边缘提取方法

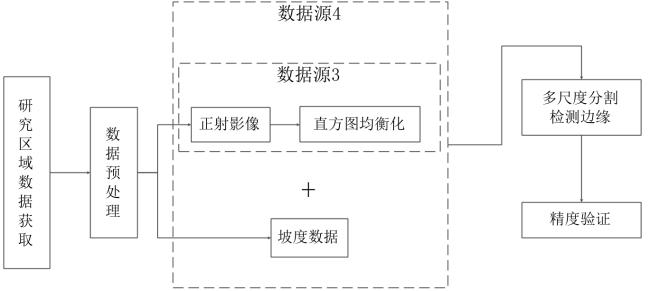
精细边缘提取方法流程如图5所示。首先将样本区的正射影像数据进行直方图均衡化处理作为本方法数据源3,然后将坡度数据与数据源3融合作为本方法的数据源4,最后分别将数据源3和数据源4依次进行多尺度分割、边缘增强处理和精度验证。
图5 精细边缘提取方法流程图

Fig.5 Meticulous edge extraction method flow chart

3.2.1 直方图均衡化

为获得更好的边缘检测效果,首先使用限制对比度自适应直方图均衡化(Contrast Limited Adaptive Histogram Equalization,CLAHE)方法[30]进行数据增强。CLAHE同普通的自适应直方图均衡不同之处主要是其对比度限幅。在CLAHE中,对于每个小区域都必须使用对比度限幅,主要是用来克服其他直方图均衡化方法的过度放大噪音的问题。

3.2.2 多尺度分割

首先基于Microsoft Visual Studio C++ 2013平台开发的SmartSIAT工具[31,32]进行面向对象分析的最优尺度分析,利用SmartSIAT工具计算该数据的最优分割尺度后,应用eCognition Developer9.0软件平台中的Multiresolution Segmentation工具,每层权重设置为1,尺度设置为SmartSIAT工具计算出来的最优尺度,进行像素级分割标记。

3.3 精度评价方法

基于目视解译制作粗边缘提取和精细边缘提取的真值图,把4个数据源测试结果图按像素点与真值图一一对照进行精度统计,并计算边缘检测总体精度(Overall Accuracy,OA)[33]和用户精度(User’s Accuracy,UA),精度计算公式如下:
overall accuracy= 1 - T R T R + T F
User’s accuracy= E d T R T R
其中,TR为结果图中与真值图标记结果相同的像素点;TF为结果图中与真值图标记不同的像素点,EdTR为标记结果边缘的点。

4 结果分析

4.1 粗边缘提取方法

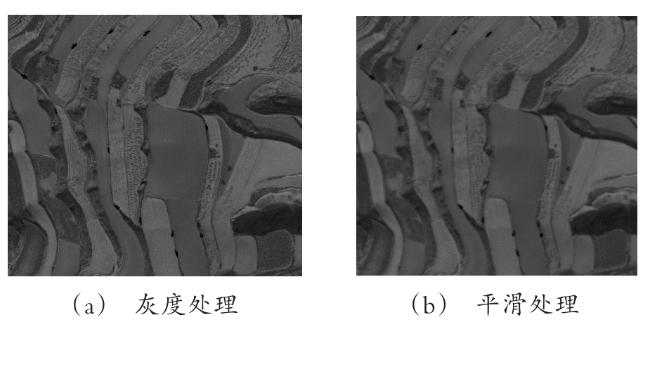
以样本区1为例,灰度转换和平滑处理的效果图如图6示。
图6 灰度处理及平滑处理效果图

Fig.6 Grayscale processing and smoothing effect images

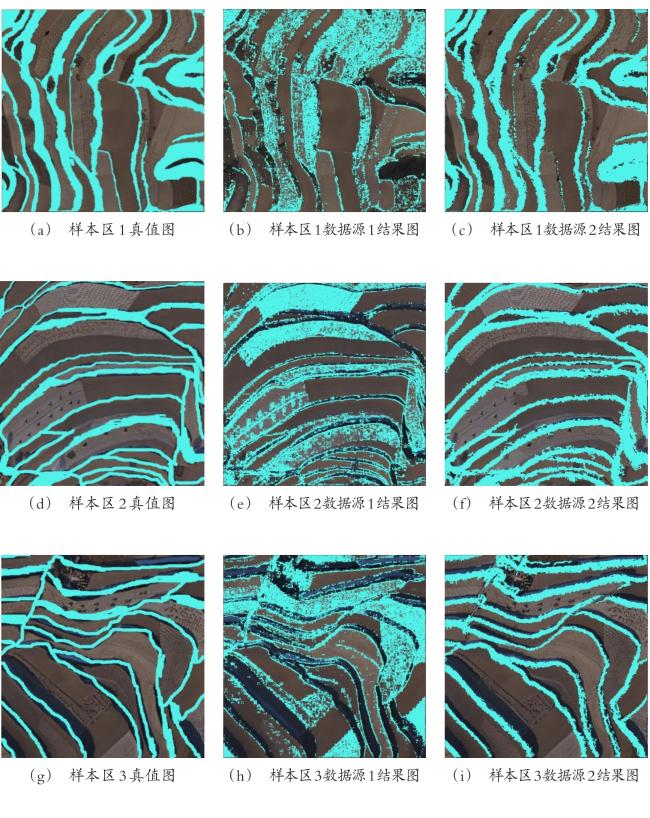
三个样本区的提取结果如图7所示,其中第一列为样本区1、2、3的粗边缘提取真值图,第2列为基于正射影像的数据源1粗边缘提取结果图,第3列为基于正射影像和坡度融合的数据源2粗边缘提取结果图。可见,数据源2在粗边缘提取方法中边缘检测效果得到了明显的提高,大幅度减少了梯田田面错分为梯田边缘的现象,取得了更准确的分割结果。在三个样本区中,仅基于正射影像的数据源1将部分不平整的田面也提取为梯田边缘,融合坡度数据后的数据源2明显减少了这种误差,取得了更精确的提取结果。具体的精度值如表2所示,样区1基于数据源2的OA精度相比基于数据源1提高31.3%,UA精度提高28.21%;样区2基于数据源2的OA精度相比基于数据源1提高19.13%,UA精度提高15.56%;样区3基于数据源2的OA精度相比基于数据源1提高21.66%,UA精度提高18.27%。
图7 粗边缘提取样本区结果对比图

Fig.7 Comparison results of sample area processed by rough edge extraction

表2 粗边缘提取样本区精度

Table 2 Accuracy of rough edge extraction sample area

样本区

数据源1

OA精度(%)

数据源1

UA精度(%)

数据源2

OA精度(%)

数据源2

UA精度(%)

1 61.85 62.45 92.96 90.66
2 59.76 67.51 78.89 83.07
3 63.97 66.77 85.63 85.04

4.2 精细边缘提取方法结果

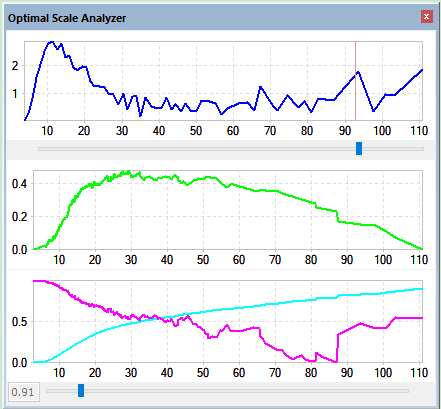
以样本区1为例,在SmartSIAT工具中将形状因子设置为0.5,建立相应的尺度集,根据尺度分析图(图8)得出最佳分割尺度为0.91。
图8 最优尺度分析图

Fig.8 Optimal scale analysis

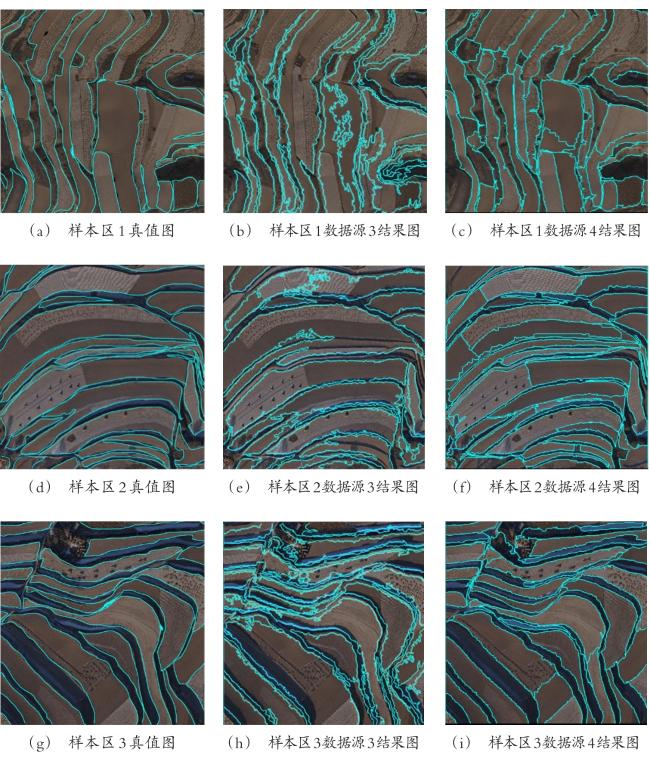
三个样本区的边缘提取效果如图9,其中第1列为样本区1、2、3的精细边缘提取真值图,第2列为基于正射影像的数据源3精细边缘提取结果图,第3列为基于正射影像和坡度融合的数据源4精细边缘提取结果图。由结果图对比可以看出,正射影像和坡度融合的数据源4在精细边缘提取方法中取得了更好的提取效果。在三个样本区中,仅基于正射影像的数据源3都受到了梯田田面纹理的严重干扰,提取的边缘崎岖不平滑且不够准确,融合坡度数据后的数据源4明显降低了这种干扰,提取的边缘结果更平滑准确。具体的精度值如表3所示,样区1,样区2,样区3的数据源4相比数据源3在OA精度和UA精度两个方面都有所提升。样区1基于数据源4的OA精度相比基于数据源3提高14.33%,UA精度提高12.84%;样区2基于数据源4的OA精度相比基于数据源3提高19.24%,UA精度提高14.44%;样区3基于数据源4的OA精度相比基于数据源3提高19.96%,UA精度提高29.74%。
图9 精细边缘提取样本区结果对比图

Fig.9 Comparison results of sample area processed by meticulous edge extraction

表3 精细边缘提取样本区精度

Table 3 Accuracy of meticulous edge extraction sample area

样本区

数据源3

OA精度(%)

数据源3

UA精度(%)

数据源4

OA精度(%)

数据源4

UA精度(%)

1 67.40 70.7 81.73 83.54
2 65.26 67.76 84.50 82.2
3 62.07. 59.09 82.03 88.83

4.3 精度分析

对粗边缘提取样本区精度(如表2所示),精细边缘提取样本区精度(如表3所示)进行分析,在粗边缘提取方法中,正射影像和坡度融合的数据源2比正射影像数据源1在OA精度评价中平均提高了23.97%,在UA精度评价中平均提高了20.68%。在精细边缘提取方法中,正射影像和坡度融合的数据源4比正射影像数据源3在OA精度评价中平均提高了17.84%,在UA精度评中平均提高了19.0%。两种梯田边缘提取方法中,正射影像和坡度融合后的梯田边缘提取效果都比正射影像有所提高。表明坡度数据的加入有效地提升了梯田边缘提取的效果。

5 讨论与结论

本研究通过无人机正射影像、正射影像与坡度融合的两种数据源,依次使用粗边缘提取方法和精细边缘提取方法进行梯田边缘的提取。结果表明,在两种方法的梯田边缘分割效果中,正射影像与坡度融合的数据都明显优于单一的影像数据,从而证明了坡度数据的加入有助于无人机遥感影像边缘提取取得更准确的结果。
地形特征的加入有助于梯田区域的有效分割,高精度的遥感影像数据更加提升了分割效果。本研究结论适用于无人机梯田遥感影像的分割及基于分割进行的检测工作。但本研究仅探索了梯田影像的分割,对于农田、河堤等其他的土地类型分割尚未做研究,仅可作为坡耕地类型土地的分割参考。
本研究仍有许多可以改进之处:①只对比了坡度数据对梯田遥感影像边缘提取的影响,尚未探索更多其地形因子对边缘提取效果的影响;②可以考虑设计一种模型按权重将不同地形数据结合对梯田遥感影像边缘进行提取。
1
张宏鸣, 杨勤科, 王猛, 等 . 梯田区侵蚀地形因子随DEM分辨率变化的特征分析[J]. 农业机械学报, 2017, 48(10): 172-179.

Zhang H , Yang Q , Wang M , et al . Analysis of DEM resolution on erosional terrain characteristics of terrace area[J]. Transactions of the CSAM, 2017, 48(10): 172-179.

2
Fukamachi K . Sustainability of terraced paddy fields in traditional satoyama landscapes of Japan[J]. Journal of Environmental Management, 2016, 11(61): 1-7.

3
Kang L , Bao H , Liu L , et al . Analysis and confirm of the indexes of water storage and sediment trapping on the terrace of different type regions at the loess plateau[J]. Science of Soil and Water Conservation, 2005, 3(2): 51-56.

4
缪建群, 王志强, 马艳芹, 等 . 崇义客家梯田生态系统可持续发展综合评价[J]. 生态学报, 2018, 38(17): 6326-6336.

Miu J , Wang Z , Ma Y , et al . Comprehensive evaluation of sustainable development of the Hakka Terrace Ecosystem of Chongyi[J]. Acta Ecologica Sinica, 2018, 38(17): 6326-6336.

5
Strehmel A , Jewett A , Schuldt R , et al . Field data-based implementation of land management and terraces on the catchment scale for an eco-hydrological modelling approach in the Three Gorges Region, China[J]. Agricultural Water Management, 2015, 10(07): 175-192.

6
徐勇, 党丽娟, 汤青, 等 . 黄土丘陵区坡改梯生态经济耦合效应[J]. 生态学报, 2015, 35(4): 1258-1266.

Xu Y , Dang L , Tang Q , et al . Ecological-economic coupling effects of transforming slope farmland to terraces in the hilly-gully region of loess plateau[J]. Acta Ecologica Sinica, 2015, 35(4): 1258-1266.

7
Wang H , Wang Y . Factors influencing indigenous rice protection in the Yuanyang terraced rice fields of China[J]. Journal of Resources and Ecology, 2017, 8(3): 287-295.

8
Veeck G , Li Z , Gao L . Terrace construction and productivity on loessal soils in Zhongyang County, Shanxi Province, PRC[J]. Annals of the Association of American Geographers, 1995, 85(3): 450-467.

9
Thomas C , Ranchin T , Wald L , et al . Synthesis of multispectral images to high spatial resolution: A critical review of fusion methods based on remote sensing physics[J]. IEEE Transactions on Geoscience and Remote Sensing, 2008, 46(5): 1301-1312.

10
Zhou Q , Yu Q , Liu J , et al . Perspective of Chinese GF-1 high-resolution satellite data in agricultural remote sensing monitoring[J]. Journal of Integrative Agriculture, 2017, 16(2): 242-251.

11
纪景纯, 赵原, 邹晓娟, 等 . 无人机遥感在农田信息监测中的应用进展[J]. 土壤学报, 2019, 56(4): 774-784.

Ji J , Zhao Y , Zou X , et al . Advancement in application of UAV remote sensing to monitoring of farmlands[J]. Acta Pedologica Sinica, 2019, 56(4): 774-784.

12
Fang H , Chen H , Jiang H , et al . Research on method of farmland obstacle boundary extraction in UAV remote sensing images[J]. Sensors, 2019(19): 4431-4444.

13
汪小钦, 王苗苗, 王绍强, 等 . 基于可见光波段无人机遥感的植被信息提取[J]. 农业工程学报, 2015, 31(5): 152-159.

Wang X , Wang M , Wang S , et al . Extraction of vegetation information from visible unmanned aerial vehicle images[J]. Transaction of the CSAE, 2015, 31(5): 152-159.

14
兰玉彬, 邓小玲, 曾国亮 . 无人机农业遥感在农作物病虫草害诊断应用研究进展[J]. 智慧农业, 2019, 1(2): 1-19.

Lan Y , Deng X , Zeng G . Advances in diagnosis of crop diseases, pests and weeds by UAV remote sensing[J]. Smart Agriculture, 2019, 1(2): 1-19.

15
赵春江 . 智慧农业发展现状及战略目标研究[J].智慧农业2019, 1(1): 1-7.

Zhao C . State-of-the-art and recommended developmental strategic objectives of smart agriculture[J]. Smart Agriculture, 2019, 1(1): 1-7.

16
季虎, 孙即详, 邵晓芳, 等 . 图像边缘提取方法及展望[J]. 计算机工程与应用, 2004, 40(14): 70-73.

Ji H , Sun J , Shao X , et al . The algorithm for image edge detection and prospect[J]. Computer Engineering and Applications, 2004, 40(14): 70-73.

17
Eckert S , Tesfay Ghebremicael S , Hurni H , et al . Identification and classification of structural soil conservation measures based on very high resolution stereo satellite data[J]. Journal of Environmental Management. 2017, 193: 592-606.

18
刘丽霞, 李宝文, 王阳萍, 等 . 改进Canny边缘检测的遥感影像分割[J]. 计算机工程与应用2019, 55(12): 54-58.

Liu L , Li B , Wang Y , et al . Remote sensing image segmentation based on improved Canny edge detection[J]. Computer Engineering and Applications, 2019, 55(12): 54-58.

19
Chang Y , Zhou Z , Chang W , et al . New edge detection method for high-resolution SAR images[J]. Journal of Systems Engineering and Electronics,2006,17(2): 316-320.

20
陶舒, 周旭, 刘倩, 等 . 面向对象的高分辨率遥感影像数据的道路提取流程——地理国情普查数据的自动提取[J]. 遥感信息, 2015, 30(6): 76-80, 95.

Tao S , Zhou X , Liu Q , et al . Objects-oriented method of data extraction in national geographic census : A case study of road[J]. Remote Sensing Information, 2015, 30(6): 76-80, 95.

21
Zhang Y , Shi M , Zhao X , et al . Methods for automatic identification and extraction of terraces from high spatial resolution satellite data (China-GF-1)[J]. International Soil and Water Conservation Research, 2017, 5(1): 17-25.

22
Liu S , Dong Y , Li D , et al . Effects of different terrace protection measures in a sloping land consolidation project targeting soil erosion at the slope scale[J]. Ecological Engineering, 2013(53): 46-53.

23
王勇 . 甘肃省梯田建设的三大丰碑[J]. 中国水土保持, 2015(10): 21-22.

Wang Y . Three monuments of terrace construction in Gansu province[J]. Soil and Water Conservation in China, 2015(10): 21-22.

24
张宏鸣, 胡勇, 杨勤科, 等 . 基于影像与坡度数据融合的梯田田块分割方法[J]. 农业机械学报, 2018, 49(04): 249-256.

Zhang H , Hu Y Yang Q , et al . Segmentation method of terraced fields based on image and gradient data[J]. Transactions of the CSAM, 2018, 49(04): 249-256.

25
赵鹏, 张立朝, 禄丰年, 等 . 利用LiDAR点云数据进行空间分析[J]. 测绘科学, 2014, 39(3): 85-88.

Zhao P , Zhang L , Lu F , et al . Application of LiDAR point cloud data in spatial data analysis[J]. Science of Surveying and Mapping, 2014, 39(3): 85-88.

26
薛牡丹, 张宏鸣, 杨江涛, 等 . 无人机影像与地形指数结合的梯田信息提取[J]. 计算机应用研究, 2019, 36(9): 1-12.

Xue M , Zhang H , Yang J , et al . Extraction of terrace information based on UAV image and topographic index[J]. Application Research of Computers, 2019, 36(9): 1-12.

27
马聪丽 . GB/T 7930-2008《1∶5001∶10001∶2000地形图航空摄影测量内业规范》修订说明[J]. 测绘标准化, 2009, 25(1): 1-2.

Ma C . On the revision of GB/T 7930-2008 specifications for aerophotogrammetric office operation 1: 5001 : 10001 : 2000 topographic maps[J]. Standardization of Surveying and Mapping, 2009, 25(1): 1-2.

28
Lopez-Molina C , de Baets B , Bustince H , et al . Multiscale edge detection based on Gaussian smoothing and edge tracking[J]. Knowledge-Based Systems, 2013(44): 101-111.

29
Shi G , Suo J . Remote sensing image edge-detection based on improved Canny operator[C]// 2016 8th IEEE International Conference on Communication Software and Networks (ICCSN), 2016: 652-656.

30
Canny J . A computation approach to edge detection[M]. IEEE transactions on pattern analysis and machine intelligence, 1986, 8(6): 679-698.

31
Hu Z , Li Q , Qian Z , et al . Unsupervised simplification of image hierarchies via evolution analysis in scale-sets framework[J]. IEEE Transactions on Image Processing, 2017, 26(5): 2394-2407.

32
Hu Z , Li Q , Qin Z , et al . A bilevel scale-sets model for hierarchical representation of large remote sensing images[J]. IEEE Transactions on Geoscience and Remote Sensing, 2016, 54(12): 1-12.

33
Polak M , Zhang H , Pi M . An evaluation metric for image segmentation of multiple objects[J]. Image and Vision Computing, 2009, 27(8): 1223-1227.

Outlines

/