


1 引 言
基于作物籽粒蛋白质含量(Grain Protein Content,GPC)遥感监测预报的研究目前已得到探索和初步应用,可以归纳为4类:(1)基于“遥感信息-籽粒蛋白质含量”模式的经验模型,该模型通过分析作物关键生育时期的遥感信息(敏感波段、植被指数、红边参数等光谱特征)直接构建作物GPC统计经验模型[3-7];(2)基于“遥感信息-农学参数-籽粒蛋白质含量”模式的定量模型,该模型根据遥感信息与关键生育期农学参数之间的定量关系及农学参数与GPC之间的定量关系,构建GPC预测模型[8-10];(3)基于遥感数据和生态因子的GPC半机理模型,该模型考虑了作物氮素运转机理和生态因子对GPC的影响,改善了模型的年际扩展性和空间转移性[11-14];(4)基于遥感信息和作物模型结合的机理解释模型,该模型综合考虑籽粒蛋白质形成过程中各种生态因子的影响,通过遥感信息和作物生长模型耦合的同化方法,调整模型模拟变量与遥感观测值的误差达到最小,以调整作物模型的初始参数和状态变量,进而实现GPC的预测[14,15]。综合分析以上各类方法与模型的选择,前两类模型研究较多,操作简单且易实现,但机理解释性不强,在区域间和年际间扩展应用过程中监测结果偏差较大;同化模型方法考虑过多的输入变量,并且复杂的同化算法、品质生长模型本地化精度和高耗时运算时间问题,限制了该类方法的区域大面积应用[16]。Li等[12]和Xu等[13]通过综合考虑影响品质遥感预报模型中环境变异因素及品种筋型因子,引入分层线性模型(Hierarchical Linear Models,HLM)解释籽粒蛋白质含量-遥感-环境的嵌套问题,构建基于开花期的冬小麦品质预测模型,很好地解决了模型年际扩展和空间扩展存在较大偏差的问题。因此,发展以遥感信息(反映作物养分状况)与环境因子(体现时空变异)结合的GPC半机理预测方法,构建普适性及适用于时空扩展的籽粒蛋白质遥感预测模型具有可行性。
2 数据与方法
2.1 冬小麦研究区
试验分别于2008年、2009年和2019年在全国冬小麦5个主产省(河南省、山东省、河北省、安徽省和江苏省)进行数据采集,包括样点取样及测试、小麦品种及筋型确定、气象数据收集和遥感数据获取,共获取样品898个,去除异常点后得到样品864个,其中2008年200个,2009年283个,2019年381个,测样点分布如图1 所示。其中,强筋小麦86个,强筋和中筋混合区小麦249个,中筋小麦380个,中筋和弱筋混合区小麦2个,弱筋小麦147个。

2.2 数据获取
2.2.1 冬小麦籽粒蛋白质测定
在冬小麦成熟期,获取农户冬小麦样品和样点经纬度,每个农户收割3个样点,每个样点1 m2,经过自然晾晒、风干、称重和求均值。最后利用近红外谷物分析仪FOSS InfratecTM 1241(Tecator,赫加奈斯,瑞典)测定冬小麦GPC(14%干基)并记录。
2.2.2 冬小麦品种及筋型确定
在冬小麦样品测试过程中,同时记录农户种植冬小麦的品种信息,通过查询品种的信息确定品种的强/中/弱筋特性。区域品质预报过程中,考虑品种的多样性及复杂性,参考2001年农业部发布的《中国小麦品质区划方案》所指定的依据和原则,利用全国农业技术推广服务中心收集汇总的品种推广数据,以及以县为单位发布的当年主推品种,确定每个县种植小麦筋型特性。最终形成以县为单位的冬小麦品质区划图。
2.2.3 EOS/MODIS遥感影像
以抽穗—开花期为时间节点进行冬小麦品质预报,本研究选择基于中分辨率成像光谱仪(Moderate-resolution Imaging Spectroradiometer,MODIS)遥感影像构建的增强型植被指数(Enhanced Vegetation Index,EVI)进行建模[13]。如公式(1) 。
EVI =2.5×(RNir-RRed)/(RNir+6×RRed-7.5×RBlue)
其中,R Nir 、R Red和R Blue分别代表近红外波段、红光波段和蓝光波段的反射率。为消除区域物候差异与有云覆盖影响,分别获取2019年和2020年4月—5月MODIS数据,分析获取对应像元最大值作为抽穗—开花期的影像结果。
2.2.4 气象数据
冬小麦研究区的气象栅格数据从欧洲中期预报中心(European Center for Medium-Range Weather Forecasts,ECMWF)(http://www.ecmwf.int/)获取。本研究气象数据主要包括4月份的月积温(℃·日)、月太阳辐射量(MJ/m2)和月总降雨量(mm),选择这3个气象因子进行冬小麦品质预报是因为研究区内冬小麦从起身期到开花期约为一个月时间(不分年份),而该生育阶段包括的拔节期、挑旗期、抽穗期及开花期是冬小麦生长最重要的生育时期,对于群体的建成、穗粒数以及养分积累具有决定作用。利用Python 3.7(Python Software Foundation,波特兰,美国)及 Matlab 2014(Mathworks Inc, 纳蒂克, 美国)分别进行数据下载及读取。
2.3 冬小麦品质预报模型
分层线性模型(Hierarchical Linear Model, HLM)是一种考虑了数据嵌套结构(例如学生镶嵌于班级)的最小二乘回归分析,然而相比一般最小二乘回归分析,HLM在针对数据之间的不独立性时,将数据集分层、综合分析层内数据(第一层模型)以及层内与层外数据(第二层模型)之间的关系[17]。
GPCij = β0j+β1j·EVI i +β2j·Glu + rij
β nj = γ n 0 + γ n 1·nRad + γ n 2·nTem + γ n 4·nPre + μ nj
其中,nRad、nTem和nPre分别为每个栅格4月份月太阳辐射量归一化值、月积温归一化值和月总降雨量归一化值;β nj分别对应第一层模型中截距、增强型植被指数系数和品种筋型系数;γ n0为第二层级的截距,γ n1、γ n2和γ n3分别为第二层级总辐射量、总降水量和积温的模型系数,μnj则表示为随机误差。气象数据的归一化见公式(4) (以Rad为例)。
nRad = (Rad i- Radmin)/(Radmax- Radmin)
其中,Radi、Rad max和Rad min为分别每个栅格4月份月太阳辐射量、最大太阳辐射量和最小太阳辐射量,MJ/m2。为进一步测试模型,考虑不同的气象因子组合并对比模型的精度,以确定最优的气象因子。模型的构建与验证通过Matlab 2014实现。
2.4 统计分析
经过异常点剔除后获得2008年、2009年和2019年样点数据共计864组,将三年数据混合后随机选择其中80%数据用于建模(共计691组),剩下20%数据用于模型精度验证(共计173组)。利用Matlab 2014实现对冬小麦GPC预测值与实测值之间的统计分析。采用决定系数R²和均方根误差RMSE验证预测模型的精确度与可靠性。R²值越接近于1,说明模型拟合程度越高。RMSE值越小,说明模型预测能力越强,稳定性好且可靠性高。另外,为进一步分析冬小麦品质预测模型中各个自变量因子对最终GPC的贡献度,采用相对重要性分析法(Dominance Analysis)[18]对模型中各个自变量因子对GPC的相对重要性进行计算和排序。
3 结果与分析
3.1 冬小麦品质区划分析
参考《中国小麦品质区划方案》所指定的依据和原则,结合5个冬小麦主产省各自的品质区划,以及当前主推品种的面积及市县分布,最终形成冬小麦品质区划分布图(图2 )。
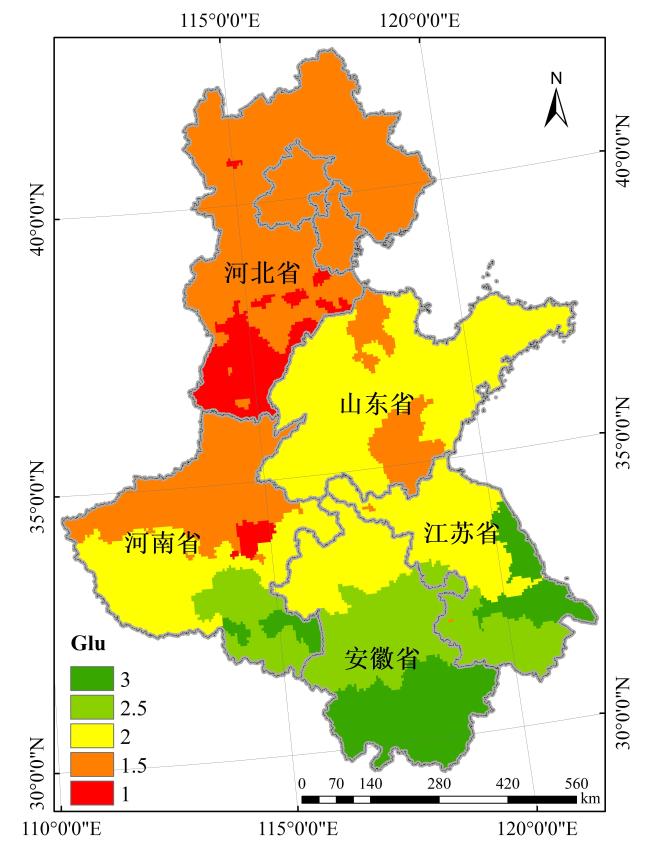
总体来看,强筋小麦主要以北部地区种植为主,如河北中南部、河南省北部、山东省临沂市和滨州市等。中筋小麦以山东省种植面积最广、河南南部地区、江苏省北部和安徽省北部等也有分布。弱筋小麦则主要分布在江苏南部及沿海地区、安徽中南部及河南南部地区等。通过调查发现,冬小麦的品质区划除了与生态因子(气象及土壤等)相关以外,也与品种推广和政府决策相关,例如2019年山东省济麦22、鲁原502和山农28号等中筋品种推广占总面积的95.3%,虽然山东省适合强筋和中强筋小麦种植,但综合来看强筋小麦品种占比不大。另外,在政府决策方面,2019年河北省发布的《河北省强筋小麦产业提质增效推进方案(2019—2022年)》确定以藁城、赵县、栾城、元氏、柏乡、隆尧、任县、宁晋、南和、沙河、大名、肥乡等为主要推广区县。本研究所确定的小麦品质区划专题图是在小麦品质区划和2019年各市县的主推品种调查分析后形成的。在确定过程中,受县级单位信息发布不全、部分市县品种复杂等影响,在最终确定品种筋型过程中,以市为单位确定较多,后续的研究及调查过程中需要更精确的品种推广范围,以确定准确的冬小麦筋型分布信息,为后续的品质预测模型提供可靠的筋型空间分布信息。
3.2 GPC预报模型的气象因子选择
以不同的气象因子参与分层线性模型进行冬小麦GPC预报模型构建,并对比模型精度进行气象因子的评价(表1 )。结果表明,单独一个气象因子进行品质预报时,以nRad为输入变量构建的冬小麦GPC预报模型精度(R2 = 0.31,RMSE = 1.12%)均高于分别以nTem和nPre为输入变量构建的冬小麦GPC预报模型。两个气象因子参与冬小麦GPC预报模型的精度有一定的提高,以nRad和nPre组合构建的冬小麦GPC预报模型较好(R2 = 0.38,RMSE = 1.05%)。三个气象因子共同参与冬小麦GPC预报精度最佳,模型的R2和RMSE分别为0.39和1.04%。考虑到冬小麦籽粒蛋白质形成过程中受辐射量、温度和降水的综合影响,在区域大面积模型构建过程中,气象因子存在较大的空间变异性。有关气象因子对GPC预报模型在不同尺度范围上的影响,有必要在品质关联的气象要素的指标筛选及关联度分析等方面进行进一步研究,特别是气象因素在区域的空间变异。
表 1 不同气象因子构建的冬小麦GPC预报模型精度Table 1 Predicting GPC model in winter wheat by different meteorological data |
| 编号 | 气象因子 | GPC模型建模集 | GPC模型验证集 | ||
|---|---|---|---|---|---|
| R 2 | RMSE/% | R 2 | RMSE/% | ||
| 1 | nRad | 0.31 | 1.12 | 0.37 | 0.99 |
| 2 | nTem | 0.26 | 1.15 | 0.29 | 1.05 |
| 3 | nPre | 0.31 | 1.11 | 0.28 | 1.06 |
| 4 | nRad, nTem | 0.35 | 1.08 | 0.41 | 0.96 |
| 5 | nTem, nPre | 0.33 | 1.10 | 0.29 | 1.05 |
| 6 | nRad, nPre | 0.38 | 1.05 | 0.39 | 0.97 |
| 7 | nTem, nRad, nPre | 0.39 | 1.04 | 0.43 | 0.94 |
|
进一步通过相对重要性分析GPC预报模型中各个自变量因子对GPC预测的贡献。从表2 结果中可以看出,冬小麦品种对GPC的影响是最大的,Glu相对重要性达到75.31%,品种的遗传特性直接决定品质的高低,考虑到较大的研究区域,品种的多样性对模型结果具有较高的相关性;气象因子对GPC的重要性依次为辐射量(nRad)、温度(nTem)和降水量(nPre),相对重要性分别为10.05%、7.61%和6.54%;遥感信息重要性最低。但是,当以局部区域(以河北省冬小麦研究区为例)为研究区时,局部区域的品种多样性减少,Glu的相对重要性降低到48.22%;同时由于局部区域的气象条件变异减小,除nRad比重相对增加外,nTem和nPre依次减少;反之,体现作物长势及养分差异的EVI的相对重要性增加(22.65%)。
表2 冬小麦GPC预测模型中各个自变量因子的贡献度Table 2 Contribution degree of each independent variable in GPC model of winter wheat |
| 模型自变量 因子 | 黄淮海地区 | 河北省 | ||
|---|---|---|---|---|
| 相对重要性/% | 排名 | 相对重要性/% | 排名 | |
| Glu | 75.31 | 1 | 48.22 | 1 |
| nRad | 10.05 | 2 | 20.32 | 3 |
| nTem | 7.61 | 3 | 5.08 | 4 |
| nPre | 6.54 | 4 | 3.73 | 5 |
| EVI | 0.49 | 5 | 22.65 | 2 |
通过以上分析初步得到以下结论。模型中各个自变量因子对GPC的贡献度在不同的研究尺度有所差异:局部区域品种与气象因子差异较小,植株长势及养分的变异对GPC的结果影响更大;反之,大范围区域品种与气象因子的较大差异,导致植株长势及养分的变异对GPC的结果影响降低。当然,本研究在样点收集过程中通过示范区(2008年和2009年)和农户协助收集(2019年)获得,样点空间代表性不强,对结论的解释还有待进一步验证。另外,本研究气象因子选择4月份数据作为模型输入,主要考虑到该生育阶段包括的拔节期、挑旗期、抽穗期及开花期是冬小麦生长最重要的生育时期,对于群体的建成、穗粒数以及养分积累具有决定作用。对于区域应用而言,由于区域间该生育时期时长差异,后期在进一步品质预测的研究中,需结合区域物候提取,进而精确获取冬小麦关键生育时期的气象数据。
3.3 冬小麦GPC预报模型
以3个气象因子为输入变量构建冬小麦GPC预报模型作为初步的区域预报模型。图3 是GPC估算模型建模集和验证集的实测值与估算值关系图。建模集的R2为0.39,RMSE为1.04%,可以看出样点数据中高估的样点数据多于被低估的样点数据,尤其是部分2009年北京样点和江苏样点,但大部分样点是集中在1:1线的周围;验证集的R2为0.43,RMSE为0.94%;所有样本数据(建模集+验证集)实测值与估算值的R2为0.40,RMSE为1.03%。结果表明,结合遥感与气象数据的分层线性预测模型在区域GPC预测上具有可行性,并且模型的预测稳定性较高。

3.4 冬小麦GPC区域预报
将GPC模型由样点数据推及到面域范围,得到2019年冬小麦GPC估算图(图4 )。越红的地区代表GPC越高,绿色代表GPC偏低,基本呈现从北到南冬小麦品质逐渐降低的趋势。2019年黄淮海地区冬小麦GPC最高的地区是河北省、山东省北部以及河南省中部和北部,基本在13.6%以上,其中河北省大部分及河南省北部GPC达到14.6%以上;山东省西部、河南省东部与西南部地区、安徽省北部与江苏省北部地区GPC基本在12.3%~13.6%之间。GPC最低的地区是江苏省东南部沿海地区与河南省东南部地区,GPC基本低于12.3%。

4 结 论
本研究在864个冬小麦实测品质样点(2008年、2009年和2019年)基础上,利用分层线性模型构建了冬小麦GPC估算模型对2019年冬小麦主产区(河南省、山东省、河北省、安徽省和江苏省)范围内的冬小麦GPC进行估算。估算模型分为两层:第一层模型是基于GPC、EVI和冬小麦籽粒筋型构建;第二层模型是基于第一层模型中的模型系数与外部气象数据(温度nTem、降水nPre、辐射量nRad)的归一化值构建。GPC估算模型建模集精度R2为 0.39,RMSE为1.04%;验证集精度R2为0.43,RMSE为0.94%。将GPC估算模型应用于冬小麦主产区的GPC遥感估算,最终得到2019年冬小麦主产区品质预报图。结果证明,构建的籽粒蛋白质遥感预测模型具有较好的普适性和时空扩展性。
本研究以MODIS影像(空间分辨率为250 m)为例初步在大尺度黄淮海地区冬小麦种植区开展应用,粗分辨率的遥感影像数据在冬小麦面积提取方面存在混合像元的问题在本研究中未进行深入探讨。因此,在接下来的研究中有必要开展高分辨率影像数据(Landsat-TM、Sentinel-2或者高分系列卫星数据等)在冬小麦品质预报的应用。


