Welcome to Smart Agriculture 中文
Topic--Application of Spatial Information Technology in Agriculture

Identification and Level Discrimination of Waterlogging Stress in Winter Wheat Using Hyperspectral Remote Sensing

  • YANG Feifei ,
  • LIU Shengping ,
  • ZHU Yeping ,
  • LI Shijuan
Expand
  • Agricultural Information Institute, Chinese Academy of Agricultural Sciences/Key Laboratory of Agri-information Service Technology, Ministry of Agriculture and Rural Affairs, Beijing 100081, China

Received date: 2021-05-08

  Revised date: 2021-06-27

  Online published: 2021-08-23

Highlights

The frequent occurrence of waterlogging stress in winter wheat not only seriously affects regional food security and ecological security, but also threatens social and economic stability and sustainable development. In order to identify the waterlogging stress level of winter wheat, a waterlogging stress gradient pot experiment was set up in this research. Three factors were controlled: waterlogging stress level (control, slight waterlogging, severe waterlogging), stress duration (5 days, 10 days, 15 days) and wheat variety (YF4, JM31, JM38). Leaf and canopy hyperspectral data were measured by using ASD Field Spec3 and Gaiasky-mini2 imaging spectrometer, respectively. The data were collected from the first waterlogging day of winter wheat. The sunny and windless weather was selected and measured every 7 days until the wheat was mature. Combined with vegetation index, normalized mean distance and spectral derivative difference entropy, if winter wheat was under waterlogging stress was monitored and stress level was identified. The results showed that: 1) the spectral response characteristics of winter wheat under waterlogging stress changed significantly in RW, RE, NIR and 1650-1800 nm region, which may be due to the sensitivity of these regions to physiological parameters affecting the spectral response characteristics, such as pigment, nutrient, leaf internal structure, etc; 2) the simple ratio pigment index SRPI was the optimal vegetation index for identifying the waterlogging stress of winter wheat. The excellent performance of this vegetation index may come from its extreme sensitivity to the epoxidation state and photosynthetic efficiency of the xanthophyll cycle pigment; 3) the red light absorption valley (RW: 640-680 nm) region was the optimal region for identifying waterlogging stress level. In RW region, waterlogging stress level of winter wheat could be determined by the spectral derivative difference entropy at heading, flowering and filling stages. The greater the level of waterlogging stress, the greater the spectral derivative difference entropy. This may be due to the fact that the RW region was more sensitive to pigment content, and the spectral derivative difference entropy could reduce the effects of spectral noise and background. This study could provide a new method for monitoring waterlogging stress, and would have a good application prospect in the precise prevention and control of waterlogging stress. There are still shortcomings in this study, such as the difference between the pot experiment and the actual field environment, the lack of independent experimental verification, etc. Next research could add pot and field experiments, combine with cross-validation, to further verify the feasibility of this research method.

Cite this article

YANG Feifei , LIU Shengping , ZHU Yeping , LI Shijuan . Identification and Level Discrimination of Waterlogging Stress in Winter Wheat Using Hyperspectral Remote Sensing[J]. Smart Agriculture, 2021 , 3(2) : 35 -44 . DOI: 10.12133/j.smartag.2021.3.2.202105-SA001

1 引 言

农业生产对气候条件具有较强的依赖性。涝渍灾害作为主要自然灾害之一,正成为制约作物生长的明显因素。涝渍灾害是一种慢性灾害现象,监测困难。传统的监测方法主要包括检测土壤水分和作物体内水分状况等,存在劳动强度大、观测不及时等缺陷。高光谱遥感信息丰富、无破坏性,可为监测涝渍胁迫提供一种无损、实时、可信的方法。基于高光谱遥感对涝渍胁迫进行早期监测,尽早提供有关植被状况信息,对制定精确的生产投入管理方案至关重要1
目前基于高光谱遥感监测作物环境胁迫程度的研究主要集中于监测重金属胁迫和病害胁迫程度。其中,刘美玲等2基于光谱高频组份的分维数诊断水稻铅污染胁迫水平,表明结合小波变换、分形分析和模糊数学可有效实现光谱弱信息提取、度量及建模,以监测重金属胁迫程度;Zhang等3研究发现冠层空气温差分布的平均值和标准差是较好的水稻重金属胁迫水平判别指标;Li等4利用多源遥感数据的互补特性,融合高光谱遥感和雷达遥感监测稻田重金属胁迫程度;杨兴川等5研究发现,在单叶尺度下,基于785 nm波段的二次曲线模型反演烟煤病严重程度的效果较为理想;Stefan等6通过高光谱成像,结合单纯形体积最大化和支持向量机的组合自动量化大麦白粉病症状,实现在每个测量日对所有栽培品种疾病严重程度的准确评估;Gui等7提出卷积神经网络和支持向量机相结合的方法检测大豆早期花叶病毒病,模型识别准确率较高。部分研究集中于判别冻害胁迫、粉尘胁迫、干旱胁迫及盐胁迫程度。其中,王慧芳等8利用主成分分析方法构建冬小麦冻害严重度反演模型,模型效果达到极显著;Liang等9设计粉尘胁迫归一化指数,结合随机森林分类算法预测小麦叶片的粉尘胁迫程度,精度较高;Zhang和Zhou10基于干旱胁迫梯度试验,研究发现绿色叶绿素指数,红边叶绿素指数和红边归一化指数对冠层水分含量和平均叶片等效水厚度的变化最为明显;Miguel等11分别基于主成分分析和计算红边区域二阶导数近似值的指数建立盐度效应监测模型,研究不同盐度水平对莴苣的影响,两种模型均可有效监测盐胁迫程度,但基于指数的模型更简单易用。
对作物涝渍胁迫的研究方向主要包括检测单一涝渍胁迫的发生,建立涝渍胁迫下生理生化参数反演模型12及区分不同环境胁迫,而对判别涝渍胁迫程度的研究较少。其中,熊勤学等13建议用670~2400 nm波段光谱的均值差异反映小麦受渍情况;Xia等14结合二次判别分析、K-最近邻和支持向量机等方法,发现利用高光谱成像技术检测油菜涝渍胁迫可行;Zhao等15基于高光谱图像和卷积神经网络检测棉花涝渍胁迫;高小梅等16结合相关分析和神经网络方法,建立基于高光谱和数字图像特征指标的受渍冬小麦叶绿素仪(Soil and Plant Analyzer Develotrnent,SPAD)值估算模型;Emengini等17研究发现高光谱和热红外遥感结合可能区分石油污染、涝渍及油渍胁迫。植被原始光谱在采集中易受噪声、土壤背景信息等因素影响,涝渍胁迫对作物光谱的影响微弱而难于探测,光谱微分可减弱背景信息对原始光谱信号的影响,通过计算不同曲线光谱微分的差值,可进一步减少光谱噪声的影响18。因此,可以结合植被指数和归一化均值距离识别冬小麦涝渍胁迫,并结合光谱微分差信息熵对其涝渍胁迫程度进行判别。
本研究以长江中下游地区的江苏省扬州市为研究区,基于盆栽试验,于拔节期对冬小麦进行不同梯度的涝渍胁迫处理,采用冬小麦叶片光谱、冠层高光谱成像数据,结合植被指数、归一化均值距离和光谱微分差信息熵等方法,理清涝渍胁迫下冬小麦叶片及冠层光谱特征,识别冬小麦涝渍胁迫并对其胁迫程度进行判别。

2 材料与方法

2.1 试验设计

研究对象为冬小麦(品种:扬幅麦4号(YF4)、济麦31号(JM31)、济麦38号(JM38))。试验于2018—2019年在扬州大学盆栽试验场遮雨棚内进行。2018年11月10日播种,播种密度为每盆8穴,每穴2粒,待生长到三叶一心时定苗至每盆8株,共189盆。2019年5月28日收获。盆底内径20 cm,口内径28 cm,高29 cm,空盆重0.54 kg。每盆装风干轻壤土10 kg与5.28 g复合肥,复合肥N-P-K比例为15%-15%-15%,播种后覆土1 kg,拔节期追施复合肥3.52 g。
于冬小麦拔节期(2019年3月15日)开始采用称重法控水,进行涝渍胁迫梯度试验,控制拔节期涝渍胁迫水平(对照CK,渍水ML,淹水SL),胁迫时间(5 d,10 d,15 d)及小麦品种(YF4、JM31、JM38)三个因子。其中,CK处理控制土壤相对含水量为70%~80%,ML处理控制土壤相对含水量为85%~90%,SL处理保留土壤表层水层1.5 cm 左右;YF4为正常品种,JM31为对水分高度敏感品种,JM38为对水分高度不敏感品种。于2019年3月30日结束所有涝渍处理,此后等量控制浇水,直至成熟收获。试验共21组处理,每个处理设9次重复,共189次试验。

2.2 数据采集

试验数据的获取频率为从小麦拔节期第一次渍水日开始,选择晴朗无风天气,试验当天在10:00—14:00测量盆栽冬小麦的叶片及冠层光谱数据,每7 d测量一次,阴雨天延后,直至小麦成熟。
(1)叶片光谱数据。采用美国ASD公司(Analytical Spectral Devices)生产的便携式地物光谱仪(Field Spec3)测量冬小麦叶片光谱反射率,光谱采样间隔为1.4 nm(采样范围350~1000 nm)和2 nm(采样范围1000~2500 nm),重采样间隔1 nm。利用自带光源型手持叶片光谱探测器夹取叶片中间部位测量光谱,各处理测定5盆,每盆测定4次,取均值作为该处理的冬小麦叶片光谱反射率,测量前使用标准白板进行定标校正,测量过程中每隔30 min进行一次标准白板校正。
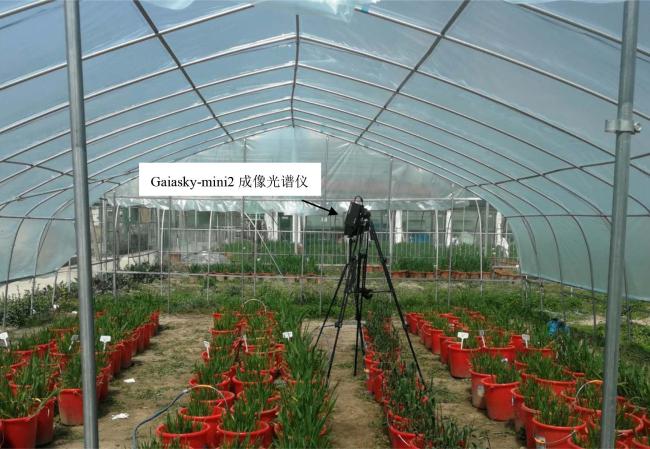
(2)冠层光谱数据。采用四川双利合普公司生产的Gaiasky-mini2推扫式成像光谱仪(光谱范围400~1000 nm,采样间隔4 nm)测量冬小麦冠层光谱反射率。采用三脚架支起Gaiasky-mini2成像光谱仪,镜头垂直向下,距小麦冠层1 m拍摄,各处理测定5盆,取均值作为该处理的冬小麦冠层光谱反射率,测量前使用标准白板进行定标校正。盆栽冬小麦冠层高光谱数据采集现场图见图1
图1 盆栽冬小麦冠层高光谱数据采集

Fig. 1 Hyperspectral data collection of potted winter wheat

2.3 数据处理与分析方法

2.3.1 植被指数

植被指数可综合相关光谱信号,在增强植被信息的同时减弱土壤等非植被信息的影响,有效反映植被与土壤等背景之间的差异性,各个植被指数在一定条件下能用来定量说明植被的生长状况。结合已有研究13,19,本研究选择可能反映作物水分状况的植被指数如表1所示。
表1 植被指数列表

Table1 List of vegetation indices

植被指数 定义描述

归一化植被指数20

(Normalized Difference Vegetation Index,NDVI)

N D V I = ( I R - R ) / ( I R + R ) (1)

结构不敏感色素指数21

(Structure Insensitive Pigment Index,SIPI)

SIPI =(R800-R445)/(R800+R680) (2)

归一化植被水指数22

(Normalized Difference Water Index,NDWI)

N D W I = ( I R - M R ) / ( I R + M R ) (3)

绿通道植被指数23

(Green Normalized Difference Vegetation Index,GNDVI)

GNDVI =(R750-R550)/ (R750+R550) (4)

光化学反射植被指数24

(Photochemical reflectance index, PRI)

P R I = ( R 531 - R 570 ) / ( R 531 + R 570 ) (5)

简单比值色素指数25

(Simple Ratio Pigment Index,SRPI)

SRPI=R430/R680 (6)

注: R λ为波长 λ对应的反射率; R I R M R分别为645~680 nm、757~817 nm和1428~1456 nm波段的平均光谱反射率

2.3.2 归一化均值距离

Fisher准则是特征选择的有效方法之一,其主要思想是鉴别性能较强的特征表现为类内距离尽可能小,类间距离尽可能大,即类别间相对距离可度量类别可分性26,传统常用距离包括欧氏距离、马氏距离和汉明距离等27。本研究引入归一化均值距离定量评估不同植被指数识别涝渍胁迫冬小麦能力的优劣,距离越大,说明植被指数识别能力越强28。综合分析最优植被指数值的相对大小和变化趋势可以判断冬小麦是否遭受涝渍胁迫。归一化均值距离原理为:
d n o r m = ( μ 1 - μ 2 ) / ( σ 1 + σ 2 )
其中, μ 1 μ 2分别为对照、涝渍胁迫下植被指数均值; σ 1 σ 2分别为对照、涝渍胁迫下植被指数的标准差。

2.3.3 光谱微分差信息熵

信息论之父Shannon29借鉴热力学熵的概念,提出“信息熵”解决信息的量化度量问题。信息熵可定义为离散随机事件发生的概率,可理解为消除不确定性所需信息量的度量,即未知事件可能含有的信息量,需要引入消除不确定性的信息量越多,则信息熵越高,反之则越低;也可作为一个系统复杂程度的度量,系统越复杂,出现不同情况的种类越多,则信息熵越高,反之则越低。本研究引入信息熵的思想衡量与评价冬小麦受涝渍胁迫影响的程度以及光谱由此产生的弱畸变,依据信息熵定义,构建光谱微分差信息熵,胁迫程度越大,光谱差异越大,其所对应的光谱微分差信息熵值就越大30,计算公式如下18
E S D D i = - j = 1 n p i j l o g p i j
p i j = ( S D i j - S D ' ) 2 / j = 1 n ( S D i j - S D ' ) 2
其中, i对应6种涝渍胁迫下光谱; j为某一波段范围内波段数; S D i j为涝渍胁迫下小麦一阶微分光谱值; S D '为正常小麦一阶微分光谱值。

3 结果与分析

叶片光谱数据采用手持叶片光谱探测器夹取冬小麦叶片中间部位量测得到,未受背景信息的影响,而冠层高光谱影像数据不仅包含冬小麦冠层高光谱数据,还包括土壤等背景信息。因此,本研究在对冠层高光谱影像数据进行辐射定标、几何校正等预处理后,基于随机森林算法对冠层高光谱影像数据进行批处理,其中每幅影像均被分为冬小麦、盆、草和土壤四部分,通过计算混淆矩阵,可以得到总体分类精度和kappa系数分别为95.86%和0.9438,精度较高。提取分类后冬小麦的冠层光谱数据,进行后续处理。

3.1 光谱特征分析

植被反射光谱与叶片内部结构、色素含量、含水率等密切相关。冬小麦受到涝渍胁迫后,生理特性会发生敏感变化,从而引起叶片及冠层光谱反射率的改变。
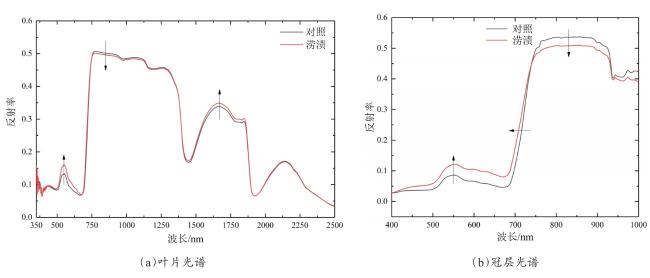
涝渍胁迫是土壤水分长期影响植被生长发育所导致的一种慢性灾害现象,且具有滞后性,因此很难在遭受涝渍胁迫的拔节期就识别出涝渍胁迫冬小麦。为尽早识别冬小麦涝渍胁迫,分析遭受胁迫后第一个生育期冬小麦光谱反射率的变化,即对抽穗期对照及涝渍胁迫(包括所有渍水及淹水处理)后冬小麦叶片及冠层光谱反射率分别取平均,得到光谱特征对比结果(图2),其中冬小麦叶片光谱数据对照及涝渍胁迫样本数分别为60和360,冠层光谱数据对照及涝渍胁迫样本数分别为15和90。
图2 冬小麦涝渍胁迫光谱特征对比结果(抽穗期)

Fig. 2 Spectral features of winter wheat under waterlogging stress (heading stage)

图2可知,冬小麦在涝渍胁迫后,与对照冬小麦叶片的光谱曲线在红光吸收谷(RW:640~680 nm),红边(RE:670~737 nm),近红外(NIR:750~900 nm),1428~1456 nm波段和 1650~1800 nm波段出现较明显变化。冬小麦在涝渍胁迫下,受叶片中色素含量的影响,绿峰(550 nm)附近吸收减弱,绿峰有抬升的趋势;涝渍胁迫导致叶片光合作用能力下降,NDVI指数降低,即在RW波段偏高,NIR波段降低;受叶绿素和氮素等影响31,32,RE波段范围内,光谱有蓝移或向短波方向移动的现象。涝渍胁迫会延缓冬小麦根系生长,降低根系导水率,引起叶片水分亏缺,导致叶片水势降低,1428~1456 nm波段可体现叶片水势;1650~1800 nm位于大气吸收波段,难以获得高质量的野外数据,本节不再赘述。冠层光谱曲线变化趋势和叶片光谱基本相同,但差异更为明显,这可能由于涝渍胁迫不仅对冬小麦叶片生理特性造成影响,还影响了作物冠层的形状结构等。

3.2 涝渍胁迫识别分析

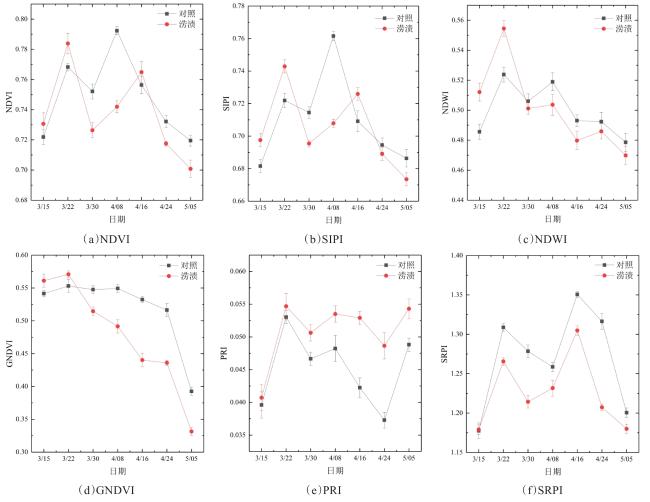
为有效综合各有关光谱信号,增强植被信息,减少非植被信息,选取NDVI、SIPI、NDWI、GNDVI、PRI和SRPI六个植被指数对拔节期及之后全生育期的冬小麦叶片光谱进行处理分析,以识别涝渍胁迫下的冬小麦。由图3可知,在整个生育期,正常与涝渍胁迫冬小麦的NDVI和SIPI没有恒定规律,因此上述2个指数无法准确识别出涝渍胁迫下的冬小麦;GNDVI和NDWI在拔节期后的生育期可识别涝渍胁迫后的冬小麦,但上述2个指数在胁迫前就具有差异性,在识别涝渍胁迫冬小麦时具有系统性误差,从而导致其无法在胁迫初期准确区分正常及涝渍胁迫的冬小麦;PRI和SRPI可以在整个生育期内识别出涝渍胁迫下的冬小麦。综上,PRI和SRPI更适合用来识别涝渍胁迫的冬小麦。
图3 不同植被指数识别正常与涝渍胁迫冬小麦

Fig. 3 Different indices to identify control and waterlogging winter wheat

为选取可识别涝渍胁迫的最优指数,基于公式(7)计算对照与涝渍样本植被指数之间的归一化均值距离,并进行对比分析,来判断其识别能力的优劣,结果见表2
表2 PRI和SRPI的归一化均值距离列表

Table 2 List of normalized mean distances of PRI and SRPI

生育期 日期 PRI SRPI
拔节期 3/15 0.28 0.11
拔节期 3/22 0.55 4.59
拔节期 3/30 1.76 4.01
抽穗期 4/08 1.62 1.68
开花期 4/16 4.26 4.58
灌浆期 4/24 3.55 7.79
成熟期 5/05 2.19 1.70
表2可见,在涝渍胁迫前(2019年3月15日),正常与涝渍胁迫冬小麦SRPI之间的归一化均值距离是0.11,PRI的是0.28,其值较小,说明正常与渍害胁迫冬小麦的可分性较弱,这也与图3所示一致。之后,除成熟期5月5日外,正常与胁迫冬小麦SRPI之间的距离均大于PRI,这可能由于成熟期冬小麦叶片开始衰老,萎蔫变黄,其他影响因素较多所致。因此,SRPI区分正常及涝渍胁迫冬小麦的能力比PRI强,且具有较强的敏感性及稳定性。

3.3 胁迫程度判别分析

不同程度涝渍胁迫下冬小麦叶片光谱差异较小,难以对涝渍胁迫程度进行预测和区分。因此本节采用不同胁迫程度冠层光谱数据,基于前人研究31-33和以上结果,选取以下波段范围进行分析:红光吸收谷(RW:640~680 nm)、红边(RE:670~737 nm)和近红外区(NIR:750~900 nm),结合光谱微分差信息熵方法,对涝渍胁迫下的冬小麦进行胁迫程度判别分析。
结合3.1和3.2的分析,可知冬小麦于拔节期遭受涝渍胁迫后,抽穗、开花及灌浆期是识别涝渍冬小麦的最佳生育期,拔节期差异不明显可能是由于涝渍胁迫对植被的影响具有滞后性,成熟期冬小麦叶片开始衰老,萎蔫变黄,其他影响因素较多。因此对这3个生育期冬小麦的冠层光谱数据进行微分处理,获取对照和不同涝渍胁迫程度下冬小麦一阶微分光谱数据,计算RW、RE和NIR波段范围内涝渍胁迫与对照组冬小麦光谱微分之差(图4),并基于公式(8)公式(9)计算RW、RE和NIR波段范围内的光谱微分差信息熵,结果如表3所示。
图4 RW、RE和NIR波段冬小麦光谱微分差

Fig. 4 The spectral derivative difference of winter wheat in RW, RE and NIR region

表3 RW、RE和NIR波段冬小麦光谱微分差信息熵

Table 3 The spectral derivative difference entropy of winter wheat in RW, RE and NIR region

波段范围 CK ML5d ML10d ML15d SL5d SL10d SL15d
RW 0 0.677 0.703 0.756 0.708 0.880 1.023
RE 0 1.161 1.212 1.165 1.234 1.093 1.092
NIR 0 1.298 1.175 1.215 1.300 1.232 1.213
土壤相对含水量相同时,涝渍胁迫程度随处理天数的增加而增大;处理天数相同时,胁迫程度随土壤相对含水量的增加而增大。即胁迫程度:ML5 d < ML10 d < ML15 d,SL5 d < SL10 d < SL15 d;ML5 d< SL5 d,ML10 d < SL10 d,ML15 d < SL15 d。在对冬小麦冠层光谱进行微分后,背景信息对原始光谱信号的影响被减弱,通过计算不同涝渍处理下的光谱微分差,可进一步减少光谱噪声的影响,增强不同涝渍胁迫程度间的光谱差异。由图4可知,红光吸收谷(RW:640~680 nm),红边(RE:670~737 nm)和近红外(NIR:750~900 nm)波段冬小麦光谱微分差已有较明显差异。引入信息熵来衡量这种差异性,由表3可得,在RW波段范围内,涝渍胁迫程度越大,其对应的光谱微分差信息熵越大,从ML5 d的0.677增大到SL15 d的1.023,基本呈现CK < ML5 d < ML10 d < SL5 d < ML15 d < SL10 d < SL15 d的规律;而在RE和NIR波段范围内,光谱微分差信息熵变化没有任何规律。因此红光吸收谷(RW:640~680 nm)波段光谱微分差信息熵可作为识别冬小麦受涝渍胁迫的指标,这一波段范围内光谱微分差信息熵越大,表示冬小麦涝渍胁迫程度越大。

4 讨 论

本研究通过设置冬小麦涝渍胁迫梯度盆栽试验,期望找到识别涝渍胁迫及判别胁迫程度的相应指标和方法。分析冬小麦光谱变化特征,结合植被指数、归一化均值距离和光谱微分差信息熵,识别涝渍胁迫并判别胁迫程度。
分析冬小麦的光谱变化特征,涝渍胁迫冬小麦的光谱响应特征在RW、RE、NIR和1650~1800 nm波段发生较明显变化。可能由于这几个波段对影响光谱响应特征的生理参数敏感,如色素、营养素、干物质含量、叶片内部结构、叶水势等。采用表1所示六个植被指数,对冬小麦拔节期及之后全生育期的冬小麦叶片光谱进行处理分析,得出SRPI是识别涝渍胁迫冬小麦的最优植被指数,该植被指数的优异表现可能来自于其对叶黄素循环色素的环氧化状态和光合效率极敏感34, 35。在RW波段内,抽穗、开花和灌浆期的光谱微分差信息熵可判别冬小麦涝渍胁迫程度,胁迫程度越大,光谱微分差信息熵越大。前人研究表明,RW波段对色素含量更为敏感36, 37,而光谱微分差信息熵可减少光谱噪声及背景的影响。
由于各品种冬小麦对涝渍胁迫的响应特征基本一致,且本研究主要目的为找出冬小麦涝渍胁迫识别指数与胁迫程度判别指标 ,因此未对小麦品种间的差异性进行讨论。

5 结 论

本研究设置涝渍胁迫梯度盆栽试验,通过分析冬小麦光谱变化特征,得出SRPI是识别涝渍胁迫的最优植被指数,在红光吸收谷波段范围内,可以采用光谱微分差信息熵作为识别冬小麦涝渍胁迫程度的指标。
本研究结果可对涝渍胁迫精确防控提供理论意义和实践应用价值,可为其他环境胁迫监测研究提供参考。本研究尚存不足之处,如盆栽试验与田间实际环境存在差别、缺少独立的试验验证等,后续研究可以增加盆栽及田间试验,结合交叉验证等,进一步验证本研究方法识别涝渍胁迫及判别胁迫程度的可行性。
1
NGUYEN L T T, OSANAI Y, LAI K, et al. Responses of the soil microbial community to nitrogen fertilizer regimes and historical exposure to extreme weather events: Flooding or prolonged-drought[J]. Soil Biology and Biochemistry, 2018, 118: 227-236.

2
刘美玲, 刘湘南, 曹仕, 等. 基于高光谱高频组份分形特征的水稻铅胁迫评估[J]. 遥感学报, 2011, 15(4): 811-830.

LIU M, LIU X, CAO S, et al. Assessment of Pb-induced stress levels on rice based on fractal characteristic of spectral high-frequency components[J]. Journal of Remote Sensing, 2011, 15(4): 811-830.

3
ZHANG B, LIU X, LIU M, et al. Thermal infrared imaging of the variability of canopy-air temperature difference distribution for heavy metal stress levels discrimination in rice[J]. Journal of Applied Remote Sensing, 2017, 11(2): ID 026036.

4
LI X, LI L, LIU X. Collaborative inversion heavy metal stress in rice by using two-dimensional spectral feature space based on HJ-1 A HSI and radarsat-2 SAR remote sensing data[J]. International Journal of Applied Earth Observation & Geoinformation, 2019, 78: 39-52.

5
杨兴川, 罗红霞, 赵文吉, 等. 植被叶片光谱特征对烟煤病胁迫程度的响应模型研究[J]. 光谱学与光谱分析, 2017, 37(9): 2873-2878.

YANG X, LUO H, ZHAO W, et al. Study on the response model of spectral signatures of vegetation leaves on the stress level for sooty mould[J]. Spectroscopy and Spectral Analysis, 2017, 37(9): 2873-2878.

6
STEFAN T, JAN B, ANGELINA S, et al. Quantitative assessment of disease severity and rating of barley cultivars based on hyperspectral imaging in a non-invasive, automated phenotyping platform[J]. Plant Methods, 2018, 14(1): ID 45.

7
GUI J, FEI J, WU Z, et al. Grading method of soybean mosaic disease based on hyperspectral imaging technology[J/OL]. Information Processing in Agriculture, 2020.

8
王慧芳, 王纪华, 董莹莹, 等. 冬小麦冻害胁迫高光谱分析与冻害严重度反演[J]. 光谱学与光谱分析, 2014, 34(5): 1357-1361.

WANG H, WANG J, DONG Y, et al. Monitoring freeze stress levels on winter wheat from hyperspectral reflectance data using principal component analysis[J]. Spectroscopy and Spectral Analysis, 2014, 34(5): 1357-1361.

9
LIANG L, XIANG L, QIN S, et al. Diagnosis the dust stress of wheat leaves with hyperspectral indices and random forest algorithm[C]// IEEE International Geoscience and Remote Sensing Symposium. Piscataway, New York, USA: IEEE, 2016.

10
ZHANG F, ZHOU G. Estimation of canopy water content by means of hyperspectral indices based on drought stress gradient experiments of maize in the north plain China[J]. Remote Sensing, 2015, 7(11): 15203-15223.

11
MIGUEL L, BELÉN D, LOURDES L, et al. Hyperspectral imaging to evaluate the effect of irrigation water salinity in lettuce[J]. Applied Sciences, 2016, 6(12): ID 412.

12
杨菲菲, 李世娟, 刘升平, 等. 作物环境胁迫高光谱遥感监测研究进展[J]. 中国农业科技导报, 2020, 22(4): 85-93.

YANG F, LI S, LIU S, et al. Research progress on hyperspectral remote sensing monitoring of crop environmental stress[J]. Journal of Agricultural Science and Technology, 2020, 22(4): 85-93.

13
熊勤学, 王晓玲, 王有宁. 小麦渍害光谱特征分析[J]. 光谱学与光谱分析, 2016, 36(8): 2558-2561.

XIONG Q, WANG X, WANG Y. Spectral characteristics analysis of wheat damaged by subsurface waterlogging[J]. Spectroscopy and Spectral Analysis, 2016, 36(8): 2558-2561.

14
XIA J, CAO H, YANG Y, et al. Detection of waterlogging stress based on hyperspectral images of oilseed rape leaves (Brassica napus L.)[J]. Computers and Electronics in Agriculture, 2019, 159: 59-68.

15
ZHAO J, PAN F, LI Z, et al. Detection of cotton waterlogging stress based on hyperspectral images and convolutional neural network[J]. International Journal of Agricultural and Biological Engineering, 2021, 14(2): 167-174.

16
高小梅, 李燕丽, 卢碧林, 等. 基于高光谱和数字图像特征指数的受渍冬小麦SPAD估算[J]. 应用生态学报, 2021, 32(3): 959-966.

GAO X, LI Y, LU B, et al. Estimation of SPAD value in waterlogged winter wheat based on characteristic indices of hyperspectral and digital image[J]. Chinese Journal of Applied Ecology, 2021, 32(3): 959-966.

17
EMENGINI E, BLACKBURN A, THEOBALD J. Discrimination of plant stress caused by oil pollution and waterlogging using hyperspectral and thermal remote sensing[J]. Journal of Applied Remote Sensing, 2013, 7(4): 87-97.

18
郭辉, 杨可明, 张文文, 等. 铜铅离子胁迫下玉米污染程度的光谱识别[J]. 光谱学与光谱分析, 2018, 38(1): 212-217.

GUO H, YANG K, ZHANG W, et al. Spectra recognition of corn pollution degree under copper and lead ion stress[J]. Spectroscopy and Spectral Analysis, 2018, 38(1): 212-217.

19
蒋金豹, STEVEN D M, 何汝艳, 等. 水浸胁迫下植被高光谱遥感识别模型对比分析[J]. 光谱学与光谱分析, 2013, 33(11): 3106-3110.

JIANG J, STEVEN D M, HE R, et al. Comparison and analysis of hyperspectral remote sensing identifiable models for different vegetation under waterlogging stress[J]. Spectroscopy and Spectral Analysis, 2013, 33(11): 3106-3110.

20
SCHELL J A. Monitoring vegetation systems in the great plains with ERTS[J]. Nasa Special Publication, 1973, 351: 309.

21
黄文江, 王纪华, 刘良云, 等. 冬小麦品质的影响因素及高光谱遥感监测方法[J]. 遥感技术与应用, 2004(3): 143-148.

HUANG W, WANG J, LIU L, et al. Study on grain quality effecting factors and monitoring methods by using hyperspectral data in winter wheat[J]. Remote Sensing Technology and Application, 2004(3): 143-148.

22
MCFEETERS S. The use of the Normalized Difference Water Index (NDWI) in the delineation of open water features[J]. International Journal of Remote Sensing, 1996, 17(7): 1425-1432.

23
BARET F, GUYOT G. Potentials and limits of vegetation indices for LAI and APAR assessment[J]. Remote Sensing of Environment, 1991, 35(2-3): 161-173.

24
GAMON J, PEÑUELAS J, FIELD C. A narrow-waveband spectral index that tracks diurnal changes in photosynthetic efficiency[J]. Remote Sensing of Environment, 1992, 41(1): 35-44.

25
王仁红, 宋晓宇, 李振海, 等. 基于高光谱的冬小麦氮素营养指数估测[J]. 农业工程学报, 2014, 30(19): 191-198.

WANG R, SONG X, LI Z, et al. Estimation of winter wheat nitrogen nutrition index using hyperspectral remote sensing[J]. Transactions of the CSAE, 2014, 30(19): 191-198.

26
LU J, LIU F, LUO X. Selection of image features for steganalysis based on the Fisher criterion[J]. Digital Investigation, 2014, 11(1): 57-66.

27
王文全. 距离度量学习: 算法与应用[D]. 上海: 上海交通大学, 2018.

WANG W. Distance metric learning:Algorithm and application[D]. Shanghai: Shanghai Jiao Tong University, 2018.

28
童庆禧, 张兵, 郑兰芬. 高光谱遥感-原理、技术与应用[M]. 北京: 高等教育出版社, 2006.

TONG Q, ZHANG B, ZHENG L. Hyperspectral remote sensing: Principles, techniques, and applications[M]. Beijing: Higher Education Press, 2006.

29
SHANNON C. The bell system technical journal[J]. Journal of the Franklin Institute, 1938, 196(4): 519-520.

30
郭辉. 铜胁迫下玉米叶片污染弱信息提取与反演模型研究[D]. 北京: 中国矿业大学(北京), 2019.

GUO H. Study on extraction and inversion models of weak information in maize leaf polluted under copper stress[D]. Beijing: China University of Mining & Technology (Beijing), 2019.

31
RAMOELO A, SKIDMORE A, CHO M, et al. Regional estimation of savanna grass nitrogen using the red-edge band of the spaceborne RapidEye sensor[J]. International Journal of Applied Earth Observations & Geoinformation, 2012, 19: 151-162.

32
RAMOELO A, DZIKITI S, VAN D, et al. Potential to monitor plant stress using remote sensing tools[J]. Journal of Arid Environments, 2015, 113: 134-144.

33
LIU L, HUANG W, PU R, et al. Detection of internal leaf structure deterioration using a new spectral ratio index in the near-infrared shoulder region[J]. Journal of Integrative Agriculture, 2014, 13(4): 760-769.

34
SUÁREZ L, ZARCO-TEJADA P, GONZÁLEZ-DUGO V, et al. Detecting water stress effects on fruit quality in orchards with time-series PRI airborne imagery[J]. Remote Sensing of Environment, 2010, 114(2) : 286-298.

35
CALDERÓN R, NAVAS-CORTÉS J, LUCENA C, et al. High-resolution airborne hyperspectral and thermal imagery for early detection of verticillium wilt of olive using fluorescence, temperature and narrow-band spectral indices[J]. Remote Sensing of Environment, 2013, 139: 231-245.

36
张玮, 王鑫梅, 潘庆梅, 等. 干旱胁迫下雷竹叶片叶绿素的高光谱响应特征及含量估算[J]. 生态学报, 2018, 38(18): 322-329.

ZHANG W, WANG X, PAN Q, et al. Hyperspectral response characteristics and chlorophyll content estimation of phyllostachys violascens leaves under drought stress[J]. Acta Ecologica Sinica, 2018, 38(18): 322-329.

37
付彦博, 范燕敏, 盛建东, 等. 紫花苜蓿冠层反射光谱与叶片含水率关系研究[J]. 光谱学与光谱分析, 2013, 33(3): 766-769.

FU Y, FAN Y, SHENG J, et al. Study on relationship between alfalfa canopy spectral reflectance and leaf water content[J]. Spectroscopy and Spectral Analysis, 2013, 33(3): 766-769.

Outlines

/