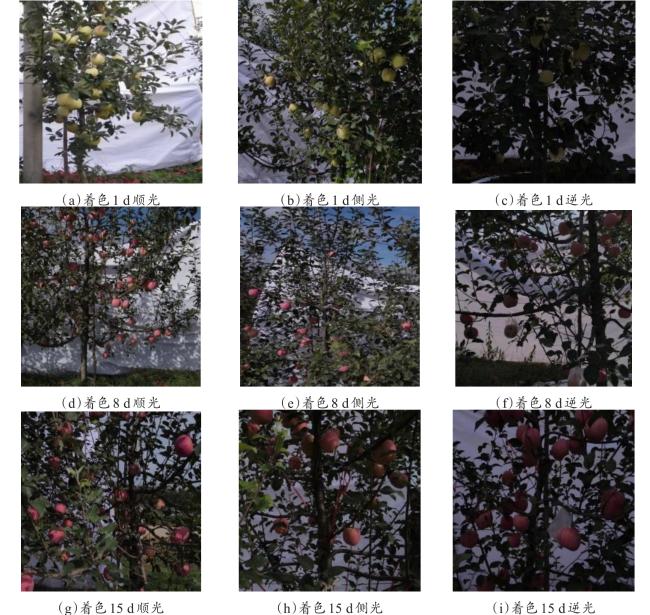
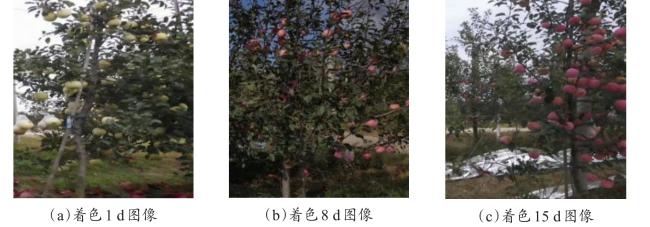
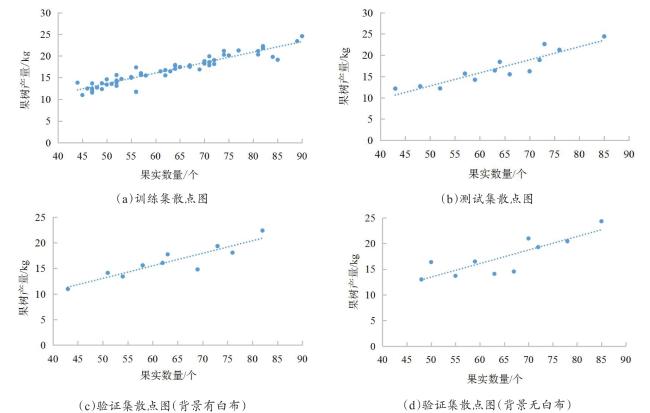
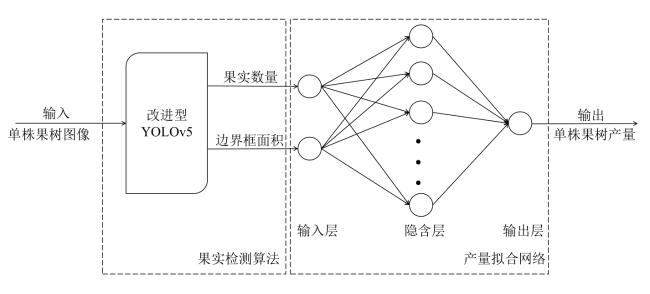
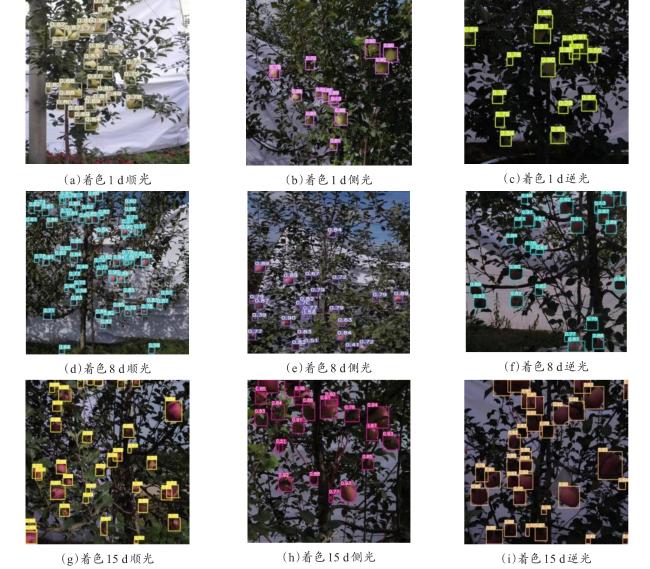
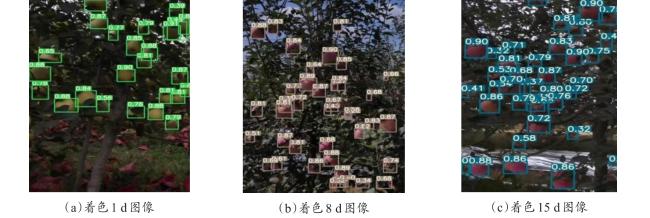
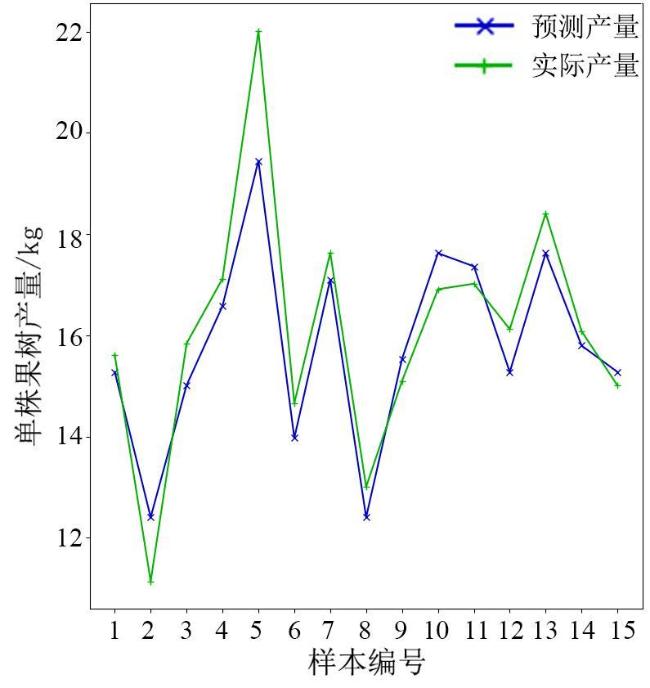
1 引 言
2 数据采集与处理
2.1 图像数据采集
2.2 图像数据预处理
2.2.1 数据清洗
2.2.2 数据集划分与标注
表1 样本数据集及数据量Table 1 Sample data-sets and data volume |
| 着色天数/d | 训练集 | 测试集1 | 测试集2 | |||||||
|---|---|---|---|---|---|---|---|---|---|---|
| 顺光子集 | 侧光子集 | 逆光子集 | ||||||||
| 图片数量/张 | 目标框数量/个 | 图片数量/张 | 顺光目标框数量/个 | 图片数量/张 | 侧光目标框数量/个 | 图片数量/张 | 逆光目标框数量/个 | 图片数量/张 | 目标框数量/个 | |
| 1 | 600 | 15,017 | 100 | 3282 | 100 | 3027 | 100 | 2963 | 100 | 3125 |
| 8 | 600 | 16,639 | 100 | 3155 | 100 | 3241 | 100 | 2834 | 100 | 3272 |
| 15 | 600 | 15,892 | 100 | 3268 | 100 | 3114 | 100 | 3052 | 100 | 3136 |
| 总计 | 1800 | 47,548 | 300 | 9705 | 300 | 9382 | 300 | 8849 | 300 | 9533 |
2.3 产量数据采集
3 苹果树测产模型
3.1 模型总体结构
3.2 改进型YOLOv5果实检测算法
3.2.1 基于轻量化改进的YOLOv5
3.2.2 损失函数计算
3.3 产量拟合网络
3.4 模型训练
4 算法测试与试验
4.1 果实检测算法性能分析
表2 改进前后算法检测速度的对比试验结果Table 2 Comparison experiment results of the detection speed of the algorithm before and after the improvement |
| 算法 | 检测速度及相对提升率 | YOLOv5s | YOLOv5m | YOLOv5l | YOLOv5x | |
|---|---|---|---|---|---|---|
| 改进前 | 检测速度/ms | 37.16 0.00 | 84.87 0.00 | 152.33 0.00 | 310.53 0.00 | |
| 相对提升率/% | ||||||
| 改进后 | 单独更换深度可分离卷积 | 检测速度/ms | 30.73 -17.28 | 70.85 -16.51 | 132.26 13.17 | 275.54 -11.26 |
| 相对提升率/% | ||||||
| 单独嵌入注意力机制模块 | 检测速度/ms | 37.83 1.80 | 87.24 2.79 | 155.87 2.32 | 318.66 2.61 | |
| 相对提升率/% | ||||||
| 融合深度可分离卷积和注意力机制模块 | 检测速度/ms | 31.44 -15.37 | 72.90 -14.10 | 136.28 -10.50 | 281.49 -9.35 | |
| 相对提升率/% | ||||||
表3 改进前后算法 对比试验结果 (%)Table 3 Comparison of experiment results of the original algorithm and the improved algorithm of the mAP |
| 算法 | 平均准确率及绝对提升率 | YOLOv5s | YOLOv5m | YOLOv5l | YOLOv5x | |
|---|---|---|---|---|---|---|
| 改进前 | 平均准确率 | 89.83 0.00 | 90.75 0.00 | 92.07 0.00 | 93.44 0.00 | |
| 绝对提升率 | ||||||
| 改进后 | 单独更换深度可分离卷积 | 平均准确率 | 88.94 -0.89 | 90.05 -0.70 | 91.55 -0.52 | 92.77 -0.67 |
| 绝对提升率 | ||||||
| 单独嵌入注意力机制模块 | 平均准确率 | 92.10 2.27 | 94.62 3.87 | 95.63 3.56 | 96.45 3.01 | |
| 绝对提升率 | ||||||
| 融合深度可分离卷积和注意力机制模块 | 平均准确率 | 92.88 3.05 | 93.99 3.24 | 95.15 3.08 | 96.27 2.83 | |
| 绝对提升率 | ||||||
表4 不同数据集的 对比试验结果 (%)Table 4 comparison results of different data sets |
| 模型 | 着色1 d数据集 | 着色8 d数据集 | 着色15 d数据集 | ||||||
|---|---|---|---|---|---|---|---|---|---|
| 顺光 | 侧光 | 逆光 | 顺光 | 侧光 | 逆光 | 顺光 | 侧光 | 逆光 | |
| 改进型YOLOv5 | 90.25 | 92.48 | 89.31 | 93.56 | 95.08 | 92.95 | 95.26 | 96.79 | 94.07 |
| YOLOv5 | 89.56 | 90.57 | 87.35 | 91.78 | 92.23 | 90.57 | 93.57 | 94.29 | 92.38 |
| YOLOv3 | 87.82 | 88.11 | 86.77 | 89.93 | 90.86 | 88.75 | 92.27 | 93.33 | 91.43 |
| SSD | 86.26 | 86.98 | 83.67 | 87.69 | 89.54 | 88.37 | 90.25 | 91.33 | 89.40 |
表5 背景无白布下的算法 对比试验结果 (%)Table 5 Comparison experimental results of the mAP of the algorithm under the condition of without white cloth in background |
| 数据集 | YOLOv5s | YOLOv5m | YOLOv5l | YOLOv5x |
|---|---|---|---|---|
| 着色1 d | 81.47 | 83.26 | 84.63 | 85.89 |
| 着色8 d | 83.54 | 86.72 | 87.39 | 88.17 |
| 着色15 d | 84.76 | 87.93 | 89.56 | 90.72 |
4.2 产量拟合网络性能分析
表6 BP估测模块的性能参数Table 6 The performances of BP yield measurement module |
| 参数 | 训练集 | 测试集 |
|---|---|---|
| 0.8979 | 0.8864 | |
| 0.7967 | 0.7982 | |
| /kg | 1.5317 | 1.4021 |
| /kg | 1.1259 | 1.0253 |
| /% | 6.3372 | 6.2524 |
4.3 测产模型测试
表7 背景有白布的测产模型相对误差Table 7 Relative error of yield measurement model with white cloth in background |
| 评价指标 | 第一组 | 第二组 | 第三组 | 第四组 | 第五组 | 第六组 | 第七组 | 第八组 | 第九组 | 第十组 |
|---|---|---|---|---|---|---|---|---|---|---|
| 相对误差 /% | 3.05 | 4.25 | -4.17 | 3.75 | -5.81 | 4.10 | -6.13 | -5.39 | 5.41 | 4.28 |
表8 背景无白布的测产模型相对误差Table 8 Relative error of yield measurement model without white cloth in background |
| 评价指标 | 第一组 | 第二组 | 第三组 | 第四组 | 第五组 | 第六组 | 第七组 | 第八组 | 第九组 | 第十组 |
|---|---|---|---|---|---|---|---|---|---|---|
| 相对误差 /% | -10.34 | 9.72 | 12.15 | 9.83 | 11.13 | -10.54 | -12.71 | 8.28 | 11.67 | -9.37 |


