


1 Introduction
Biomass is an important physical and chemical parameter in ecosystems and a significant index for assessing the life activities of vegetation and for monitoring growth and estimating crop yield[1]. Traditional biomass estimation methods are not only time-consuming and labor-intensive, but also can not conduct large-scale monitoring[2]. The rapid development of remote sensing technology in recent years has accelerated its wide application in crop biomass estimation, as it is fast, accurate, and non-destructive[1].
Based on the spectral features of vegetation, previous studies have obtained many achievements in using vegetation indices to estimate biomass. Jimenez-Sierra et al.[3] proposed GBF-Sm-Bs approach by obtaining biomass estimation correlation of 0.995 with R 2 = 0.991. This result increased the precision in the biomass estimation by about 62.43% compared to previous work. Hou et al.[4] built a biomass estimation model based on multiple vegetation indices, of which the index model of red edge location was used to estimate the wheat biomass model, R 2 were all greater than 0.8. Liu et al.[5] used arbor as an object to analyze the correlation between biomass and biomass factors, and constructed a highly accurate forest biomass estimation model using the partial least-squares method, the correlation coefficient between the predicted value and the measured value was 0.718, and the accuracy was 90.1%. However, the vegetation index is not sensitive to canopy biomass changes in high-density scenarios and deviates easily when inverting physical and chemical parameters or even agronomic parameters, thus affecting the accuracy of the estimation model[6]. In response, some scientists have added texture feature information to the spectral features to improve saturation when only spectral information is available, as well as to improve the spatial and temporal discrimination of image information and the estimation potential of agronomic parameters[7].
Some researchers have quantitatively analyzed the application of texture features in agronomic parameters. Gu et al.[8] studied vegetation coverage and found that the combination of vegetation indices and texture feature indices could improve the accuracy of vegetation coverage estimation. Sarker and Nichol[9] assessed the biomass of arbor forest and found that the combination of vegetation indices and texture features was better at biomass estimation. Cao et al.[10] extracted the texture features and spectral features of thematic mapper images and established a biomass regression estimation model, which could effectively estimate the biomass of mangrove wetlands. Mu et al.[11] constructed a multivariate regression model of vegetation indices, texture features, and vegetation biomass using four typical vegetation indices, and R 2 of the model was 0.713, the minimum RMSE was 98.2543 g/m2. Based on the above researches, it was found that the accuracy of the model for estimating biomass in combination with texture features was higher than the accuracy of the model for estimating biomass using a single vegetation index with color features[12].
In terms of monitoring crop growth based on unmanned aerial vehicle (UAV) images, Lee et al.[13] used RGB (Red Green Blue) cameras to obtain rice canopy images and found that the absolute value of green light depth (G) simulated by the exponential equation was well correlated with the aboveground biomass and leaf area index (LAI). Wang et al.[14] demonstrated that the G-R value of rice RGB images had a good relationship with biomass and LAI, which could be used to construct an estimation model. Wang et al.[15] used random forest-support vector regression (RF-SVR) model to estimate soil and plant analyzer development (SPAD) values of the wheat canopy and achieved high accuracy (R 2=0.754, RMSE=1.716). Yue et al.[16] combined UAV remote sensing and AquaCrop to estimate winter-wheat biomass, the predicted biomass agreed with the measured values (R 2=0.61, RMSE=2.10 t/ha). Shan et al.[17] used explored the vertical distribution of wheat biomass and found that a linear regression relationship could be better obtained with a single row of wheat images, and the estimation accuracy was also higher than multi-row wheat image.
In this study, UAVs were used to obtain RGB images of wheat in different growth periods, and simultaneous sampling was conducted in the field to determine wheat biomass. The best color and texture feature indices were determined through correlation analysis, and these indices were used to construct the estimation models of wheat biomass in different growth periods based on UAV platform in order to provide a new method for biomass estimation and real-time monitoring of wheat growth in the field.
2 Materials and methods
2.1 Field experiment design
Two experiments were conducted in this study, of which the data from Experiment 1 were used to construct a wheat biomass estimation model and the data from Experiment 2 were used for model validation. Study sites were located in Yizheng city and Zhangjiagang city, Jiangsu province.
2.1.1 Experiment 1 for estimation model
Experiment 1 was conducted in Yizheng from 2018 to 2019. Two wheat varieties of Yangmai23 and Yangfumai4 were selected as the research objects. Three planting densities were respectively set as: 1 million plants/ha, 1.5 million plants/ha, and 2 million plants/ha. Four nitrogen fertilizer levels were respectively set as: 0 kg/ha, 120 kg/ha, 160 kg/ha, and 200 kg/ha. Nitrogen fertilizers were applied according to the ratio of base fertilizer: new shoots boosting fertilizer: jointing fertilizer: booting fertilizer = 5:1:2:2, and the phosphorus and potassium fertilizers were applied according to the ratio of base fertilizer: jointing fertilizer =5:5, and the application amounts all were 120 kg/ha. Wheat was planted on November 2, 2016, with a plot area of 16.65 m2. Each treatment was repeated twice for a total of 48 experimental plots.
2.1.2 Experiment 2 for model validation
Experiment 2 was conducted in Zhangjiagang from 2017 to 2018. The wheat variety, density, and fertilizer were the same as Experiment 1. Wheat was planted on November 10, 2017, with a plot area of 30 m2. Each treatment was repeated twice for a total of 48 experimental plots.
2.2 Data acquisition method
2.2.1 Image acquisition device
The Inspire 1 RAW UAV (DJI, Shenzhen, China) was used for image data acquisition. This UAV is small, powerful, convenient and easy to operate, equipped with a 16-megapixel camera and is able to fly for 15-20 min depending on the load. The remote control was connected to the wireless follower to extend the control distance to 5 km.
2.2.2 Image acquisition
UAV image acquisition runs through the pre-wintering period, jointing period, booting period, and flowering period, and sampling time was about 8:00-10:00 AM or 3:00-5:00 PM. In this study, DJI GS Pro was used to automatically generate flight routes within the designated area, and automatic flight, automatic shooting, and complete relevant data receiving, processing and sending. The flight route of UAV was s-type, and the flight altitude was set to 15 m. In order to achieve accurate image registration, the image repetition rate was set to 60% on the main route and 70% between the main route during route and point planning. The standard calibration panels were used to perform radiation calibration on RGB band sensors during flight to minimize the influence of constantly changing lighting conditions on RGB images. After the aerial images were collected, the orthophoto image was generated by using the software Pix4DMapper, and the images were stitched together seamlessly through feature matching of adjacent images[18].
2.2.3 Determination of aboveground biomass
In the pre-wintering period, jointing period, booting period, and flowering period of wheat growth, 15 wheat plants were selected from each plot, the aboveground parts of plants were collected and transported back to the laboratory, and were dried in an oven for 1.5 h at 105 °C and then at 80 °C until constant weight, and then were weighed and converted to biomass per unit area.
2.3 Data analysis and utilization
2.3.1 UAV image preprocessing method
MATLAB2014a software was used for UAV image preprocessing, including image cropping, denoising, smoothing, and sharpening. Image cropping stitches the images into uniform images according to different cells. Denoising eliminates the noise in digital images. Smoothing and sharpening reduce the slope of the image, improve the image quality, and reduce the loss of pixel extraction from the target.
2.3.2 Color indices
Eight commonly used color indices were selected for UAV image data analysis, including visual atmospheric resistance vegetation index (VARI)[19], excess red vegetation index (ExR)[20], excess green vegetation index (ExG)[21], green leaf vegetation index (GLI)[22], excess green-red difference index (ExGR)[20], normalized difference index (NDI)[23], modified green red vegetation index (MGRVI)[24] and red green blue vegetation index (RGBVI) [24], as shown in Table 1 .
Table 1 Algorithms of color indices |
| Index | Abbreviation | Computational formula |
|---|---|---|
| Visible Atmospheric Resistance Vegetation Index | VARI | (1) |
| Excess Red Vegetation Index | ExR | ExR= (2) |
| Excess Green Vegetation Index | ExG | ExG= (3) |
| Green Leaf Vegetation Index | GLI | GLI= (4) |
| Excess Green-Red Difference Index | ExGR | ExGR =ExG ExR (5) |
| Normalized Difference Index | NDI | NDI= (6) |
| Modified Green Red Vegetation Index | MGRVI | MGRVI= (7) |
| Red Green Blue Vegetation Index | RGBVI | RGBVI= (8) |
2.3.3 Texture feature indices
Table 2 Algorithms of texture feature indices |
| Index | Abbreviation | Computational formula |
|---|---|---|
| Angular Second Moment | ASM | (9) |
| Contrast | CON | (10) |
| Correlation | COR | COR= (11) |
| Entropy | ENT | ENT= (12) |
2.4 Model construction and evaluation
Based on the correlation between image color and texture feature indices and wheat biomass, the color and texture feature indices with the largest correlation coefficient were selected to construct the regression model for biomass estimation (Experiment 1 data). Then the independently measured biomass data were used to validate and evaluate the model based on the coefficient of determination (R 2), root mean square error (RMSE), and 1:1 map (Experiment 2 data).
3 Results and analysis
3.1 Correlation between wheat biomass and image color/texture feature indices in different growth periods
Wheat biomass experiences various changes throughout the growth period and undergoes a process of continuous increase. In this study, the data in Experiment 1 were used to quantitatively analyze the correlation between eight color indices as well as four texture feature indices in the main growth periods of wheat and biomass to determine the optimal color index and texture feature index for estimating biomass. The correlation between the different color indices as well as the texture feature indices and wheat biomass based on the UAV image are shown in Table 3 and Table 4 .
Table 3 Correlations between different color indices and wheat biomass based on UAV image (n=24) |
| Growth stage | ExG | VDI | ExR | ExGR | VARI | GLI | MGRVI | RGBVI |
|---|---|---|---|---|---|---|---|---|
| Pre-wintering stage | 0.594** | 0.458* | -0.619** | 0.678** | 0.743** | 0.657** | 0.706** | 0.598** |
| Jointing stage | 0.813** | 0.823** | -0.824** | 0.911** | 0.817** | 0.809** | 0.687** | 0.625** |
| Booting stage | 0.493* | 0.793** | -0.779** | 0.607** | 0.734** | 0.483* | 0.817** | 0.351 |
| Flowering stage | 0.367 | 0.540** | -0.652** | 0.463* | 0.679** | 0.369 | 0.540** | 0.316 |
|
Table 4 Correlations between different texture feature indices and wheat biomass based on UAV image |
| Growth stage | ASM | CON | COR | ENT |
|---|---|---|---|---|
| Pre-wintering stage | 0.573** | 0.195 | -0.132 | -0.564** |
| Jointing stage | 0.271 | 0.511** | -0.574** | -0.072 |
| Booting stage | -0.200 | 0.417* | -0.351 | 0.260 |
| Flowering stage | -0.222 | 0.123 | -0.167 | 0.126 |
3.2 Biomass estimation models for wheat growth in different growth periods based on color indices
3.2.1 Model construction
(1) Estimation model of wheat biomass in the pre-wintering period
It can be seen from Table 1 that the correlation between the color indices of the UAV image and biomass was good during this period. Besides NDI, the correlation between the other seven indices and biomass was extremely significant (P<0.01), among which the correlation of VARI and biomass was the highest, with the correlation coefficient r reaching 0.743. Therefore, the color index VARI was chosen as the independent variable. The wheat biomass estimation model was constructed by using regression analysis:
B 1=535.9×VARI+87.9
where B 1 represents the biomass of wheat in the pre-winter period, kg/ha. The coefficient of determination R 2 was 0.553.
(2) Estimation model of wheat biomass in the jointing period
The correlation between the color indices and biomass of the UAV image in the jointing period was the highest, and eight color indices reached a highly significant correlation level. Among them, ExGR had the highest correlation with biomass, and the correlation coefficient r reached 0.911. Therefore, the color index ExGR was selected as the independent variable, and the wheat biomass estimation model is:
B 2=9054.6×ExGR+1915.5
where B 2 represents the biomass of wheat in the jointing period, kg/ha. It was constructed using regression analysis, with a coefficient of determination R 2 of 0.804.
(3) Estimation model of wheat biomass in the booting period
With the gradual advancement of wheat growth and the increasing biomass, the color of the UAV image will become saturated, and its correlation with biomass will be correspondingly weakened. The correlation between UAV image color indices and biomass in the booting period was significantly lower than that in the jointing period. Only six indices were significantly correlated. Among them, MGRVI had the highest correlation with biomass, and the correlation coefficient r was 0.817. Therefore, the color index MGRVI was chosen as the independent variable, and the wheat biomass estimation model is:
B 3=20024.1×MGRVI-543.2
where B 3 represents the biomass of wheat in the booting period, kg/ha. It was constructed using regression analysis, with an R 2 of 0.670.
(4) Estimation model of wheat biomass in the flowering period
The canopy image in the flowering period contains different types of objects such as the ear and leaf, and the correlation between image color indices and biomass is further reduced. During this period, the correlation between the UAV image color indices and biomass was the lowest among the four periods, three of which being non-significant, one being significantly correlated, and the other four reaching extremely significant levels, of which the correlation of VARI and biomass was the highest and the correlation coefficient r was 0.679. Therefore, the color index VARI was selected as the independent variable, and the wheat biomass estimation model is:
B 4=42623.1×VARI+7115.3
where B 4 represents the biomass of wheat in the flowering period, kg/ha. It was constructed using regression analysis, and the R 2 was 0.461.
3.2.2 Model validation
(1) Validation of the wheat biomass estimation model in the pre-wintering period
Independently measured data were used to validate the wheat biomass estimation model in the pre-wintering period and plot the 1:1 relationship between the measured values and the model predictions (Fig. 1(a) ). It is evident from the figure that there was high agreement between the predicted and measured values of wheat biomass in the pre-wintering period, and the predicted R 2 of the model was 0.538. Correlation analysis showed that the correlation between the predicted value and the measured value reached a highly significant level, indicating that the estimation model is feasible. In addition, the simulated RMSE was 27.88 kg/ha, which is relatively small, indicating that the simulation results of the model are relatively reliable.
(2) Validation of the wheat biomass estimation model in the jointing period
The validation results of the estimation model in the jointing period are shown in Figure 1(b) . The predicted value of wheat biomass in the jointing period was close to the measured value, and there was high consistency between the two. The predicted R 2 of the model was 0.631, and the effect was better than the pre-wintering period. Correlation analysis indicated that the correlation between the predicted value and the measured value reached a highly significant level, indicating that the estimation model is feasible. In addition, the simulated RMSE was 516.99 kg/ha, which is relatively small, indicating that the simulation results of the model are relatively reliable.
(3) Validation of the wheat biomass estimation model in the booting period
The results of the estimation model in the booting period are shown in Figure 1(c) . It can be seen from the figure that the predicted value of wheat biomass in the booting period was close to the measured value, and there was high consistency between the two. The predicted R 2 of the model was 0.708, and the effect was better than the jointing period. Correlation analysis indicated that the correlation between the predicted value and the measured value was significant, indicating that the estimation model is feasible. In addition, the simulated RMSE was 868.26 kg/ha, which is relatively small, indicating that the simulation results of the model are relatively reliable.
(4) Validation of the wheat biomass estimation model in the flowering period
The validation results of the estimation model in the flowering period are shown in Figure 1(d) . The predicted value of wheat biomass in the flowering period was close to the measured value, and there was a good agreement between the two. The model predicted an R2 of 0.464, and the effect was the poorest among the four periods. However, the correlation analysis demonstrated a correlation between the predicted value and the measured value, indicating that the estimation model is feasible. In addition, the simulated RMSE was 1539.81 kg/ha, which is relatively small, indicating that the simulation results of the model are relatively reliable.
In summary, the UAV image color indices could be used to estimate wheat biomass in different growth periods, and the effects in the different periods also differed. However, wheat biomass estimation using a single color index did not achieve the best results.

Fig. 1 Verification of wheat biomass estimation models based on color indices |
3.3 Wheat biomass estimation models in different growth periods based on color and texture feature indices
3.3.1 Model construction
(1) Estimation model of wheat biomass in the pre-wintering period
It can be seen from Table 4 that the correlation between UAV image texture indices and biomass in the pre-wintering period was high, however, it was poorer than the color indices. Among the four texture feature indices, two were not significantly correlated, whereas the other two were significantly correlated, of which ASM had the highest correlation with biomass, with a correlation coefficient of 0.573. Therefore, the texture feature index ASM was combined with the color index VARI, and the wheat biomass estimation multiple regression model is:
B 5=547.9×VARI-35.9×ASM+97.2
where B 5 represents the biomass of wheat in the pre-winter period combining VARI and ASM. The R 2 was 0.565, and the accuracy was slightly improved compared with the single color index model (2.17% increase).
(2) Estimation model of wheat biomass in the jointing period
From the pre-wintering period to the jointing period, the UAV image texture indices did not improve significantly. Among the four texture feature indices, only two had a significant correlation with biomass, with COR exhibiting the highest correlation with an r of 0.574 (Table 4 ). Therefore, the texture feature index COR was combined with the color index ExGR. The wheat biomass estimation multiple regression model is:
B 6=8762.5×ExGR-259.4×COR+2075.8
where B 6 represents the biomass of wheat in the jointing period combining ExGR and COR. The R 2 was 0.833, and the accuracy was improved compared with the single color index model (3.61% increase).
(3) Estimation model of wheat biomass in the booting period
The colors of the wheat UAV images in the booting period showed a certain saturation phenomenon, and the texture feature indices were also affected. Among the four texture feature indices, only CON was significantly correlated with biomass, with an r of 0.417 (Table 4 ). Therefore, the texture feature index CON was combined with the color index MGRVI, and the wheat biomass estimation multiple regression model is:
B 7=24027.4×MGRVI-3098.6×CON+2252.3
where B 7 represents the biomass of wheat in the booting period combining MGRVI and CON. The R 2 was 0.762, and the accuracy was significantly improved compared with the single color index model (13.73% increase).
(4) Estimation model of wheat biomass in the flowering period
The correlation between UAV image texture feature indices and wheat biomass in the flowering period was relatively low, and the correlation between the four feature indices and wheat biomass did not reach a significant level (Table 4 ). Therefore, the index ASM with the highest correlation coefficient was selected and combined with the color index VARI. The wheat biomass estimation multiple regression model is:
B 8=42654.9×VARI-5595.3×ASM+8507.9
where B 8 represents the biomass of wheat in the flowering period combining VARI and ASM. The R 2 was 0.485. The accuracy was much higher than the single color index model (5.21% increase).
3.3.2 Model validation
(1) Validation of the wheat biomass estimation model in the pre-wintering period
The independently measured data were used to validate the wheat biomass estimation model in the pre-wintering period, and the 1:1 relationship between the measured values and the model predictions was plotted (Figure 2(a) ). There was good agreement between the predicted value of wheat biomass and the measured value in the pre-wintering period. The predicted R 2 of the model was 0.571, which was better than the single color index model (6.13% increase). Correlation analysis showed that the correlation between the predicted value and the measured value was significant, indicating that the estimation model is feasible. In addition, the simulated RMSE was 25.49 kg/ha, which was smaller than the RMSE of the single color index model (reduced by 8.57%), indicating that the reliability of the model had been further improved.
(2) Validation of the wheat biomass estimation model in the jointing period
The validation results of the jointing estimation model are shown in Fig. 2(b) . It can be seen that the predicted value of wheat biomass in the jointing period was close to the measured value, and there was a good agreement between the two. The predicted R 2 of the model was 0.658, which is better than the pre-wintering period, and the prediction accuracy was improved compared to the single color index model (4.28% increase). Correlation analysis indicated that there was a correlation between the predicted value and the measured value, indicating that the estimation model is feasible. The simulated RMSE was 443.20 kg/ha, which was significantly smaller than the RMSE of the single color index model (14.27% decrease), indicating that the reliability of the model had been greatly improved.
(3) Validation of the wheat biomass estimation model in the booting period
The validation results of the booting period estimation model are shown in Fig. 2(c) . The predicted value of wheat biomass in the booting period was close to the measured value, and there was high consistency between the two. The model predicted an R 2 of 0.753, which was better than the jointing period, and the prediction accuracy was greatly improved compared to the single color index model (6.36% increase). Correlation analysis indicated that the correlation between the predicted value and the measured value was significant, indicating that the estimation model is feasible. In addition, the simulated RMSE was 816.25 kg/ha, which was smaller than the RMSE of the single color index model (5.99% decrease), indicating that the reliability of the model had been improved.
(4) Validation of the wheat biomass estimation model in the flowering period
The validation results of the flowering period estimation model are shown in Fig. 2(d) . The predicted value of wheat biomass in the booting period was close to the measured value, and there was a high agreement between the two. The predicted R 2 of the model was 0.515, and the prediction accuracy was improved compared to the single color index model (10.99% increase). Correlation analysis indicated that the correlation between the predicted value and the measured value was significant, indicating that the estimation model is feasible. In addition, the simulated RMSE was 1396.97 kg/ha, which was smaller than the RMSE of the single color index model (reduced by 9.28%), indicating that the reliability of the model had been improved.
Based on the above results, the biomass estimation model of wheat in different growth periods based on the combination of UAV image color and texture feature indices was significantly improved over the single color index model and can be used to estimate the biomass of wheat in different growth periods.
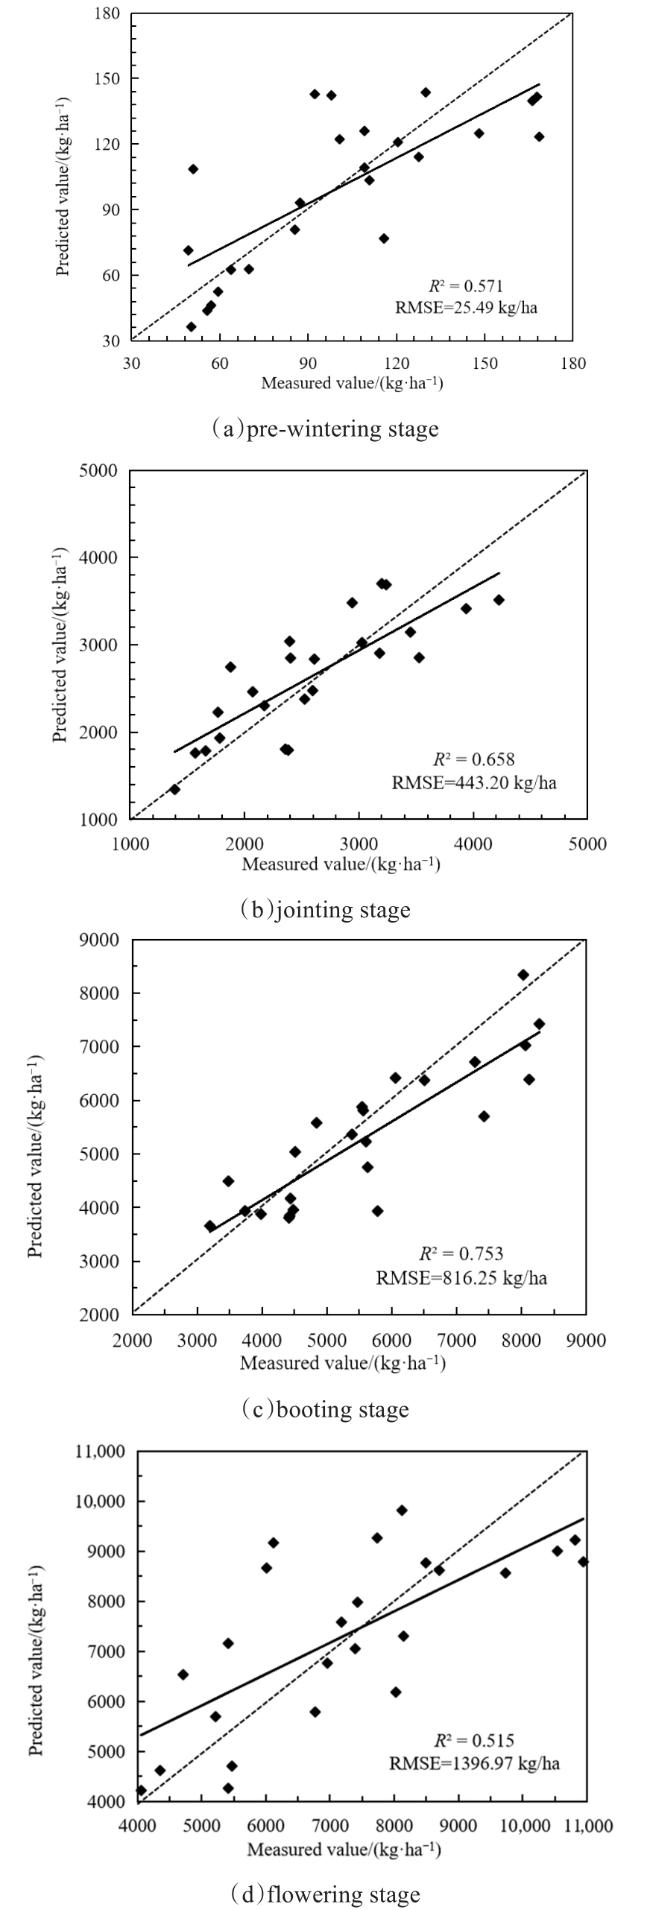
Fig. 2 Verification of wheat biomass estimation models based on color and texture feature indices |
4 Discussion
At present, few studies have monitored growth indices such as wheat biomass using the RGB image data of UAVs. Hunt et al.[26] obtained wheat canopy images using UAVs and used the vegetation indices NDVI and GNDVI to monitor wheat growth in order to validate the availability of UAV images in wheat growth monitoring. In this study, the RGB images collected in the four key growth periods of wheat were systematically analyzed. The image information was extracted, and eight common color indices and four texture feature indices were calculated. The best performing color index and texture feature index were selected using correlation analysis. The results showed that the biomass estimation model constructed using a single color index could reduce the estimation accuracy due to the saturation of the image in the late growth period of wheat. In order to solve the above problems, the UAV image color and texture feature indices were combined to establish a multivariate model of wheat biomass estimation based on two types of indices, and the model was tested using independently measured biomass data, achieving an overall better performance than a single color index model.
Other studies have combined image color indices with other indices to estimate crop yield or biomass. For example, Lu et al.[27] used UAV image data and point cloud data to estimate the aboveground biomass of wheat. Compared to the use of single color data, the model with combined indices improved the estimation accuracy, R 2 was 0.78, RMSE was 1.34 t/ha and rRMSE was 28.98%. Duan et al.[28] established a new method combining the vegetation indices based on UAV images and the abundance information obtained from spectral mixture analysis (SMA). The results showed that the vegetation index with abundance information exhibited better predictive ability for rice yield than the vegetation index alone with the coefficient of determination reaching 0.6 and estimation error below 10%. Zhou et al.[29] established wheat yield prediction model by using color and texture feature indices of RGB images at wheat booting and flowering stages, and the R 2 of the model increased by 2.15% and 3.69% compared with the single-color index model, respectively. The above results demonstrate that combining the color indices of UAV images with different indices, such as shape, texture, and coverage can improve the estimation effect of the model.
In addition, previous studies often only monitored the biomass in a certain growth period of the crop due to image availability or other constraints, and thus the results are difficult to extrapolate. In this study, UAV images of the four key growth periods of wheat were analyzed, and the dynamic monitoring model of wheat biomass based on the UAV platform was established. The model was tested using independently measured data, and the results were all reliable, indicating that it is feasible to dynamically monitor wheat biomass using a UAV platform equipped with a digital camera, which is suitable for small and medium area applications. However, in the future, UAVs will be equipped with more types of cameras. Therefore, in future research, information such as the spectrum, color, and texture of the image could be comprehensively used to improve the monitoring accuracy and range.
5 Conclusions
In this study, estimation models of wheat biomass at main growth stages were constructed based on the color and texture index of UAV images.
Firstly, the color index and texture feature index optimally correlated with wheat biomass were identified. Among the eight color indices, most of the correlations with wheat biomass were significant, and the correlation of VARI in the pre-wintering period was the highest at r = 0.743**. The correlation of ExGR in the jointing period was the highest at r = 0.911**. The correlation of MGRVI in the booting period was hight at r =0.817**, and the correlation of VARI in the flowering period was hight at r = 0.679**. The correlation between the four image texture feature indices and wheat biomass was poor, and only a few indices reached significant correlation levels.
Then, using the color indices of VARI, ExGR, MGRVI and VARI, the biomass estimation models of wheat in the pre-wintering, jointing, booting, and flowering periods were constructed, and the wheat biomass estimation multivariate models were constructed by combining the texture feature indices that with the highest correlation with wheat biomass.
Finally, the models were validated using independently measured biomass data. The results showed that both two types of estimation models passed the significance test, with the correlation reaching a significant level and the RMSE being small. The wheat biomass estimation model combined with the UAV image color and texture feature indices was better than the single color index model.


