


1 引 言
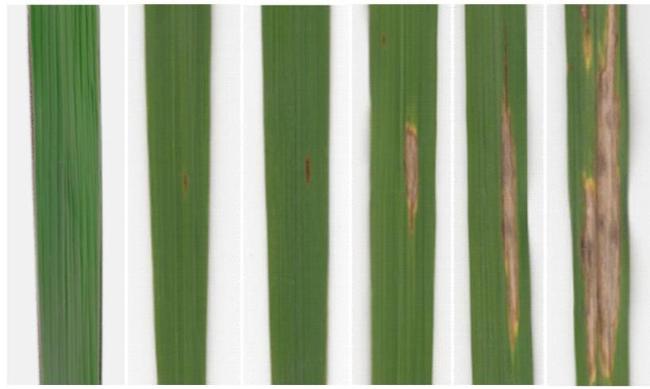
稻瘟病(Rice Leaf Blast,RLB)是目前水稻生产上最主要的病害之一,中国水稻五大产区2010—2020年稻瘟病的平均年发生面积在300万公顷以上,造成稻谷年损失数十万吨[1]。稻瘟病是由稻瘟杆菌(Magnaporthe oryzae)引起的一种真菌性病害,由于该病害具有高度传染性,在光照不足、高湿的条件下,大量的分生孢子通过风或水从水稻的病变部位在稻田中传播[2, 3]。在所有稻瘟病类型中,穗颈瘟对产量的影响最为严重,且已有研究证明引起穗颈瘟及穗瘟的孢子大多来源于叶片病变部位[4]。因此,在稻叶瘟发病早期对其进行准确监测与防治,能有效控制稻瘟病的扩散,并减少稻瘟病暴发和水稻减产的风险。
由于可通过风媒及水媒传播,稻瘟病大多从植株的中下部开始发病[7],因此叶位研究对提升稻瘟病早期监测精度有着较为重要的意义。前人研究表明,因处在不同环境和发育进程中,作物植株不同叶位的叶片具有不同的生理状态[8, 9]。现有研究多使用反射率光谱监测作物病害[10, 11],但反射率光谱主要揭示植物生化组分浓度信息,不能直接反映植物的光合生理状态。与反射率光谱相比,叶绿素荧光与植物的光合作用直接相关,能够更早、更敏感地探测出病害引起的生理变化[12]。植物叶绿素荧光的探测主要分为主动和被动两类。被动荧光探测是获取植被在自然光条件下发射的日光诱导叶绿素荧光(Solar-induced Chlorophyll Fluorescence,SIF)信号。相较于主动荧光技术[13],SIF能直接反映植物实际光合作用的动态变化,被认为是监测植被生理状态的直接探针,能够为植被病害胁迫的准确诊断提供更早期、更敏感的方法,适合在自然环境下对植被进行大面积的无损监测[14]。赵叶等[15]对比了不同发病状态下日光诱导叶绿素荧光、植被指数和微分光谱指数对小麦冠层条锈病病情严重度的敏感性,并构建了不同病情严重度下小麦条锈病的监测模型。闫菊梅等[16]利用归一化植被指数(Normalized Difference Vegetation Index,NDVI)和重归一化植被指数(Re-Normalized Vegetation Index,RDVI)处理后的日光诱导叶绿素荧光和光化学反射率指数(Photochemical reflectance index,PRI),构建出SISP(Synergistic Spectral Index of SIF and PRI)指数,提高了小麦冠层条锈病的遥感监测精度。但前人研究多基于冠层尺度反演的1~2个波段的荧光信息,使用SIF光谱对稻瘟病进行诊断的研究尚未见报道。
在光谱分析方法上,大部分研究使用SIF产量指数进行分析[17, 18],但该方法不能充分利用叶片SIF光谱中的细节信息。作为有效的信号处理工具之一,连续小波光谱分析可捕捉较弱的光谱信号,被逐渐应用于农作物生长参数和病害敏感波段提取中[19, 20]。使用连续小波方法提取稻叶瘟敏感SIF特征,可以充分挖掘部分作物生理生化参数的吸收特征,对于提升早期稻叶瘟监测精度和机理性具有重要意义。本研究拟基于不同叶位的SIF光谱,利用连续小波方法提取对稻叶瘟敏感的SIF特征,以实现稻瘟病的田间早期诊断。主要研究内容包括:(1)明确稻瘟病胁迫下水稻SIF光谱响应规律;(2)提取对稻叶瘟敏感的SIF特征,构建稻叶瘟识别模型;(3)对比不同叶位稻叶瘟识别模型的精度差异,明确其识别精度随叶位的变化规律。
2 材料与方法
2.1 试验设计
2.1.1 试验设置
于2021年7—8月水稻季进行了温室及田间试验。其中,温室试验具有环境条件可控、人工接种效果好、可对受害植株进行连续监测等优点;而大田试验则具有植株生长状况更贴近于实际生产、各等级发病叶片均可获取等优点。前人研究表明[21],水稻在拔节期和抽穗初期最易发生稻瘟病。但由于温室和田间试验条件的限制,未能在两种条件下均获取两个生育期的数据。本研究的具体试验设置如下:
温室桶栽试验在江苏省南京市南京农业大学卫岗校区智能温室(118°50'E,32°2'N)进行。试验共使用3个江苏省水稻生产常见粳稻品种,其中,扬农稻1号为稻瘟病高感品种,南粳5055、南粳9108为常规品种。育秧后,将3个水稻品种移栽至塑料桶中(直径35 cm,高32 cm,容积约为28 L),每桶种植3—4棵苗,每个品种12桶(接种组和对照组各6桶),共72桶。温室试验采用的配管措施与大田种植一致,移栽后3天施用尿素(300 kg/hm2)和复合肥(150 kg/hm2)作为基肥,在桶中维持薄水以确保土壤湿度。每桶水稻选择2个健壮分蘖,对每个分蘖上的顶1至顶4叶进行挂牌,对挂牌的叶片进行连续的光谱测试。于拔节期在温室中共获取到77株有效样本,如表1所示。
表1 温室及大田试验设置和样本数Table 1 Sets of greenhouse and field experiments and samples |
| 地点 | 类型 | 生育期 | 叶位 | 样本数/个 | ||||||
|---|---|---|---|---|---|---|---|---|---|---|
| 0级 | 1级 | 2级 | 3级 | 4级 | 5级 | 总计 | ||||
| 南京 (121°5'E,32°7'N) | 温室桶栽试验 | 拔节期 | L1 | 50 | 6 | 12 | 8 | 1 | 0 | 77 |
| L2 | 28 | 8 | 5 | 34 | 1 | 1 | 77 | |||
| L3 | 27 | 8 | 6 | 30 | 6 | 0 | 77 | |||
| L4 | 15 | 16 | 14 | 27 | 4 | 1 | 77 | |||
| 总计 | 120 | 38 | 37 | 99 | 12 | 2 | 308 | |||
| 南通 (121°5'E,32°7'N) | 田间试验 | 抽穗期 | L1 | 43 | 9 | 10 | 4 | 0 | 0 | 66 |
| L2 | 32 | 12 | 14 | 8 | 0 | 0 | 66 | |||
| L3 | 18 | 24 | 13 | 11 | 0 | 0 | 66 | |||
| L4 | 20 | 16 | 13 | 13 | 2 | 2 | 66 | |||
| 总计 | 113 | 61 | 50 | 36 | 2 | 2 | 264 | |||
|
大田试验在江苏省南通市通州区墩塘村家庭农场(121°5'E,32°7'N)进行,该地种植的水稻品种为扬农稻1号。于抽穗期在感病稻田中选取健康及感病水稻植株,同样对植株的顶1至顶4叶进行光谱测试,共获取到66株有效样本,如表1所示。
2.1.2 人工接种与病情严重度定义
于分蘖期对温室内的接种组桶栽进行稻瘟病接种处理,接种使用的菌液由南京农业大学作物遗传与种质创新国家重点实验室提供,共包括4个不同小种的稻瘟杆菌。向接种组水稻均匀喷洒浓度为0.09 mg/mL的孢子溶液,并向对照组喷洒等量清水,接种后立即用黑色不透光的塑料垫遮盖水稻植株。智能温室由两层透明材料组成,并配有空调和遮阳设施,可以为人工接种的稻瘟杆菌病原菌提供适宜的环境条件。在温度26~32℃、相对湿度超过90%、无光照条件下处理48 h后揭开塑料垫。
表2 叶片病情等级划分标准Table 2 Criteria for classification of rice leaf blast |
| 病情等级 | 叶片表征 |
|---|---|
| 0级 | 健康 |
| 1级 | 无病斑或有少数针孔状病斑 |
| 2级 | 叶内有少量小病斑(病斑数<5,长度不足叶宽1/2) |
| 3级 | 小病斑较多,或者有少量大病斑 |
| 4级 | 较多大病斑 |
| 5级 | 病斑造成了叶片功能性死亡 |
2.2 数据获取
2.2.1 实验仪器
本研究使用Spectralon反射标准(ODM-98,Gigahertz-Optik GmbH,Türkenfeld,Germany)测量入射的太阳辐射。使用的FluoWat叶片夹(Producción Por Mecanizados Villanueva S.L.U,Spain)上的光纤可以垂直定位到叶片的上下表面,当叶片被夹入叶片夹中时,操作者可以手动将入射光定位到相对于叶表面45°方向的叶片夹开孔处以测量SIF光谱。波长大于650 nm的入射光将被叶片夹开孔处设置的一个高性能低通滤波片切断,叶片发射的上行和下行SIF可以在水稻叶片上下表面的相同位置被分别测量。FluoWat叶片夹的测量原理如图2(a)所示。

光谱测试使用FieldSpec4高光谱地物仪(Analytical Spectral Devices Inc.,USA)、FluoWat叶片夹及HLG-150型系列卤素灯光源(中国擎轩科技有限公司,中国)来测量叶片的叶绿素荧光光谱(图2(b))。ASD(Analytical Spectral Devices)高光谱仪的波段范围为350~2500 nm,其中350~1000 nm光谱采样间隔为1.4 nm,光谱分辨率为3 nm;1000~2500 nm光谱釆样间隔为2 nm,光谱分辨率为10 nm。使用一根光纤(1.5 m)将FieldSpec4 Pro高光谱地物仪(FOV = 25°)与FluoWat叶片夹相连来捕捉从目标反射的光线。
2.2.2 SIF光谱采集
温室和大田试验中,每10株SIF光谱测量后进行一次白板校正及ASD优化。每个水稻植株取顶1~4叶进行光谱采集,每片水稻叶分别测量距叶基处1/3、1/2、2/3部位的上行和下行荧光,测试位点均避开叶片的主叶脉,每个测试位点获取3条重复的光谱。从同一叶片上收集的9条上行和下行SIF光谱分别取平均值,作为该叶片的上行和下行SIF值,可有效减少测试过程中的随机误差。
2.3 数据分析
2.3.1 连续小波光谱分析
植被SIF光谱分析以连续小波变换(Continue Wavelet Transform,CWT)为内核,利用平移和缩放的母小波函数与SIF光谱进行卷积运算,得到各尺度下的小波系数[19],如公式(1) 和(2)所示。
其中,ψ(λ)为母小波函数;λ为反射光谱波段;a为缩放因子(即尺度);b为平移因子;WFa , b 为小波系数(又称小波特征,即缩放因子为a、平移因子为b时母小波函数与原始SIF值的相似度);ψa , b (λ)为平移缩放后的母小波函数;l 1和l 2为输入SIF光谱的起始及终止波段。
高斯二阶导函数又名Mexh(Mexican Hat)小波,因其波形与墨西哥帽类似而得名。高斯二阶导函数的波形与作物SIF光谱中反射谷和反射峰的形状相似,将其作为连续小波变换的母函数,能较好地挖掘各理化参数隐藏在光谱中的吸收特征。此外,使用高斯二阶导函数对光谱曲线进行变换,其处理效果等同于利用高斯函数对SIF光谱进行平滑后再计算二阶导数,起到去除部分噪声、平滑数据的作用[22-24]。因此,本研究采用高斯二阶导函数作为连续小波变换的母函数对叶片SIF光谱进行分析。图3展示了顶4叶健康样本上行SIF光谱(图3(a))、不同尺度下的小波系数(图3(b)),图3(c)中红色区域代表前1%对稻叶瘟敏感小波特征,本研究中所使用的尺度3、4、5、6(Scale3,Scale4,Scale5,Scale6)为缩放因子23、24、25、26的简写。
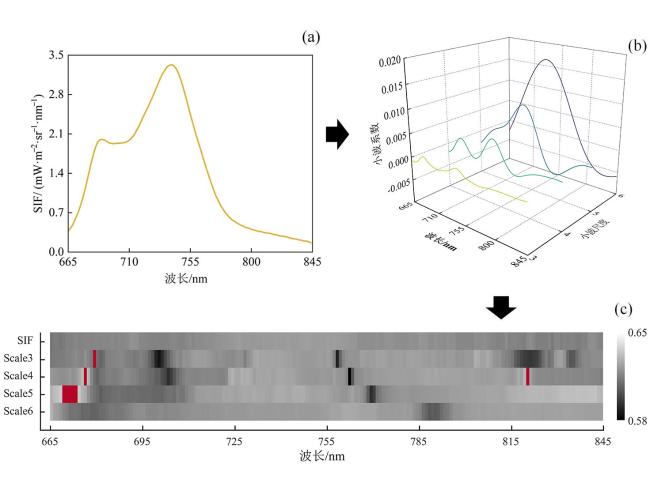
图3 顶4叶健康样本上行SIF光谱(a)不同尺度下的小波系数(b)及稻叶瘟敏感特征分布图(c) Fig. 3 Upward SIF spectrum (a) wavelet coefficient spectra at different scales (b), and classification scalogram for the identification of significant features related to rice leaf blast (c) of a healthy sample of the 4th leaf on the top |
2.3.2 建模与验证
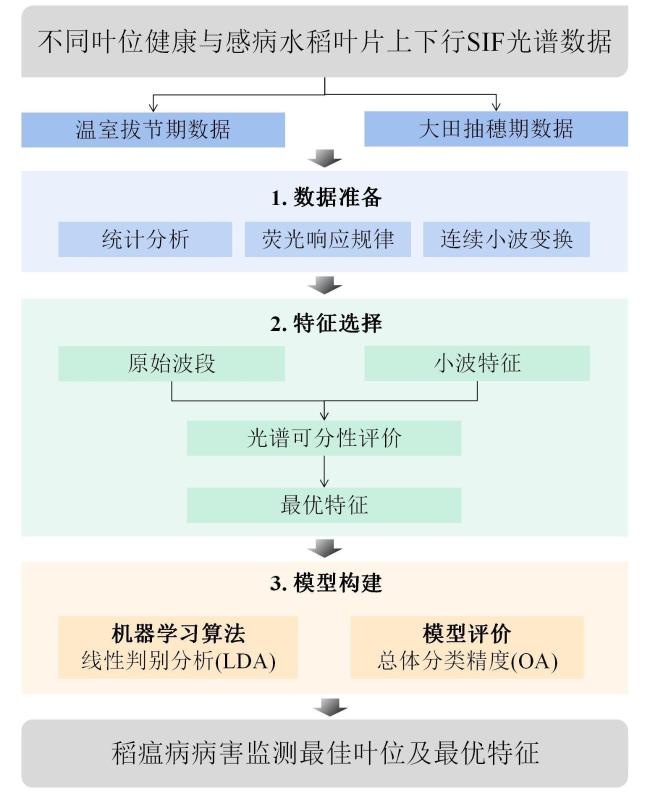
光谱特征基于特定阈值区分感病及健康叶片样本的能力称为可分性[20]。研究采用线性判别分析(Linear Discriminant Analysis,LDA)来评价SIF特征的可分性,并构建稻叶瘟识别模型[25, 26]。由于本研究拟实现稻瘟病的早期监测,所以使用0级样本作为健康数据集、1级和2级样本作为感病数据集进行后续分析。研究对SIF光谱、多尺度连续小波变换后的SIF小波系数进行了敏感特征筛选,对比了各叶位的最优特征、多叶位共性特征及冠层SIF监测常用特征(F760)[18]的感病叶片识别精度。分类模型均使用70%的样本进行建模、30%的样本进行验证。模型精度评价采用4折交叉验证法,并进行100次重复,其平均总体分类精度(Overall Accuracy,OA)作为最终评价指标。本研究的技术路线如图4所示。上述操作均在Python3.9语言环境下编程实现。
3 结果与分析
3.1 不同叶位健康叶片与感稻瘟病叶片的SIF光谱对比
图5展示了顶1至顶4叶健康和感病叶片上下行SIF光谱。各叶位叶片上行SIF均表现出双峰的特征,峰值位置位于红光区域的690 nm和远红光区域的740 nm附近,红光区域的峰值低于远红光区域;所有叶位下行SIF均表现出单峰的特征,峰值位于远红光区域的740 nm附近;对于某一特定叶位,叶片下行SIF的信号都弱于上行SIF。

由图5可得,各叶位感病叶片远红光区域的上行和下行SIF均显著高于健康叶片;但在红光区,顶2叶和顶4叶感病样本的SIF高于健康样本,而顶1叶和顶3叶感病和健康样本的SIF值基本一致。此外,随着叶位的下降,上行和下行SIF在红光区和远红光区皆呈上升趋势。
3.2 基于上下行SIF可分性的不同叶位稻瘟病敏感特征选择

由图6可知,不同叶位的敏感小波特征也存在差异。顶1叶的敏感特征主要集中在665~680 nm、755~790 nm及815~830 nm区域(图6(a)和图6(e));顶2叶敏感特征分布在665~680 nm及815~830 nm区域(图6(b)和图6(f));顶3叶敏感特征集中出现在690 nm、755~790 nm及815~830 nm区域(图6(c)和图6(g)),且只有顶3叶能观察到690 nm处的敏感条带;顶4叶的敏感特征则主要分布在665~680 nm、725及815~830 nm处(图6(d)和图6(h)),只有顶4叶存在725 nm处的敏感条带。由此可得,各叶位敏感特征大多位于SIF光谱的陡峭斜坡处,且主要分布在小波尺度3、4、5。

3.3 基于敏感SIF小波特征的稻瘟病识别
表3 基于上下行SIF及不同SIF特征的不同叶位健康和感病样本的总体分类精度Table 3 Overall classification accuracy of healthy and infected samples for different leaf positions based on upward and downward SIF and different SIF features |
| 方向 | 叶位 | 最优特征 | 共性特征 | 冠层监测 常用特征 | |||
|---|---|---|---|---|---|---|---|
| 特征 名称 | 总体分类精度/% | 特征 名称 | 总体分类精度/% | 特征名称 | 总体分类精度/% | ||
| 上行 | L1 | WF815,3 | 70.13 | WF832,3 | 69.45 | F760 | 69.79 |
| L2 | WF672,5 | 63.70 | 62.19 | 61.31 | |||
| L3 | WF819,3 | 64.63 | 60.35 | 54.41 | |||
| L4 | WF676,6 | 64.53 | 63.00 | 61.33 | |||
| 下行 | L1 | WF759,4 | 70.90 | WF809,3 | 69.98 | F760 | 69.99 |
| L2 | WF678,4 | 63.12 | 62.78 | 58.79 | |||
| L3 | WF758,3 | 62.00 | 60.51 | 54.62 | |||
| L4 | WF678,4 | 64.02 | 61.30 | 60.92 | |||
|
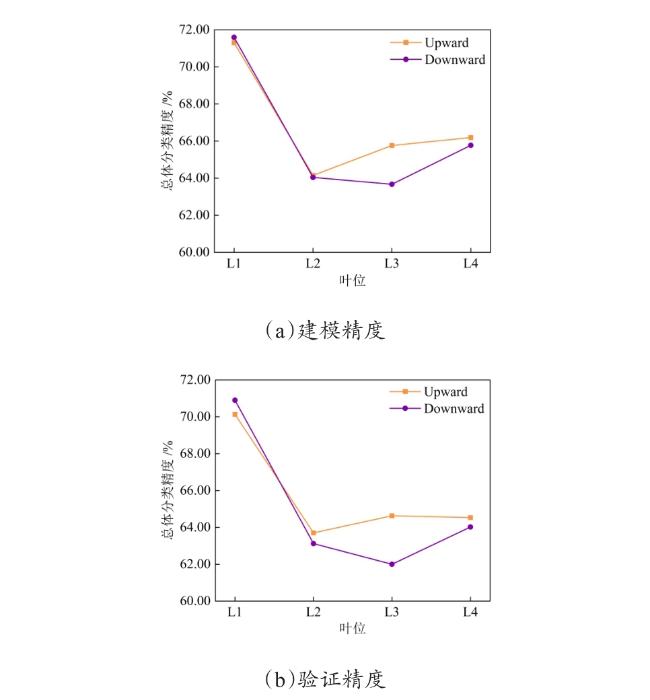
图9展示了基于最优特征、共性特征、冠层监测常用特征(F760)的不同叶位稻叶瘟监测模型精度。总体而言,从分类精度来看,最优特征>共性特征>F760;但顶1叶数据集三种特征的总体分类精度皆在70%左右,分类效果基本一致;而对于其他三个叶位,共性特征的模型验证精度略低于最优特征,F760的监测精度则显著低于最优特征及共性特征。

4 讨论与结论
4.1 连续小波光谱分析方法的优势
相较于原始SIF特征,敏感小波特征可有效提高感病叶片识别精度。连续小波光谱分析在应用于植被反射光谱分析时,可以将单个的光谱信号分解为不同尺度的小波系数,相比较传统的分析方法,能更有效地利用光谱区间信息及光谱的整体结构特征[27, 28]。本研究通过连续小波分析发现,上下行SIF小波系数的共同敏感区域665~680 nm处的小波特征,不仅具有生理意义,且与叶绿素吸收峰位置吻合,能合理地进行光谱学解释。此外,低尺度的SIF小波特征对稻叶瘟的识别精度更高。前人研究表明,低尺度小波系数主要包含原始光谱的高频信息,而高尺度小波系数主要包含原始光谱的低频信息,所以低尺度系数更能反映出光谱的噪声及微小的吸收特征,高尺度系数则更能反映原始光谱明显的吸收特征和叶片结构变化[29, 30]。本研究通过连续小波分析提取的共性特征↑WF832,3和↓WF809,3都分布在尺度3,表明在800~840 nm区域各个叶位的感病叶片可能存在相似的SIF波形特征,这可能与稻瘟杆菌对细胞结构的破坏有关。
4.2 SIF光谱响应机制解析
本研究结果显示,各叶位感病叶片远红光区域的上行和下行SIF均显著高于健康叶片。前人研究表明,影响植物SIF光谱的因素主要包括环境因子和植物生化参数两类[31]。本研究的试验在同一环境下进行,因此,引起各叶位感病及健康叶片光谱变化的主要因素为叶片结构及光合色素含量等植物生理生化参数。稻瘟杆菌病原体通过破坏植物叶片表皮细胞侵入叶肉组织,并逐渐刺破细胞壁打破细胞的屏障以实现菌丝在细胞间的扩散[20, 32]。这一侵染过程会破坏叶绿体结构,进一步导致水稻细胞质膜和线粒体等超微结构发生恶变,造成光系统受损,使光系统光化学活性受到抑制,进而导致PSII(Photosystem II,光系统II)反应中心向质体醌(Plastoquinone,PQ)的电子传递过程受到影响,光合作用的原初反应受到抑制,这可能是SIF光谱变化的主要原因之一。此外,前人研究表明,稻瘟杆菌的侵染也会导致叶片中叶绿素a含量下降,导致光吸收和传递效率降低[33, 34],可能是感病叶片SIF信号增强另一主要原因。
本研究还发现,顶1叶的病害监测能力显著高于其他三个叶位,且基于四个叶位所提取的最优特征均不相同,这可能是由监测时四个叶位叶片所处生理状态不同导致的。已有研究证明,水稻不同叶位的生理性能不同[9],作物冠层内的这种垂直异质性可以看作是群体内部一种不断调整叶间和叶内资源分配的适应策略,以最大限度地提高冠层光合速率,应对有限的营养资源和波动的环境条件[35, 36]。虽然稻瘟病易从水稻植株中下部开始发生,但部分顶3叶、顶4叶已经逐步进入衰老期,叶片衰老也会引起叶绿素含量减少及光合能力下降等生理变化[37]。因此,稻瘟病胁迫和衰老情况都可能导致中下部叶片的SIF光谱变化,从而影响SIF特征对该叶位感病叶片的识别精度。而顶1叶为水稻植株最上部的新展开叶,基本处于叶片伸长期,根据植物营养理论,营养会优先供应给生长点即果实和新叶。朱艳等[37]的研究也表明,小麦顶部叶片的叶绿素荧光参数与反射率光谱特征的相关性最高。所以,顶1叶SIF数据集可能受到植物其他理化参数的影响较小,能够较为直接地指示稻瘟病胁迫。此外,稻瘟病大多从植株的中下部开始发病是一个群体性、统计性的结论,本研究表1中的4个叶位感病样本也总体呈现了由顶4叶到顶1叶逐渐减少的规律。但是,水稻植株个体的发病具有随机性,仅凭某一片具体的顶1叶出现症状,还不能得出该植株的顶2-N叶已经发病的结论。

4.3 基于SIF光谱的稻叶瘟早期监测局限性及展望
虽然本研究提出的模型在早期稻叶瘟快速诊断方面取得了较好的效果,但仍存在部分局限性。本研究使用固定光强的主动光源模拟太阳光,但其光强与日光仍存在差异,导致所得的SIF强度和日光照射产生的SIF强度不完全相同,未来实验可进一步探究主动光源和日光诱导叶绿素荧光信号之间的强度关联,对主动光源照射产生的SIF光谱进行矫正。其次,在温室内使用FluoWat叶片夹进行光谱测试时,叶室内光强大于叶室外,导致被测样本产生的SIF经过一段时间才能达到稳态,对数据稳定性造成一定影响,未来可通过加大水稻盆栽摆放处光源光强等方法消除叶室内外的照度差异。
本研究基于连续小波光谱分析方法构建了叶片尺度的稻叶瘟识别模型,可为稻瘟病的田间早期、快速、原位诊断提供重要参考。由于两个生育期之间4个对应叶位样本所处的生长阶段接近,本研究未考虑生育期对不同叶位监测精度的影响。虽然生育期等因素会对叶片的光合能力产生影响,但由于感病样本数量所限,无法将生育期作为本研究的讨论重点,这可能是造成本研究模型分类精度有待进一步提高的重要原因。未来研究可获取更多易感生育期的样本,探究适用于水稻全生育期稻叶瘟早期监测的共性特征。此外,由于稻瘟病具有高度传染性,生产中需要对大面积田块进行快速、无损监测,所以下一步工作应重点研究叶片水平敏感特征升尺度到冠层水平的应用。但冠层SIF是从水稻冠层上行辐亮度和下行辐照度光谱反演而来[12],受环境及自身干扰较多,在尺度扩展的过程中,需考虑冠层结构及土壤背景等因素对光谱特征敏感性和稳定性的影响,着力构建合适的冠层结构消除方法和土壤背景消除方法。
4.4 结论
本研究基于不同叶位的SIF光谱,明确了稻瘟病胁迫下SIF光谱响应规律,基于连续小波分析提取了对稻叶瘟敏感的SIF小波特征,建立了感病叶片识别模型,可为稻叶瘟的田间早期诊断提供技术支撑。主要结论如下。
(1)明确了不同叶位稻叶瘟识别模型的精度差异。基于上行及下行SIF光谱,顶1叶稻瘟病识别模型精度均达到70%,显著高于顶2叶、顶3叶、顶4叶。在田间以某一特定叶片的SIF光谱来诊断水稻叶瘟病发病情况时,顶1叶是较为理想的指示叶。
(2)基于SIF小波特征的感病叶片识别效果优于原始SIF波段。基于连续小波变换及特征选择,顶2至顶4叶上行及下行最优特征的分类精度分别达到70.13%、63.70%、64.63%、64.53%和70.90%、63.12%、62.00%、64.02%,均高于冠层监测常用特征F760。
(3)提取了适用于多叶位的共性敏感小波特征。本研究提取的共性特征↑WF832,3和↓WF809,3在顶1叶至顶4叶位的精度分别达到69.45%、62.19%、60.35%、63.00%和69.98%、62.78%、60.51%、61.30%,能较好地指示整个植株的发病情况。
后续工作可进一步探索适用于水稻全生育期稻叶瘟早期监测的共性特征,并探究共性特征的升尺度应用性能,为大尺度田间早期稻叶瘟的快速诊断提供技术支持。


