0 Introduction
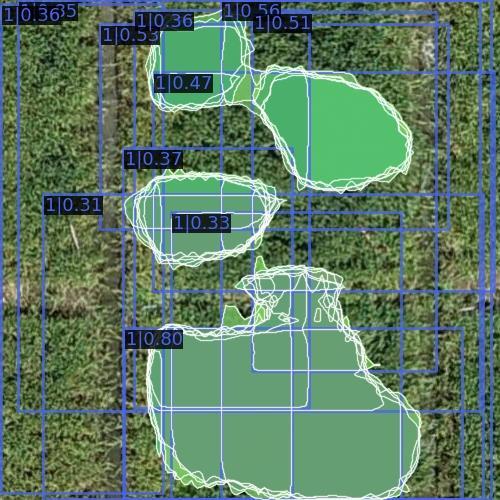
Fig. 1 Visualization of Mask R-CNN detection results for wheat lodging in UAV images during the grain filling stage |
1 Materials and Methods
1.1 Study area
1.2 Dataset construction
1.2.1 Data collection
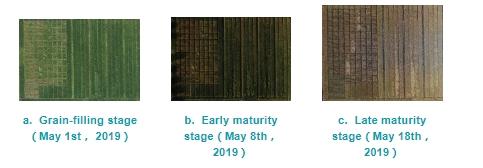
Fig. 2 The captured visible light images of the three growth stages by drone |
1.2.2 Data pre-processing
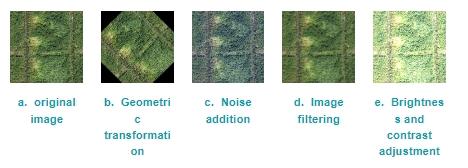
Fig. 3 Data augmentation using the grain-filling period image as an example |
1.3 Methodology for establishing the Lodging2Former
1.3.1 Introduction to the Mask2Former
1.3.2 Network design of the Lodging2Former
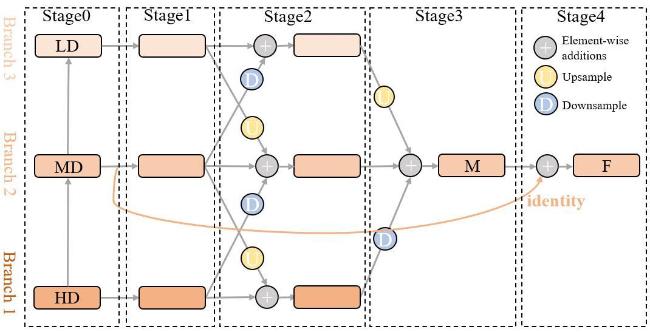
Fig. 4 The overall flowchart of the proposed Lodging2Former method |
Fig. 5 Illustration of the fusion refine model (FRM) |
1.3.3 Hierarchical Interactive Feature Pyramid Network
1.3.4 Mask Ground Truth Generation
Fig. 6 Mask images of wheat lodging at three growth stages |
1.4 Experiment environment and parameter configuration
1.5 Evaluation metrics
2 Results and analysis
2.1 Comparison of detection performance before and after model improvement
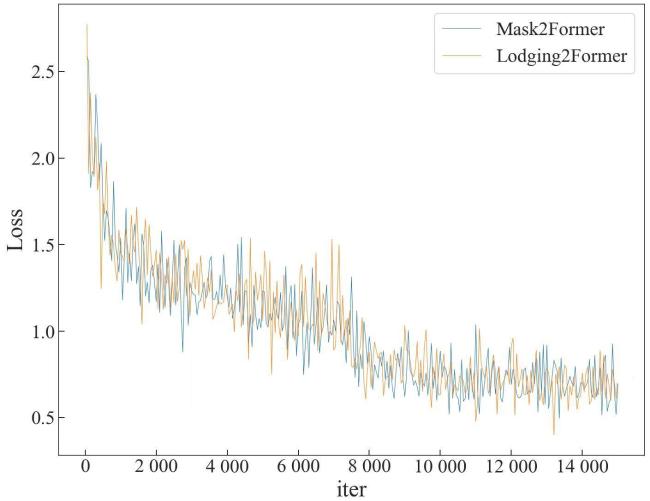
Fig. 7 Comparison of Loss Curves between the Mask2Former model and the Lodging2Former model |
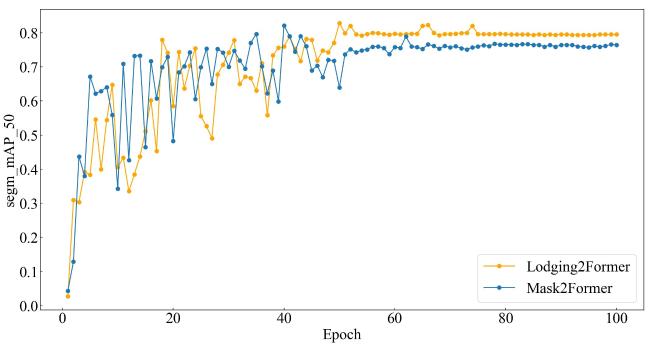
Fig. 8 Comparison of mAP Curves between the Mask2Former model and the Lodging2Former model |
2.2 Comparison of detection performance with the State-of-the-Art Methods
Table 1 Comparison of mAP and mIoU results of different state-of-the-art models at different growth stages |
| Growth Stages | Method | mIoU | mAP | ||||
|---|---|---|---|---|---|---|---|
| 0.5 | 0.2 | 0.01 | 0.5 | 0.75 | 0.5:0.95 | ||
| Multiple stages | Mask-RCNN | 54.2 | 57.1 | 57.0 | 54.4 | 13.8 | 19.2 |
| SOLOV2 | 34.9 | 54.4 | 58.4 | 69.6 | 9.5 | 25.0 | |
| Mask2Former | 63.7 | 63.7 | 63.7 | 78.2 | 36.2 | 39.1 | |
| Lodging2Former | 66.0 | 66.0 | 68.7 | 79.5 | 40.2 | 43.4 | |
| Grain-filling stage | Mask-RCNN | 64.9 | 65.1 | 66.8 | 60.4 | 6.9 | 16.0 |
| SOLOV2 | 61.2 | 61.2 | 62.6 | 80.5 | 5.2 | 25.4 | |
| Mask2Former | 72.4 | 72.4 | 72.4 | 95.6 | 60.4 | 48.4 | |
| Lodging2Former | 73.0 | 73.0 | 73.0 | 97.4 | 60.8 | 50.2 | |
| Early maturity stage | Mask-RCNN | 78.4 | 79.8 | 79.8 | 80.5 | 31.0 | 35.7 |
| SOLOV2 | 48.7 | 67.1 | 71.1 | 89.0 | 26.6 | 43.7 | |
| Mask2Former | 76.5 | 76.5 | 76.5 | 94.7 | 60.1 | 59.0 | |
| Lodging2Former | 81.4 | 81.4 | 81.4 | 96.6 | 60.2 | 59.1 | |
| Late maturity stage | Mask-RCNN | 43.8 | 45.1 | 45.6 | 37.9 | 2.6 | 9.8 |
| SOLOV2 | 36.4 | 36.4 | 37.8 | 41.7 | 3.8 | 15.6 | |
| Mask2Former | 45.8 | 45.8 | 45.8 | 53.5 | 11.8 | 20.0 | |
| Lodging2Former | 47.8 | 47.8 | 47.8 | 53.8 | 11.8 | 20.6 | |
2.3 Comparison of model detection performance at different growth stages
2.4 Visualization Results
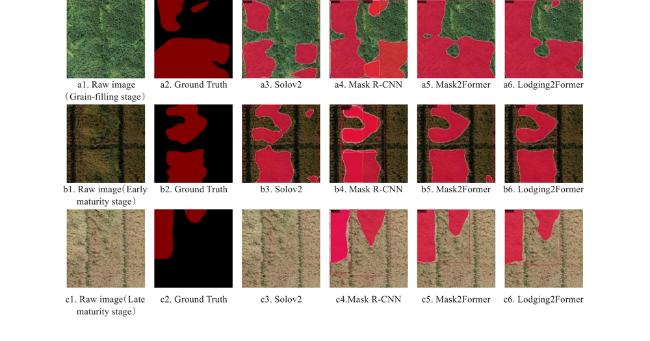
Fig. 9 Visualization results of wheat lodging detection sampling tests at different growth stages using different methods |
2.5 Model generalization experiment
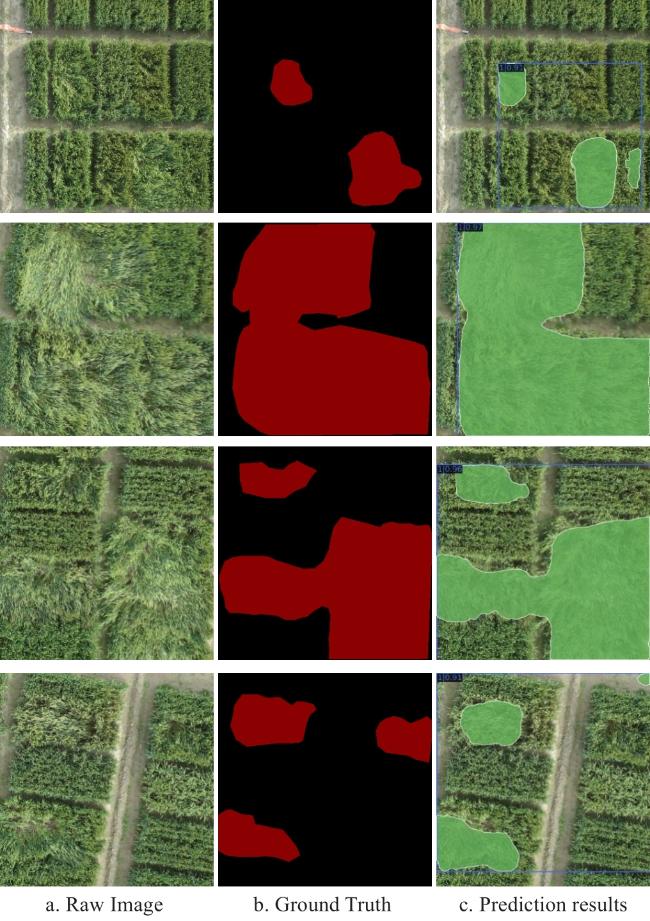
Fig. 10 Visualization of prediction results for wheat lodging detection using the Lodging2Former on publicly available datasets |


