


0 引 言
1 算法改进
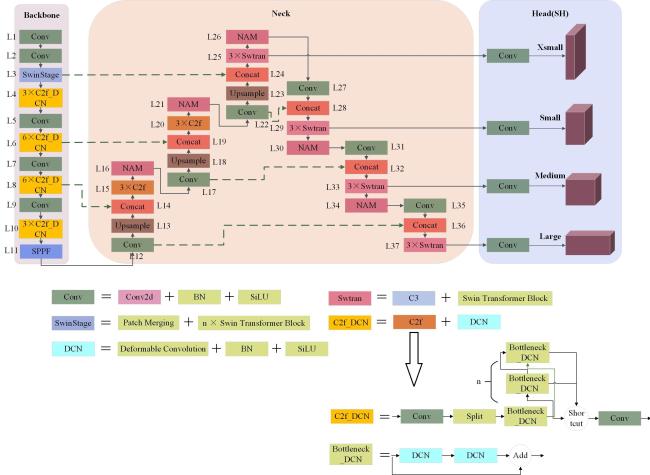
1.1 MSH-YOLOv8目标检测模型
1.2 分辨率动态训练与模型融合
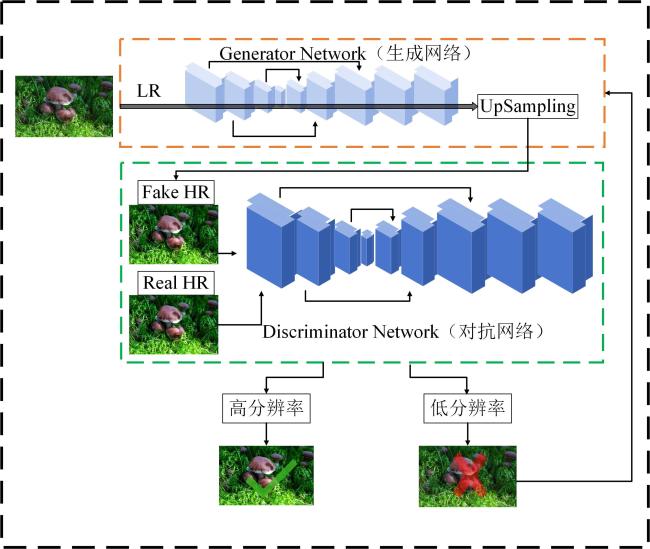
1.2.1 图像超分辨率重建
1.2.2 模型融合
2 Fungi数据集介绍及处理
2.1 数据处理
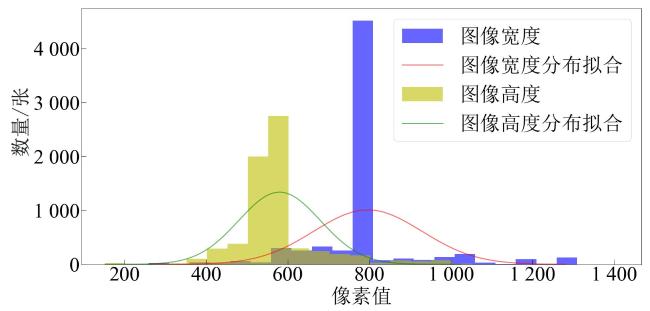
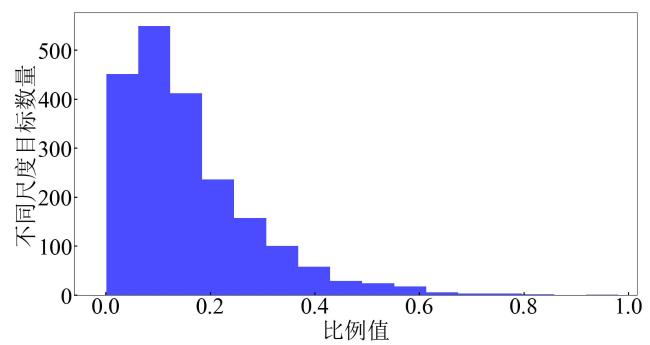
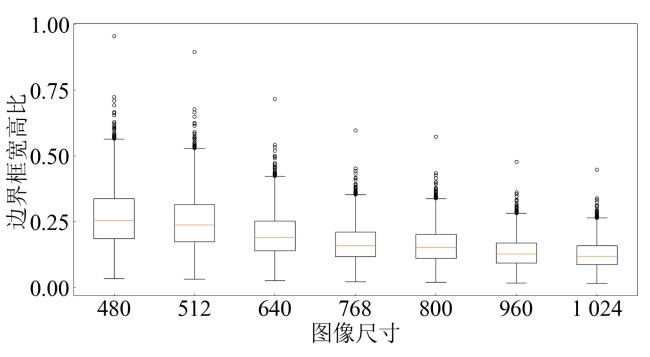
2.2 小尺度目标分析
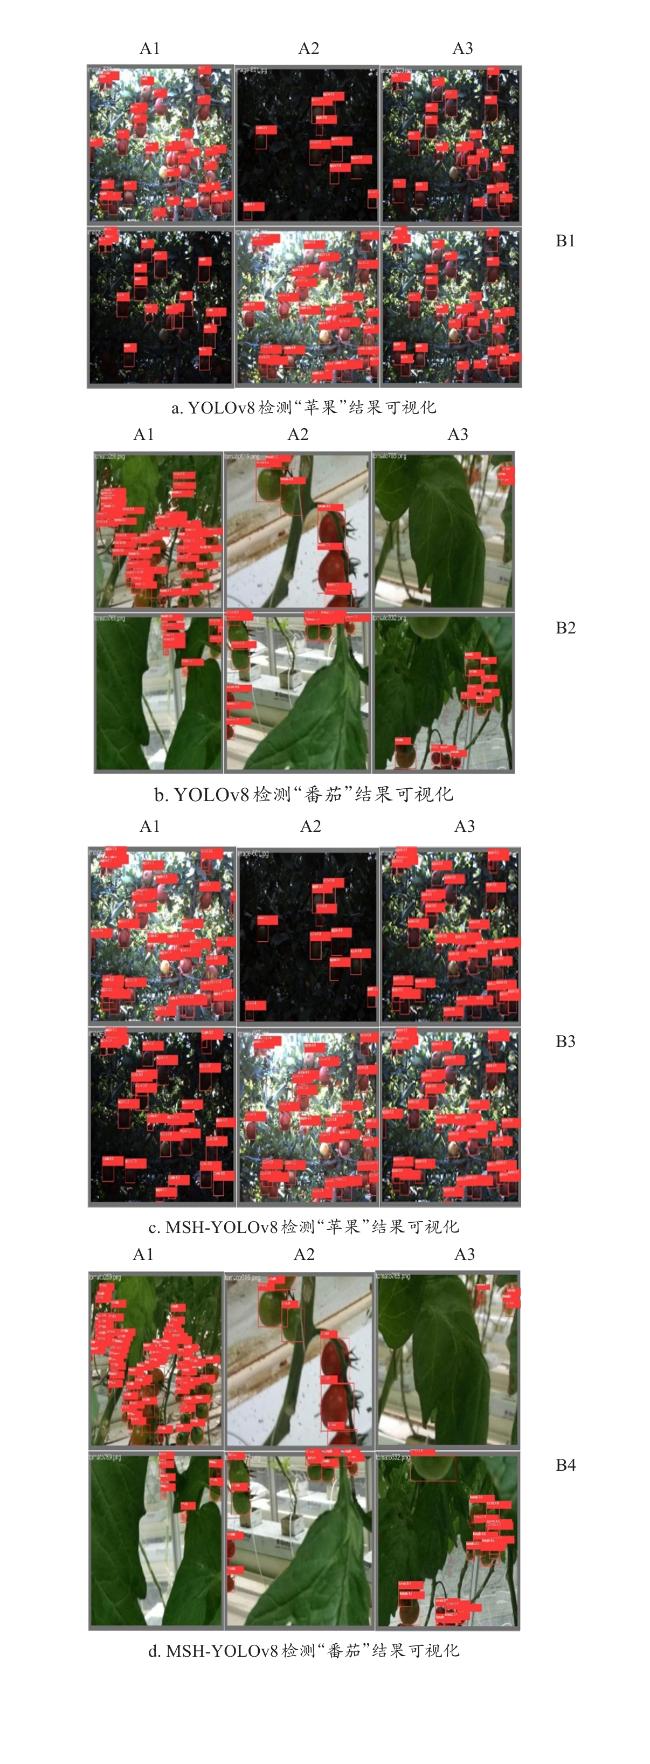
3 实验结果与分析
3.1 评价指标
3.2 模型训练与环境
3.3 消融实验
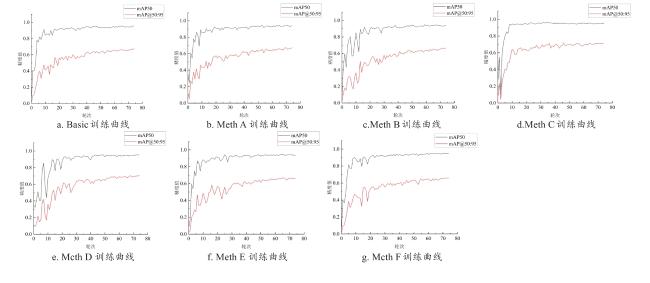
表1 MSH-YOLOv8消融研究各阶段实验结果Table 1 Experimental results at each stage of MSH-YOLOv8 ablation study |
| 指标 | Basic | Meth A | Meth B | Meth C | Meth D | Meth E | Meth F |
|---|---|---|---|---|---|---|---|
| Xs Det | × | √ | √ | √ | √ | √ | √ |
| Swin Transformer encoder | × | × | √ | √ | √ | √ | √ |
| C2f_DCN | × | × | × | √ | √ | √ | √ |
| NAM | × | × | × | × | √ | √ | √ |
| SHs + New Anchors | × | × | × | × | × | √ | √ |
| WIoU | × | × | × | × | × | × | √ |
| AP50/% | 96.13 | 96.71 (0.61↑) | 97.44 (0.75↑) | 97.56 (0.12↑) | 97.93 (0.38↑) | 98.27 (0.35↑) | 98.49 (0.22↑) |
| APs/% | 36.69 | 37.15 (1.09↑) | 38.20 (2.82↑) | 38.36 (0.42↑) | 38.62 (0.68↑) | 39.59 (2.51↑) | 39.73 (0.35↑) |
| Params/M | 11.17 | 19.94 | 28.15 | 28.17 | 28.14 | 26.93 | 26.93 |
| GFLOPs | 28.81 | 34.91 | 40.57 | 40.67 | 40.55 | 24.63 | 24.63 |
|
表2 消融阶段不同损失函数的结果横向对比Table 2 Horizontal comparison of results with different loss functions during ablation stage |
| 模型 | AP50/% |
|---|---|
| Meth E+ CIou Loss | 97.83 |
| Meth E+ GIou Loss | 98.37 |
| Meth E+ DIou Loss | 98.09 |
| Meth E+ WIou Loss | 98.37 |
表3 MSH-YOLOv8引入不同注意力机制的结果横向对比Table 3 Horizontal comparison of results with different attention mechanisms introduced in MSH-YOLOv8 |
| 模型 | AP50/% | APs/% | Params/M | GFLOPs |
|---|---|---|---|---|
| MSH-YOLO+ NAM | 98.47 | 39.70 | 26.93 | 24.63 |
| MSH-YOLO+ CBAM | 98.45 | 39.66 | 27.02 | 29.58 |
| MSH-YOLO+ SimAM | 98.33 | 39.63 | 27.95 | 29.62 |
| MSH-YOLO+ SE | 98.39 | 39.61 | 27.03 | 29.58 |
| MSH-YOLO+ ECA | 98.41 | 39.64 | 26.95 | 29.63 |
表4 MSH-YOLOv8单功能模块独立消融实验结果Table 4 Independent ablation experiment results for single functional modules in MSH-YOLOv8 |
| 模型 | Basic | AE1 | AE2 | AE3 | AE4 | AE5 | AE6 |
|---|---|---|---|---|---|---|---|
| Xs Det | × | √ | × | × | × | × | × |
| C2f_DCN | × | × | √ | × | × | × | × |
| Swin Transformer encoder | × | × | × | √ | × | × | × |
| NAM | × | × | × | × | √ | × | × |
| WIoU | × | × | × | × | × | √ | × |
| SHs + New Anchors | × | × | × | × | × | × | √ |
| APs/% | 36.69 | 37.15 (1.25↑) | 37.03 (0.93↑) | 37.18 (1.34↑) | 37.05 (0.98↑) | 36.71 (0.06↑) | 37.13 |
| (1.19↑) |
|
3.4 模型横向对比实验
表5 MSH-YOLOv8同其他模型实验结果横向比较Table 5 Horizontal comparison of experimental results between MSH-YOLOv8 and other models |
| 模型名称 | AP50/% | 变化量/% | AP@50-95/% | 变化量/% | APs/% | 变化量/% | GFLOPs | Params/M |
|---|---|---|---|---|---|---|---|---|
| YOLOv5 | 95.81 | 2.80↑ | 71.13 | 5.85↑ | 36.32 | 9.39↑ | 16.66 | 7.23 |
| YOLOv8 | 96.24 | 2.34↑ | 72.35 | 4.06↑ | 36.60 | 8.55↑ | 28.81 | 11.17 |
| Vision Transformer | 96.07 | 2.52↑ | 71.96 | 4.63↑ | 36.42 | 9.09↑ | 17.67 | 14.67 |
| Swin Transformer | 96.29 | 2.28↑ | 72.54 | 3.79↑ | 36.57 | 8.64↑ | 41.53 | 49.94 |
| TPH-YOLOv5 | 96.43 | 2.14↑ | 73.27 | 2.76↑ | 37.17 | 6.89↑ | 36.50 | 41.91 |
| MSH-YOLOv8 | 98.49 | \ | 75.29 | \ | 39.73 | \ | 24.63 | 26.93 |
|
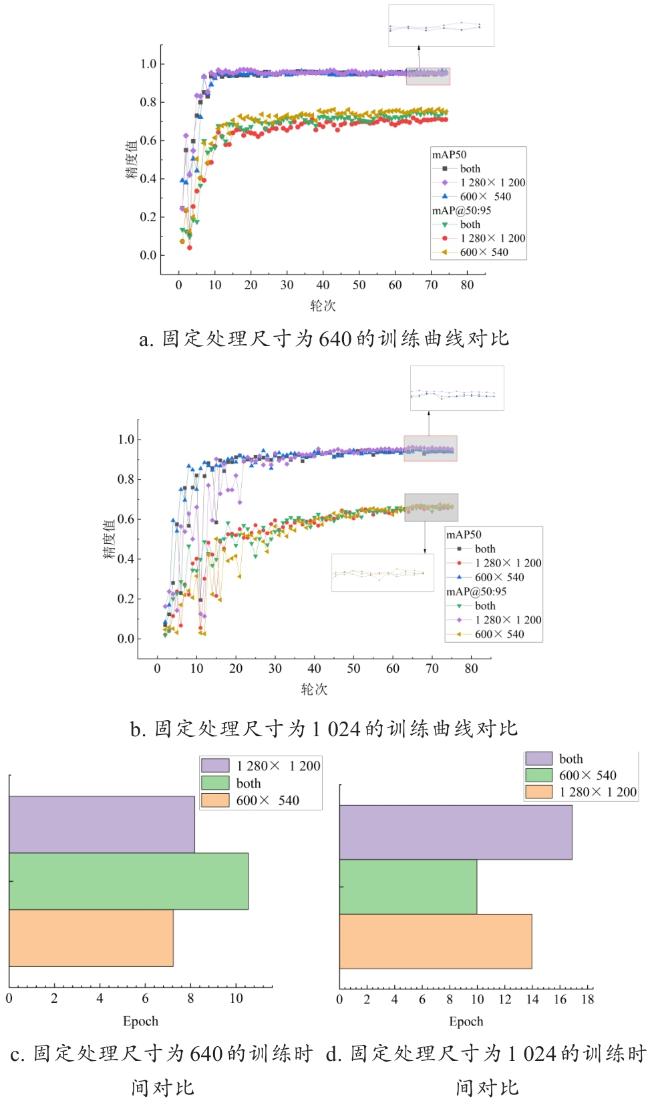
3.5 模型融合实验
3.5.1 分辨率动态训练
表6 MSH-YOLOv8子模型的训练结果Table 6 Training results of sub-models in MSH-YOLOv8 |
| 子模型 | 处理/输入尺寸 | AP50/% | APs/% |
|---|---|---|---|
| MSH-YOLOv8-1(MSH1) | 480 | 96.76 | 37.16 |
| MSH-YOLOv8-2 | 512 | 97.90 | 38.82 |
| MSH-YOLOv8-3 | 640 | 98.49 | 39.73 |
| MSH-YOLOv8-4 | 768 | 98.13 | 39.37 |
| MSH-YOLOv8-5 | 800 | 97.95 | 38.73 |
| MSH-YOLOv8-6 | 960 | 97.71 | 38.65 |
| MSH-YOLOv8-7 | 1 024 | 96.82 | 37.31 |
表7 MSH-YOLOv8子模型的多尺度测试及评价结果Table 7 Multi-scale testing and evaluation results of various sub-models in MSH-YOLOv8 |
| 模型 | 输入尺寸 | F 1平均值/% | ||||||
|---|---|---|---|---|---|---|---|---|
| 480 F 1/% | 512 F 1/% | 640 F 1/% | 768 F 1/% | 800 F 1/% | 960 F 1/% | 1 024 F 1/% | ||
| MSH1 A | 98.22 | 95.76 | 95.63 | 93.74 | 96.22 | 92.01 | 94.73 | 96.59 |
| MSH2 AAAA | 96.75 | 98.52 | 93.25 | 95.88 | 87.05 | 92.16 | 90.77 | 97.12 |
| MSH3 AAAAA | 95.88 | 96.92 | 98.49 | 97.32 | 96.94 | 98.33 | 97.84 | 97.45 |
| MSH4 AAA | 96.73 | 95.50 | 96.77 | 98.78 | 97.97 | 96.27 | 95.42 | 97.08 |
| MSH5 AAAA | 95.87 | 96.76 | 97.26 | 97.04 | 98.25 | 96.35 | 94.09 | 97.14 |
| MSH6 AAA | 94.83 | 96.37 | 96.93 | 96.65 | 97.09 | 98.22 | 96.94 | 97.07 |
| MSH7 AA | 96.08 | 95.13 | 97.28 | 97.92 | 96.86 | 97.11 | 98.31 | 96.90 |
|

3.5.2 融合实验
表8 MSH-YOLOv8的融合研究实验结果Table 8 Experimental results of fusion research in MSH-YOLOv8 |
| 模型 | AP50/% | AP50(Soft-NMS) /% | APs/% | APs(Soft-NMS) /% |
|---|---|---|---|---|
| MSH1 | 96.76 | 96.94(0.19↑) | 37.16 | 37.68(1.40↑) |
| MSH2 | 97.90 | 98.26(0.37↑) | 38.82 | 39.36(1.39↑) |
| MSH3 | 98.49 | 98.63(0.14↑) | 39.73 | 40.23(1.26↑) |
| MSH4 | 98.13 | 98.48(0.36↑) | 39.37 | 39.82(1.14↑) |
| MSH5 | 97.95 | 98.05(0.10↑) | 38.73 | 39.25(1.34↑) |
| MSH6 | 97.71 | 97.92(0.21↑) | 38.65 | 39.16(1.32↑) |
| MSH7 | 96.82 | 97.38(0.58↑) | 37.31 | 37.81(1.34↑) |
| 平均值 | 97.63 | 97.95(0.33↑) | 38.54 | 39.05(1.31↑) |
| Ensemble(WBF) | 98.85 | 99.14 | 40.13 | 40.59 |


