


0 引 言
Venlo型温室作为目前常见的现代化温室设施,相较于传统大棚温室,在通风、采光和空间利用效率等方面发挥显著作用[1, 2]。夏季温室内部存在温度过高且局部温差较大的现象,对作物生长有较大影响。同时,作物进行光合作用时会消耗大量二氧化碳,室内二氧化碳的差异化分布问题亟待解决。湿帘-风机系统是当前使用最为广泛且有效的机械通风技术,可以对温度、湿度及二氧化碳浓度等环境参数进行有效调节:一方面,水汽交换将显热转化为汽化潜热,可以实现对温室的加湿与降温;另一方面,强制通风可以加快室内外空气流动,配合二氧化碳注入可以起到补充作用。但受限于温室环境的非线性、强耦合性特点以及传统方法对人工经验的依赖,主动调控的作用范围不均匀,且运行能耗较高[3]。目前基于已建成温室,对夏季机械通风策略进行优化的相关研究较少。
随着计算流体力学(Computational Fluid Dynamics, CFD)衍生并逐渐向农业领域过渡,Okushima等[4]于1989年首次在温室环境的预测研究中引入该技术,建立了自然通风的模型体系。基于此,国内外学者利用CFD对温室环境的分布规律与优化调控进行了大量研究,前者主要集中在季节场景[5-7]、通风模式[8-11]和结构调整[12-14]几方面,如陆清清[15]基于热平衡原理,研究了保温幕与内遮阳对连栋玻璃温室冬夏两季夜间温度的影响。万敏等[16]探究了不同通风组合方式下日光温室的微环境状况,同时结合作物蒸腾模型分析获得了作物蒸腾特征。张国祥等[17]则基于后置固定式卷帘装置进一步研究不同开度对于改进型日光温室内部温度变化的影响。后者则大致分为设计构造[18-20]与环境参数[21-23]调节两类,如高振军等[24]设计了10余种湿帘风机系统安装方案用以探究高度变化对Venlo温室降温效果的影响。Yin等[25]采用CFD技术构建了强制通风条件下的玻璃温室内热环境仿真模型,通过对比离散化分析与实测结果的匹配度,探究了进口风速大小对气流运动特征与温控有效范围的关联性规律。
根据现有文献,CFD模型参数的输入可重复性与可控性优点有助于系统研究不同因素对温室内流场的影响。设计构造类的研究对后续温室设计及内环境参数优化具有指导意义,但其操作流程具有开环特性,每次仿真均需人工干预,对已建成温室提供环境优化依据时具有一定局限性[26, 27];环境参数类研究在一定程度上弥补了该不足,但优化策略的环境均匀性、作物适配性仍有待提高[28, 29]。因此,本研究拟搭建基于多目标粒子群优化算法(Multi-Objective Particle Swarm Optimization, MOPSO)的Fluent-Python联合优化框架,选取温度、CO2浓度和风机能耗作为目标函数,在验证模型后以风机出口风速、湿帘冷凝温度作为控制变量,对温室环境进行迭代优化,得到明确的调控策略以增强环境均匀性与运行低能耗。
1 试验设计与CFD建模
1.1 试验温室
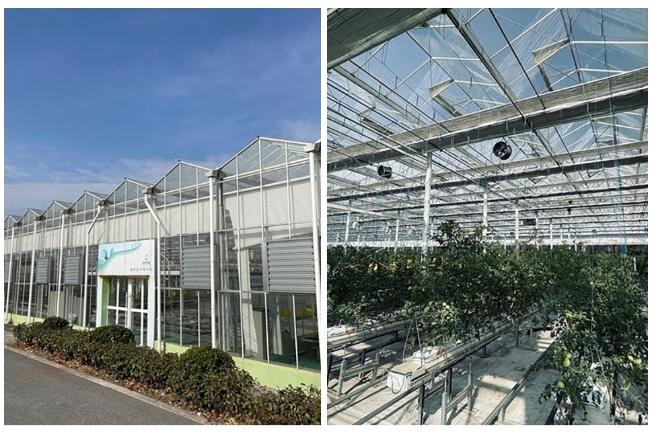
试验温室位于浙江省湖州市南浔区果蔬高新科技园区内(30°41′N;120°28′E),温室屋脊呈南北走向,脊高6.8 m,肩高6 m,开间3.2 m,跨度9.6 m;四周及顶部覆盖材料为透光率≥90%的浮法玻璃。
温室内部上方布置有遮阳网与环流风机,北侧安装有湿帘入口,南侧安装有轴流风机出口。温室内种植无限生长型番茄植株,种植间隔为1.2 m,整体围护结构如图1所示。
试验时间为2024年5月17日13∶00,测试期间室外最高气温为32.6 ℃,最大太阳辐射为506.9 W/m2,风机出口风速为5.5 m/s,外界风向为西南风,平均风速0.96 m/s。
1.2 试验方法
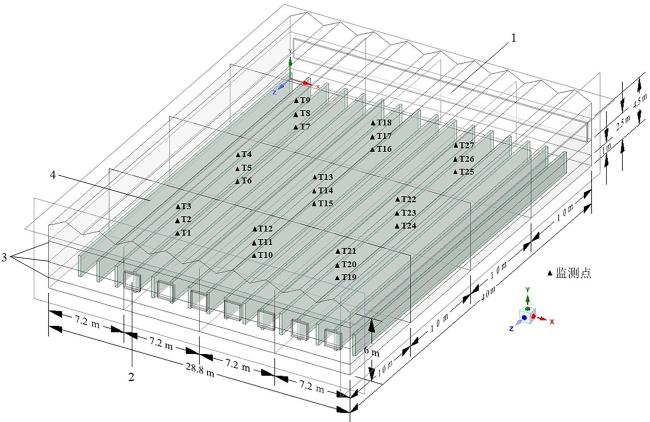
自然状态下,温室内部环境在竖直方向呈现梯度分布现象。为使环境均匀性评估与调控合理,试验时将监测点在温室内空间进行递归布置:在水平与竖直截面上均呈3×3排布,自下而上布设位置分别为1 m(作物垂蔓高度)、2.5 m(作物冠层高度)、4.5 m(温室上部高度),共计27个观测点,试验建模时,按照温室实际尺寸,在Space Claim中以西北角为坐标原点,选择X轴正方向为正东,Z轴正方向为正南,Y轴正方向为垂直朝上方向,创建笛卡尔坐标系下的1∶1几何模型,如图2所示。
室内温度测量选用Testo 176型无线温度传感器,测量精度为±0.1 ℃;风速测量选用WXT536型三维超声风速风向仪,测量精度为±0.1 m/s;玻璃壁面、地面及叶片温度使用海康微影红外热成像测温仪测量;室外气象参数包括外界温度、太阳辐射及风速风向等,由温室西南侧的农庄气象站采集。由于温室面积较大,数据涉及多点多次采集,故统一存储至温室内置的环境监测云平台,存储周期为60 min。
1.3 温室CFD建模与验证
试验在构建CFD模型时,考虑机械通风工况下,轴流风机通过向室外排风使室内空气形成负压,迫使外界空气经湿帘冷却后进入室内,达到气流交换与散热目的。模型整体较简单,因此在不影响仿真结果的前提下,做出如下的简化处理:
1)将温室围护结构及内部作物在物理上视为各向同性。
2)假设温室壁面分布均匀,不考虑壁面薄厚变化对辐射光的吸收影响;遮阳网、保温幕、钢架结构和地面蒸发的潜热交换等忽略。
3)试验期间温室南侧门处于关闭状态,故进行建模时不考虑其存在。
4)将试验期间的作物按实际大小简化为长方体形的多孔介质模型。
温室计算域的网格划分需要对边界层及风机-湿帘处进行局部细化,整体采用Fluent Meshing进行网格划分与独立性检验,生成类型设置为混合网格(Hybrid Mesh)。
1.3.1 模型选取
在对温室流体的各物理参数进行研究时,一般将气流视为定常不可压缩流体运动,定义其遵循质量守恒方程、动量守恒方程与能量守恒方程,通用形式为公式(1) 和公式(2) 。
=+div()
=-
式中: 为通用变量;v为流体速度矢量,m/s; 为广义源项,W/m3; 为扩散通量; 为广义扩散系数,m2/s。
鉴于温室机械通风过程的模拟为稳态流动,且兼顾计算精度与效率,本研究采用Realizable k-ε湍流模型进行求解;室内的流动气体视为空气、水蒸气及二氧化碳混合态,启用组分运输(Species Transport)模型并设置浓度源项,模拟其在室内的对流扩散;考虑温室的热量传递以辐射传热为主,仿真过程采用离散方向(Discrete Ordinates, DO)辐射模型,Fluent可根据温室地理位置与试验时间等参数计算温室太阳辐射总量;作物-环境之间的显热交换量主要由冠层的空气动力学特性计算所得,汽化潜热量主要由作物吸收太阳辐射通过蒸腾作用转化而得,二者通过自定义源项形式加载至能量控制方程中体现。
1.3.2 边界条件设置
表1 温室CFD模型材料参数Table 1 Material parameter for greenhouse in CFD model |
| 材料属性 | 数值 | |
|---|---|---|
| 玻璃 | 密度/(kg/m3) | 2 500 |
| 导热系数/[W/(m·K)-1] | 0.71 | |
| 厚度/mm | 6 | |
| 温度/℃ | 38.2 | |
| 空气 | 密度/(kg/m3) | 1.165 |
| 相对湿度/% | 76.3 | |
| 导热系数/[W/(m·K)-1] | 2.71 10-2 | |
| 动力黏度/Pa·s | 1.81 10-5 | |
| CO2 | 浓度/(mg/m3) | 700 |
| 地面 | 导热系数/[W/(m·K)-1] | 1.4 |
| 厚度/m | 0.1 | |
| 温度/℃ | 32.8 | |
| 作物 | 冠层阻力系数 | 0.322 |
| 叶面积指数/(m2/m3) | 2.8 | |
| 冠层温度/℃ | 34.3 | |
| 冠层气流速度/(m/s) | 0.67 | |
| 气孔阻抗/(s/m) | 640 | |
1.3.3 模型独立性检验与验证
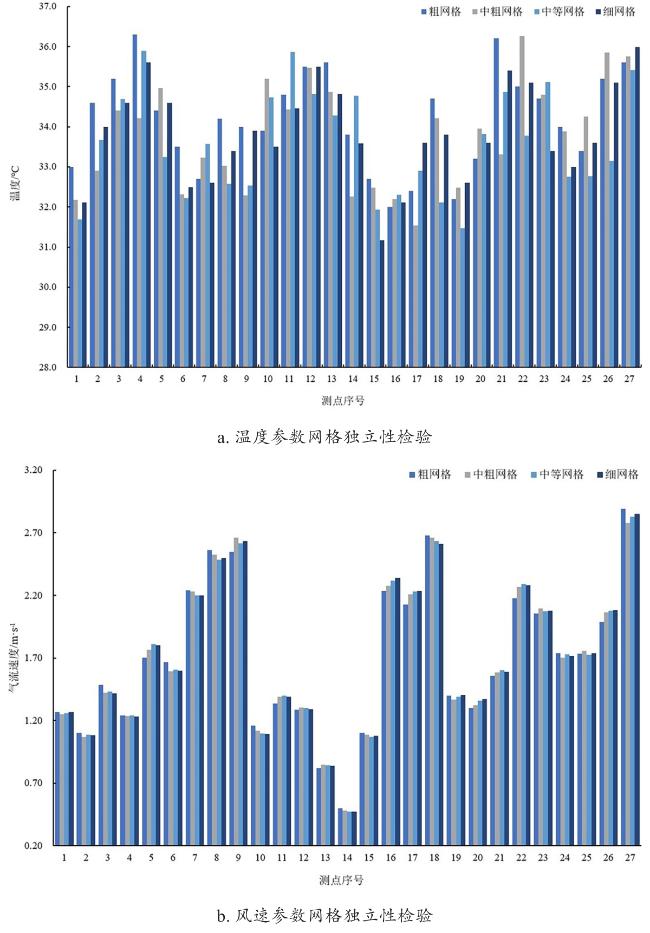
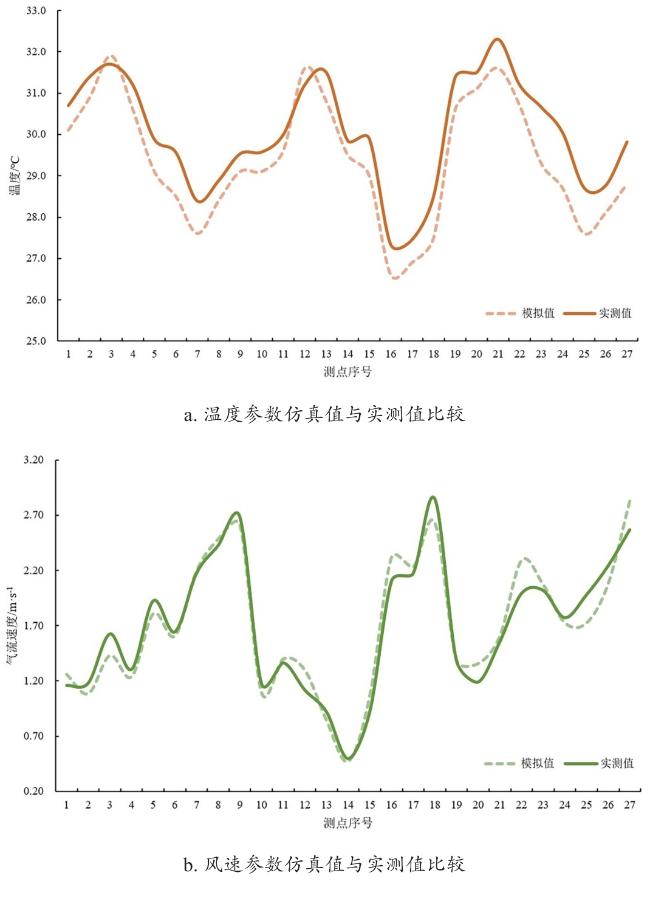
机械通风条件下,温室各观测点的温度与风速的仿真值和实测值比较如图4所示,可以看出二者的变化规律基本一致。温度场最大相对误差与平均相对误差分别为8.3%和4.6%,实测值普遍略大于仿真值,推测原因为传感器发热;受外界及人为扰动影响,速度场的仿真误差相对较大,平均误差为6.8%。对于大多常见的流体问题,通常期望误差在10%以内,故认为该划分标准下的边界条件设置是有效的,结果可真实反映温室内环境分布情况。
2 温室环境因子优化方法
2.1 多目标优化算法
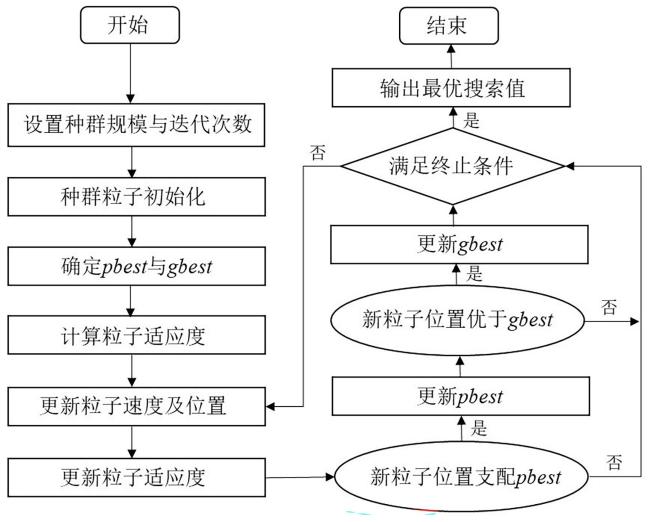
多目标优化是寻求多个互不兼容的目标函数之间的平衡,从中找到均衡解集的过程。最初常通过加权、约束等方法将多目标拆分转化,现多应用粒子群优化(Particle Swarm Optimization, PSO)、遗传算法(Genetic Algorithm, GA)和差分进化算法(Differential Evolution Algorithm, DEA)等Pareto前沿探索方法[32-34]。其中,MOPSO不涉及复杂的排序操作,算法结构相对简单,同时具备一定的局部搜索能力,通过更新粒子速度和位置,能够较迅速地收敛至Pareto最优解集,适用于小规模、连续性的多目标优化求解,因此本研究采用该算法,确切描述为:算法开始运行后,众多粒子会在边界范围随机生成,并拥有属于独立的初始位置和飞行速度,粒子的实时位置POP[i]是优化问题的决策变量,飞行速度VEL[i]则由迄今为止该粒子搜索到的最优解(历史位置)pBest与所有粒子搜索到的最优解(全局位置)gbest共同决定,速度和位置的更新算法如公式(3) 和公式(4) 所示。
VEL[i]= ×VEL[i]+R1×(pBest-POP[i])+R2×(gbest-POP[i])
POP[i]=POP[i]+VEL[i]
式中:VEL[i]为第i个粒子的当前速度;VEL[i]为第i个粒子的前置速度;pBest为该粒子的历史最优位置;POP[i]为第i个粒子的前置位置;gbest为所有粒子的历史最优位置; 为惯性权重系数, ×VEL[i]为对第i个该粒子前置速度的记忆项;R1和R2为学习因子,R1×(pBest-POP[i])为第i个该粒子在历史记忆位置和当前位置的抉择矢量,被认定为自我认知项;R2×(gbest-POP[i])为第i个该粒子在历史非支配位置和当前位置的关联矢量,被认定为群体认知项,这3项共同作用于更新粒子i的速度和位置。
MOPSO基本流程如图5所示。
2.2 优化框架搭建流程
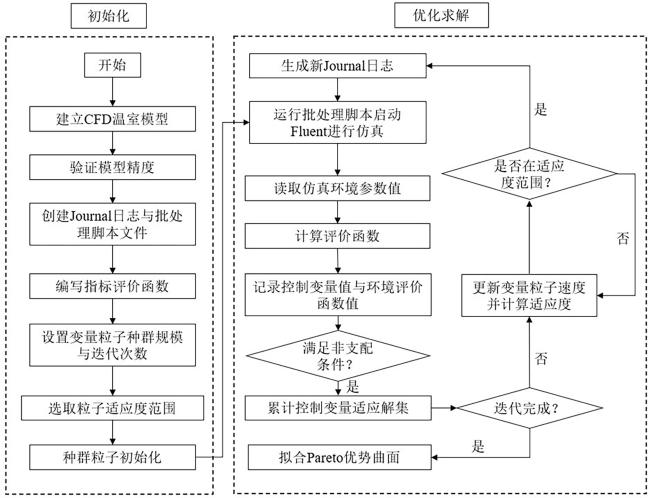
在本研究机械通风模式的优化研究中,以作物生长环境的温度适宜性指标 、CO2浓度分布均匀性指标 以及风机运行的能耗指标 为目标函数,选取特定范围内的湿帘入口温度与风机出口风速作为控制变量,搭建温室多环境因子优化方案。过程启用Fluent内置的Python API,通过脚本撰写修改CFD模型的输入参数,可以批量运行不同的仿真案例并进行后处理。具体优化过程如下:
1)模型构建。建立温室几何模型,设置边界条件及材料参数,在验证模型精度后保存case文件,用以后续仿真求解。
2)日志创建。在Fluent的文本用户界面(Text User Interface, TUI)编写Journal日志,用于顺序执行仿真命令并提取该次环境仿真中设置的监测点参数。
3)脚本编写。在Python环境下编写批处理脚本,通过循环方式调用Fluent读取多个Journal日志进行仿真。
4)MOPSO初始化。设置种群粒子规模、迭代次数及控制变量选取范围;编写环境评价函数 、 、 。
5)交互寻优。MOPSO优化开始后,在初始化给出的控制变量范围内生成规模粒子数的Journal日志;运行批处理脚本将各粒子分配至多节点并行计算;读取Fluent此次仿真的监测点环境参数后保存至data文件;更新变量粒子的速度与位置,生成新的Journal日志。
6)结果拟合。读取文件用以计算目标函数,在全局范围内判断是否满足非支配条件,若满足则保存该适应解至外部存储库(Repository),若后续出现支配解则予以剔除,直至优化完成,拟合目标函数的Pareto曲面,记录相应控制变量范围。整体优化流程如图6所示。
2.3 算法参数选取
SP=
=
式中:i, j=1,…,n,表示粒子数量; 为所有 的平均值; 为各粒子与相邻粒子的最短距离; 、 、 表示各粒子的目标函数值。SP值一般要求<0.01,越小则表明解集分布越均匀。
2.4 硬件配置
本研究所涉及的算法优化在每个粒子进行速度及位置迭代时均需配合CFD仿真响应,为兼顾优化结果准确性和计算效率,通常采用并行计算分配多个仿真任务。此外在硬件方面,本研究采用华东电信数据机房的“铂金三代”服务器,通过ToDesk软件进行远程登录后,在Windows 11操作系统中实现上述优化,服务器配置见表2。
表2 环境优化研究运算服务器配置Table 2 Research on environment optimization and computing server configuration |
| 参数 | 铂金三代服务器 |
|---|---|
| 核心数目 | 64 |
| 内存/GB | 128 |
| 搭载系统 | Windows 11 |
| 仿真平台 | Fluent 2022R2 |
2.5 评价函数定义
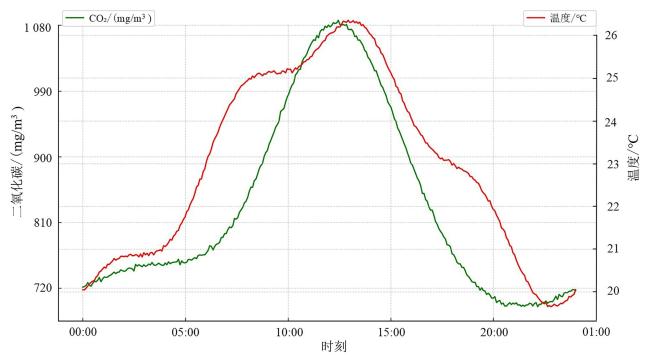
本研究优化对象在环境因子中面向作物区域的生长温度及CO2的浓度分布。根据文献[37],番茄的最适生长温度一般为22~28 ℃,过高或过低都会抑制其正常生长代谢;同时,适宜浓度的CO2也有助于提升番茄的光合作用速率,通常在720~1 440 mg/m3的CO2浓度下,光合作用与生长状态表现出较强的正相关。试验期间基于番茄生长模型经参数辨识生成24 h的理想环境曲线[38],如图7所示。由该曲线可知,两峰较为集中在12∶00—14∶00,此时作物区域的整体生长适宜温度为26 ℃左右。鉴于温度梯度分布现象,在综合考虑降温能耗后,试验选取作物冠层的理想温度为28 ℃,温室上层受外界太阳辐射与上浮热空气影响,设置为30 ℃,作物垂蔓处温度相对较低时有利于保持根系正常功能,设置为25 ℃;同理,CO2的理想浓度分布在不同的高度平面也应有所区分,从下到上依次设定为1 170、1 080和990 mg/m3。
Fluent每次仿真后会提取每个观测层的9个监测点数据用以平均计算,再与定义的环境指标函数进行对比,实现对该次优化性能的评价,具体的函数定义如下。
温度适宜性函数 如公式(7) 所示。
式中: 为温室中第l层第j个观测点的仿真温度,K; 为温室中第l层的理想温度设定值,K;n为温室监测点总数,个。
CO₂分布均匀性函数 公式(8)所示。
式中: 为温室中第l层第j个观测点的CO2仿真浓度,mg/m3; 为温室中第l层的理想CO2浓度设定值,mg/m3;n为温室监测点总数,个。
轴流风机能耗函数 如公式(9) 所示。
式中:∆p为风机的压力变化,取20 Pa; 为风机送风的总容积流量,m3/s; 为风机运行效率,取0.8。
3 结果与分析
基于MOPSO进行优化求解时,为兼顾种群多样性与算法收敛速度,试验依据参数选取原则将粒子种群数设置为100,迭代次数设置为5,惯性权重系数 设置为0.7,学习因子R1和R2均设置为0.4;在温室边界条件中,在湿帘一侧设置CO2质量入口为8.4×10⁻⁵ kmol/h,冷凝温度设置为294~ 302 K,风机出口速度设置为2.5~6.5 m/s,通过Fluent 2022 R2进行求解,共计耗时75.4 h。
如图8所示,粒子群的适应解集收敛至深色Pareto前沿曲面。MOPSO在本研究的优化过程中求解出的最佳温度适宜性指标 范围为0.58~3.43;CO2分布均匀性指标 范围为21~48;轴流风机能耗指标 范围为2.1~4.4;与之对应的控制变量范围有湿帘冷凝温度为295.3~299.7 K,轴流风机出口风速为2.8~5.4 m/s。
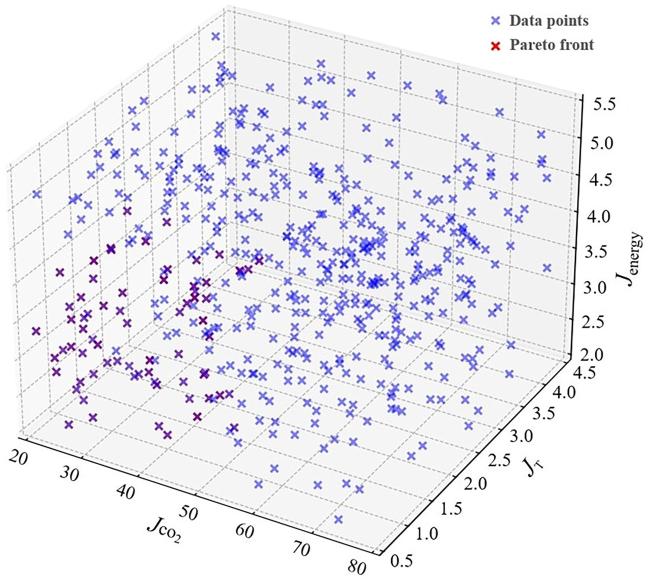
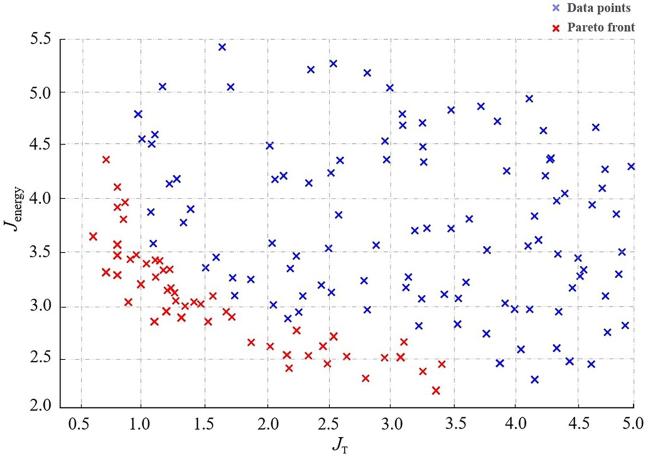
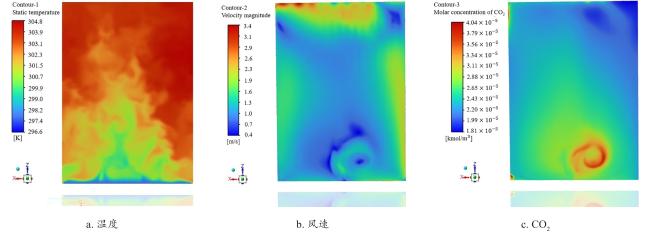
图10 温室多环境因子优化研究工况A分布云图Fig. 10 Multi environmental factors optimization research on distribution cloud map of condition A in greenhouse |
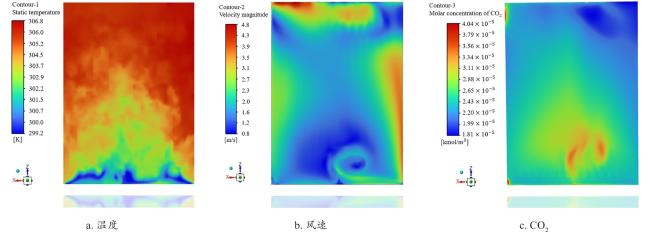
如表3所示,将两组工况进行对比,在工况A的控制变量下,温室内部的整体温度相对较低,更能满足作物生长所需的适宜环境,但受限于风机出口速度,湿帘一侧的CO2注入后存在明显的滞留积聚现象;而在工况B的控制变量下,由于风机风速较高,一定程度上缓解了CO2的堆积问题,使其在作物区域的扩散更加均匀,但同时也由于作物遮挡,加剧了温室内气流在两侧空隙壁面的运动,形成相对明显的梯度变化。显然,工况A和工况B分别就能耗与环境均匀性进行了侧重优化,但相较于初始工况下的3类评价函数,二者均有效降低了3类目标函数的评价值。
表3 温室多环境因子优化效果Table 3 Optimization effect of multiple environmental factors in greenhouse |
| 工况类型 | |||
|---|---|---|---|
| 初始工况 | 4.74 | 63 | 5.6 |
| 工况A | 1.49 | 37 | 2.7 |
| 工况B | 2.36 | 26 | 3.5 |
为进一步证明优化策略的可行性,试验选择某相似外界条件下的温室内环境作为调控对象,以工况A[296 K,3.5 m/s]作为风机-湿帘系统的运行参数,待运行30 min后采集各测点的温度,并与初始工况[300 K, 5.5 m/s]下的数据进行对比,如图12所示。
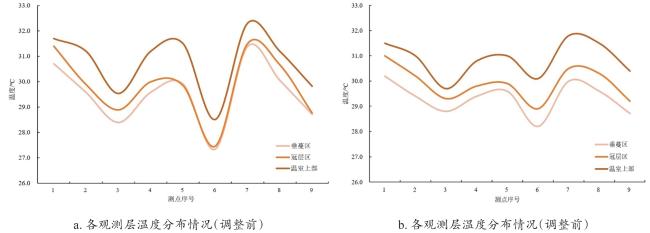
经过实际验证可知,本研究提出的优化策略可以在一定程度上改善温室环境的空间分布均匀性,温室南北两侧的温差幅度减小,各高度下的温度分布均趋于平缓。因此,基于CFD与MOPSO搭建的联合优化框架对夏季Venlo型温室的机械通风策略进行调控是可行的。对结果输出的理论范围内的最优解集进行任意组合,可以在适当牺牲其他次要目标的基础上,实现对主要关注目标的优化。
4 结 论
本研究建立了温室CFD环境模型,通过对环境温度、风速及CO2浓度分布情况进行模拟与实测值对比验证,平均相对误差在期望范围内,表明建立模型有效,后续对环境参数进行系统优化是可行的。基于此,该研究结合MOPSO与CFD对温室环境因子进行了优化,得到了两个控制变量的调控范围:风机出口风速为[2.8 m/s,5.4 m/s],湿帘冷凝温度为[295.3 K,299.7 K];并通过Pareto前沿解集进行可视化呈现,对策略调节方案具有参考价值。试验后期在上述范围内选取两组控制变量作为边界条件进行了仿真模拟,经过Fluent后处理的云图分布可以看出,温室环境参数的均匀性得到了改善,同时降低了风机能耗,两种工况的评价函数均优于初始工况;将其中一组控制变量作为实际温室的环控运行参数,对优化后的各测点温度进行测定,经过与初始工况下的相应测点进行对比发现,各分层的环境波动幅度减小,进一步证明了该策略的可行性。
温室环境精准调控技术是设施农业节能增效的核心环节,但中国在环境多维参数协同控制领域与荷兰、以色列等国家存在显著代际差距,尚未能实现温度、湿度、CO2浓度等参数的厘米级定位调控与分钟级动态响应,以空间均一化为主的调控方式会导致非目标区域的能源过度消耗,该现象在现代高肩温室中尤为突出。而本研究提出的优化策略完善了传统均匀性理论在垂直维度调控方面的不足,同时其闭环迭代算法建立了边界条件与目标参数的动态映射关系,有效提升了CFD的仿真收敛速度,便于后期建立不同环境条件下调控设备的合理运行参数库。将面向诸多历史环境得到的优化策略集应用于未来相似环境的即时调控,可以有效弥补当前CFD技术多用于仿真模拟,无法实时控制的不足,对该技术领域的深入研究具有一定的参考价值。
相应地,该优化策略所自定义的3类环境评价函数在权重设置上的研究还有所不足,即当目标函数中至少有一个为非支配关系时便视作最优方案,但各方案中满足关系的目标函数个数可能不同,真实反映的优化效果也应有所差异,因此在后续优化某一目标函数时,需要进一步量化对其余函数的耦合作用,以保证多目标函数优化的整体性。


