


0 引 言
近年来,深度学习技术的发展为复杂环境下的目标检测和关键点提取[15, 16]带来了突破性的进展,尤其是在人体姿态检测领域,基于关键点的骨架提取方法得到了广泛应用。这类方法能够在复杂背景中准确提取人体各关节位置,并进一步重建人体骨架[17-19]。本研究借鉴这一思路,将深度学习的关键点检测技术拓展应用于田间玉米骨架的提取中,以期在复杂的田间环境下实现高效且精确的骨架识别。关键点检测方法主要分为两种逻辑:自下而上和自上而下。自下而上的方法通过热图检测整张图像中的所有关键点,并依赖像素级非极大值抑制(Non-Maximum Suppression, NMS)、线积分、分组等后处理操作来提升关键点预测精度[20, 21]。然而,这类方法的后处理步骤不可微分,难以端到端训练,同时推理速度较慢[22]。自上而下的方法则依赖于目标检测[23, 24],首先在图像中定位出每个目标实例的区域,然后在这些候选区域内执行独立的关键点检测。尽管这种方法在部分场景下表现良好,但面对密集种植的玉米环境,其性能可能受到目标检测阶段精度的限制,尤其是叶片遮挡和目标粘连的情况下。
基于以上分析,本研究旨在解决田间玉米骨架提取中的核心问题:1)提高骨架提取的效率,以满足玉米表型数据获取的需求;2)优化玉米植株的形态描述,以适应任务导向的具体需求;3)应对密集种植作物的遮挡问题,以提升模型的检测精度;4)结合空间几何信息,实现株高、叶龄、叶长等表型参数测量应用。为此,本研究提出了一种改进的基于YOLOv11-Pose的多目标关键点检测网络用于田间玉米植株的骨架提取。该方法以自上而下的多目标关键点检测框架为基础,结合适用于玉米骨架的关键点表示方法,并在网络结构中引入了单头自注意力机制与卷积注意力机制,旨在引导模型关注难以分辨的粘连和遮挡区域。通过这一改进方法增强模型在复杂环境下的鲁棒性和精度,为田间玉米生产数据获取提供技术保障。
1 材料与方法
1.1 玉米图像数据集
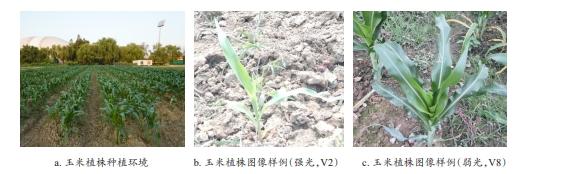
本研究所涉及的玉米图像数据集于2024年8月至9月在中国杭州市浙江大学农业试验基地采集,涵盖玉米植株从苗期至穗期的生长阶段,包括V2(第二叶完全展开时期)至V9(第九叶完全展开时期)共八个关键生长时期。数据采集采用Microsoft公司的Azure Kinect DK相机,该相机配备了1 200万像素的RGB传感器和深度传感器,能够拍摄最高分辨率为3 840×2 160像素的高质量RGB图像和深度图像。为增强数据集的多样性和实际应用价值,反映玉米作物在大田种植环境下存在的光照变化、复杂背景、叶片遮挡等问题,分别在强光照射(正午)和弱光照射(傍晚)条件下,以俯视、斜视和平视等不同角度拍摄玉米植株图像,共获得300张RGB图像及深度图像。玉米图像数据集采集环境如图1a所示。图1b展示了数据集中强光条件下V2时期的玉米植株样例,图1c展示了弱光条件下V8时期的玉米植株样例。可以看出,采集图像的光照条件变化显著,背景复杂,主要包括其他玉米植株、杂草及土壤。在苗期,植株叶片的遮挡较少;而接近穗期时,植株叶片数量显著增多,叶面积增大,叶片间的相互遮挡现象也更加明显。
使用labelme软件对玉米植株骨架进行关键点标注。对图像中清晰可见结构的玉米植株进行标注。玉米植株的骨架分为两个部分:主干和叶片。主干的初始点是图像中玉米植株根部与土壤交接的位置,随后沿着茎秆上升,直至到达最新叶片的叶鞘位置,每株玉米仅可标注1个主干实例。每个叶片实例的初始点由主干上当前叶片所属叶鞘发起,沿叶脉标注关键点,若叶脉不可见则沿着玉米叶片中心标注,形成的连接线需基本符合叶片走势,直至叶片的末端。主干及叶片可能被其他结构遮挡,标注时则依据实例在未遮挡部分的走向填补遮挡部分关键点。根据实例在图像上呈现的大小,以及形状的复杂程度,标注3—10个关键点。
随后,提取每组关键点形成的边界框。由此,数据集共包括300张玉米植株RGB图像,2 999个实例边界框标注,以及20 512个关键点标注,以描述玉米图像的骨架。
1.2 图像扩增与关键点均匀采样
为了提升模型的泛化能力,本研究对原始图像数据集进行了图像扩增处理,将300张原始RGB图像扩增至500张。扩增方法包括旋转、翻转、亮度调整和裁剪等操作,旨在增加数据的多样性,增强模型对不同场景(如光照、视场的变化)的适应性。同时,为适配通用关键点检测框架的需求并提升对玉米叶片形态的描述能力,进行了关键点均匀采样操作。
在传统关键点检测框架中,如文献[8]中定义的叶连接点、叶最高点、叶角点、叶尖点作为叶片的关键点,虽然能够满足基础检测需求,但稀疏的关键点定义难以全面反映形态复杂的玉米叶片特征(如弯折或卷曲的叶片)。为解决这一问题,本研究基于原有标注的关键点,将每个实例的关键点连接线进行均匀采样,从而构建标准化玉米关键点数据集。
为研究采样点数量对骨架提取效果的影响,设置了2、3、4、5、10和20个不同采样点数量的均匀采样方案。通过均匀采样,每个主干和叶片实例均被定义为包含特定数量关键点的结构,这些关键点以实例的相对位置为参考,形成一致性的描述标准。
1.3 基于改进YOLOv11-Pose的关键点检测
1.3.1 改进YOLOv11-Pose网络框架
YOLO(You Only Look Once)系列模型以其高效的实时检测能力成为计算机视觉领域的标杆。最新版本YOLOv11在前几代模型的基础上进行了多项改进,以提升检测性能。特别是在关键点检测任务中,这些改进对于提高模型的检测精度和处理效率具有重要意义。YOLOv11的改进架构引入了C3K2块、空间金字塔快速池化(Spatial Pyramid Pooling Fast, SPFF)、C2PSA(Cross-stage Partial Spatial Attention)等模块,通过更高效的结构设计,进一步增强了小目标检测能力,同时保持了YOLO系列模型以实时推理速度著称的优势。
YOLOv11的骨干网络使用C3K2块来处理不同阶段的特征提取。相比传统3×3卷积核,C3K2块以更小的计算开销保留了模型捕获图像基本特征的能力。这种结构既有效减少了计算复杂度,又能在复杂场景中保持高效的特征提取性能。
在颈部网络中,SPFF模块通过不同尺度汇集图像特征,增强模型在多尺度物体检测中的表现能力。C2PSA模块则进一步强调特征图中的空间相关性,确保特征在空间维度上的一致性。
检测头的设计采用了自上而下的检测策略,以实现从目标框到关键点的逐步精确检测。具体而言,检测头首先执行目标框检测,确定目标区域后,将边界框的特征信息进一步传递至关键点检测模块。在这一过程中,检测头在边界框内生成热力图,表示每个可能关键点的置信度分布,并利用特征图的多层次语义信息逐层推理关键点位置,最终实现关键点的精确定位。该设计依托于三个不同尺度的检测头,分别处理小、中、大目标的特征,同时通过多尺度特征融合,增强关键点检测的鲁棒性和准确性。P3/8小目标检测头处理分辨率较高的特征图,用于识别小目标。在玉米骨架提取任务中,这一层能够高效捕捉叶片尖端或弯折部位的细节特征,是关键点定位的基础。P4/16中目标检测头在相对较低的分辨率下操作,虽然空间分辨率下降,但其语义信息更丰富。此检测头能够进一步细化目标框的位置,并为后续的关键点检测提供更准确的语义上下文信息。P5/32大目标检测头具备最大的感受野,专注于全局特征的提取和处理,适用于框定较大目标区域,例如整个主干或叶片的整体轮廓。改进的YOLOv11-Pose整体网络架构如图2所示。
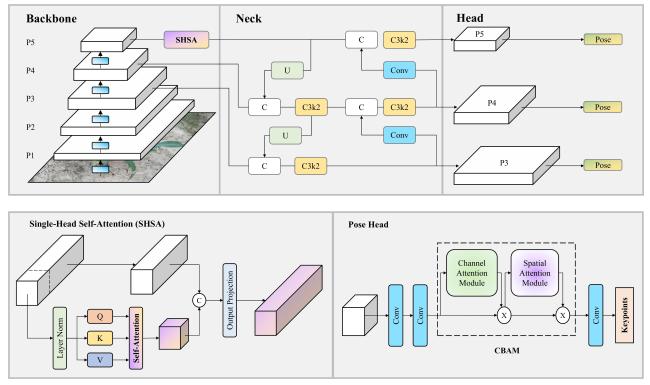
为了进一步提升模型的关键点检测性能,本研究对YOLOv11-Pose网络框架进行了两点针对性改进,包括在骨干网络的C2PSA模块后引入了单头自注意力(Single-Head Self-Attention, SHSA)机制,在关键点检测头部分添加轻量级的卷积注意力模块(Convolutional Block Attention Module, CBAM)。在骨干网络的C2PSA模块后加入SHSA机制(如图2左下部分所示),旨在减少计算冗余并提升计算效率,同时实现全局与局部信息的有效融合。SHSA模块的核心设计是仅对部分输入通道(比例为r)进行自注意力处理,这些通道代表了整个特征图中的关键信息,其余通道则保持不变,从而避免对所有通道进行注意力操作带来的冗余计算。此外,SHSA通过全通道投影机制将计算后的注意力特征传播至整个网络,使得所有通道均能受益于注意力信息。这种设计在显著降低计算复杂度的同时,增强了模型对全局上下文信息的敏感性,提高了关键点检测的精度和效率。参考Yun和Ro的设置 [25],本研究将比例r设置为1/4.67。
在关键点检测头部引入CBAM(如图2右下部分所示),旨在进一步提升特征选择能力。CBAM模块通过通道注意力(Channel Attention)和空间注意力(Spatial Attention)的联合机制,有选择性地增强与关键点检测相关的重要特征,并抑制冗余或干扰特征。具体而言,CBAM首先对特征图进行通道加权,捕获不同特征通道的全局重要性;随后,结合空间加权机制,强化特定位置的重要性,确保对关键点区域的精准检测。CBAM的轻量化设计保证了在增加检测能力的同时,不显著增加网络的计算负担。
综上,在骨干网络中引入SHSA 块能够更高效地提取全局上下文信息,而在关键点检测头中添加CBAM模块则显著增强了特征提取的针对性和检测的鲁棒性。两者相辅相成,为关键点检测任务提供了高效且稳健的特征表达能力,最终有效提升模型的检测性能。
本研究将进行图像增强与关键点均匀采样后的玉米关键点数据集以8∶2划分为训练集与测试集,测试集不包含扩增数据。选用YOLOv11m-Pose模型以平衡精度和速度,并在COCO(Microsoft Common Objects in Context)数据集上进行预训练。本研究采用训练集对模型进行300次迭代,初始学习率为1×10⁻³,动量为0.9,权重衰减为5×10⁻⁴,批大小为4的AdamW优化。模型在具有NVIDIA GeForce RTX 1080Ti GPU(显存11 GB)的工作站上使用Python 3.10.15、PyTorch 2.5.1和CUDA 11.8进行训练。
1.3.2 损失函数
全部的损失函数根据任务可分为与目标检测的相关损失函数和与关键点相关的损失函数。前者包括边界框损失、分布焦点损失、分类损失;后者包括关键点损失、关键点置信度损失。关键点损失主要衡量基于预测点与真值点位置的相似程度,可由关键点相似度(Object Keypoint Similarity, OKS)计算如公式(1) 所示。
式中:n表示第几个关键点;d为预测点到真值点的欧氏距离,像素数(pixel);s为实例尺度;k为特殊关键点权重。
总体关键点损失则可由公式(2) 计算得出:
1.4 表型参数测量
为系统评估所提出的模型在玉米植株生长信息获取方面的性能,本研究针对玉米植株的株高、叶龄和叶长三个表型参数进行了精确测量与对比分析。测量过程基于模型预测的叶片边界框和关键点骨架信息,并与人工标注的真实值进行对比验证。由于株高、叶长需要空间几何信息,在测量前需将图像数据转换为点云数据。首先利用Azure Kinect DK采集的已对齐RGB-D数据,通过RGB相机内参矩阵 K 实现二维到三维坐标的转换。内参矩阵 K 表示为公式(3) :
式中: 、 为焦距; 、 为相机中心位置。对于在图像坐标系下的像素坐标 ,结合深度值 ,通过公式(4) 转换到相机坐标系下的三维坐标 ,生成场景的三维点云。
1)株高测量方法:对三维点云模型进行基于超绿算法的颜色滤波,滤除玉米植株点云,获得地面点云数据。对地面点云数据进行平面拟合,获得地面平面法向量。在原始三维点云中遍历骨架关键点,求得距地面平面最远的关键点T ,并取主干骨架关键点的第一个点为玉米植株的最低点B 。计算T、B二点在地面平面法向量方向上的距离,即为株高测量值。
2)叶龄测量方法:通常把玉米主茎上展开叶的数目称叶龄,玉米植株的叶龄判定采用基于目标检测的计数方法实现。模型预测出单株玉米的所有展开叶片边界框,统计边界框数量即为该植株的预测叶龄。
3)叶长测量方法:叶长测量基于模型预测的叶片骨架关键点进行三维重建计算,对每个叶片骨架的关键点序列 ,依次计算相邻关键点的欧式距离,累加所得即为当前叶片的预测长度L如公式(5) 所示。
1.5 评价指标
本研究采用精度(Precision)、召回率(Recall)和平均精度(mAP)来评价模型的骨架提取性能。其中Precision、Recall可由公式(6) 和公式(7) 计算。
式中:TP为真阳性;FN为假阴性;FP为假阳性;FN为真阳性。
mAP是跨多个类和交汇比(Intersection over Union, IoU)阈值计算的平均精度。它是对象检测任务中最常见的指标,可以深入了解模型在精确度和召回率之间的平衡程度。更高的mAP值表示更好的对象定位和分类,特别是对于小的和被遮挡的对象。本研究用于评价模型的mAP值包括mAP50和mAP50-95。mAP50是将IoU固定为0.5计算得到的,mAP50-95是IoU在0.5~0.95之间的平均精度,区间为0.05。
此外,为研究关键点均匀采样形成的骨架与原始骨架的差异,本研究引入平均Fréchet距离作为评价指标。Fréchet距离是一种度量两条曲线之间相似性的指标,其本质是考虑两条曲线上点的一一对应关系,使得所有对应点之间的最大欧氏距离最小。定义曲线 和 ,Fréchet距离可表示为公式(8) 。
式中: 和 是曲线在区间[0,1]上的参数化,表示沿两条曲线移动的路径。通过动态规划计算两条曲线所有点对之间的最小化最大欧氏距离,得到Fréchet距离。进一步计算所有曲线对的平均Fréchet距离,用以量化均匀采样后的骨架与原始骨架的整体差异程度,评估均匀采样方法的有效性。
为量化株高、叶龄、叶长表型参数测量的准确性,本研究采用如下评价指标:平均绝对误差(Mean Average Error, MAE)用于衡量预测值与实际值的平均偏差;均方根误差(Root Mean Square Error, RMSE)用于衡量预测误差的离散程度;平均绝对百分比误差(Mean Absolute Percentage Error, MAPE)以百分比形式评估预测模型准确性;决定系数(R 2)反映预测值与实际值的线性相关性。计算如公式(9)~公式(12) :
式中: 是第i个预测值; 是第i个实际值; 是实际值的平均值。
2 结果与讨论
2.1 关键点均匀采样
关键点均匀采样是通过对原始标记中每个实例(如主干、叶片)的关键点进行重新采样,以形成统一的骨架结构。采样点数量分别设置为2、3、4、5、10和20个,其具体采样可视化结果如图3所示,其中每个实例以红色点为起点,以蓝色点为终点,关键点间以绿色的线顺序连接。从图3中可以看出,较少的采样点(2—5个)导致形成的骨架与原始骨架差距较大,尤其在叶片形状弯曲较明显的区域,采样骨架难以有效还原原始结构。而随着采样点数的增加,骨架形态逐渐接近原始骨架。当采样点数为10个时,骨架的形态与原始骨架基本一致,能很好地平衡骨架的完整性和形态准确性。若进一步增加采样点数(如20个),尽管骨架形态更加平滑,但部分区域的点数超过了原始骨架的点数。这种冗余关键点的引入可能导致骨架预测模型的效率降低,并增加计算开销。
图3 不同采样策略的玉米植株关键点采样效果对比Fig. 3 Comparison of keypoint sampling results on maize plants using different sampling strategies |
| 原始数据 | 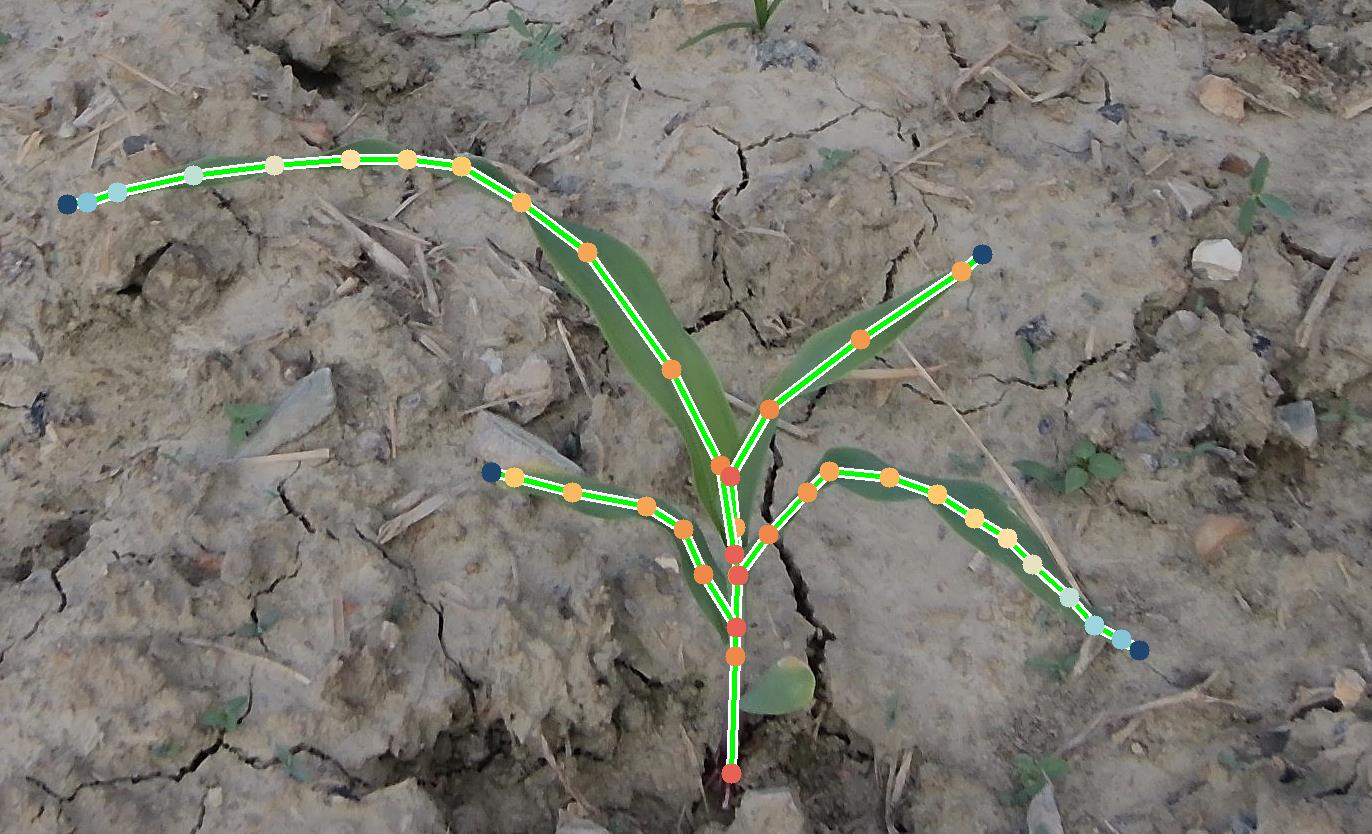 |  |  |
| 采样数:2 | 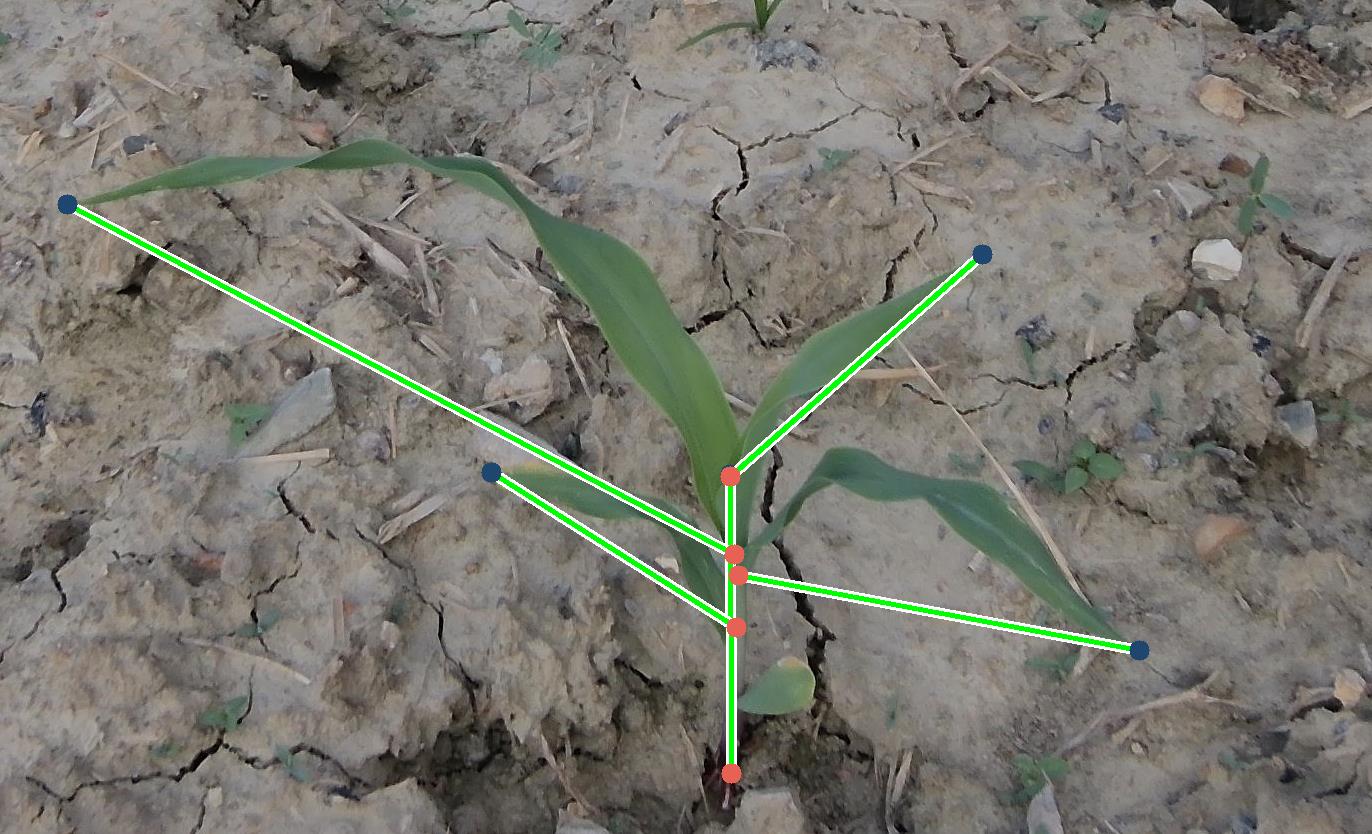 | 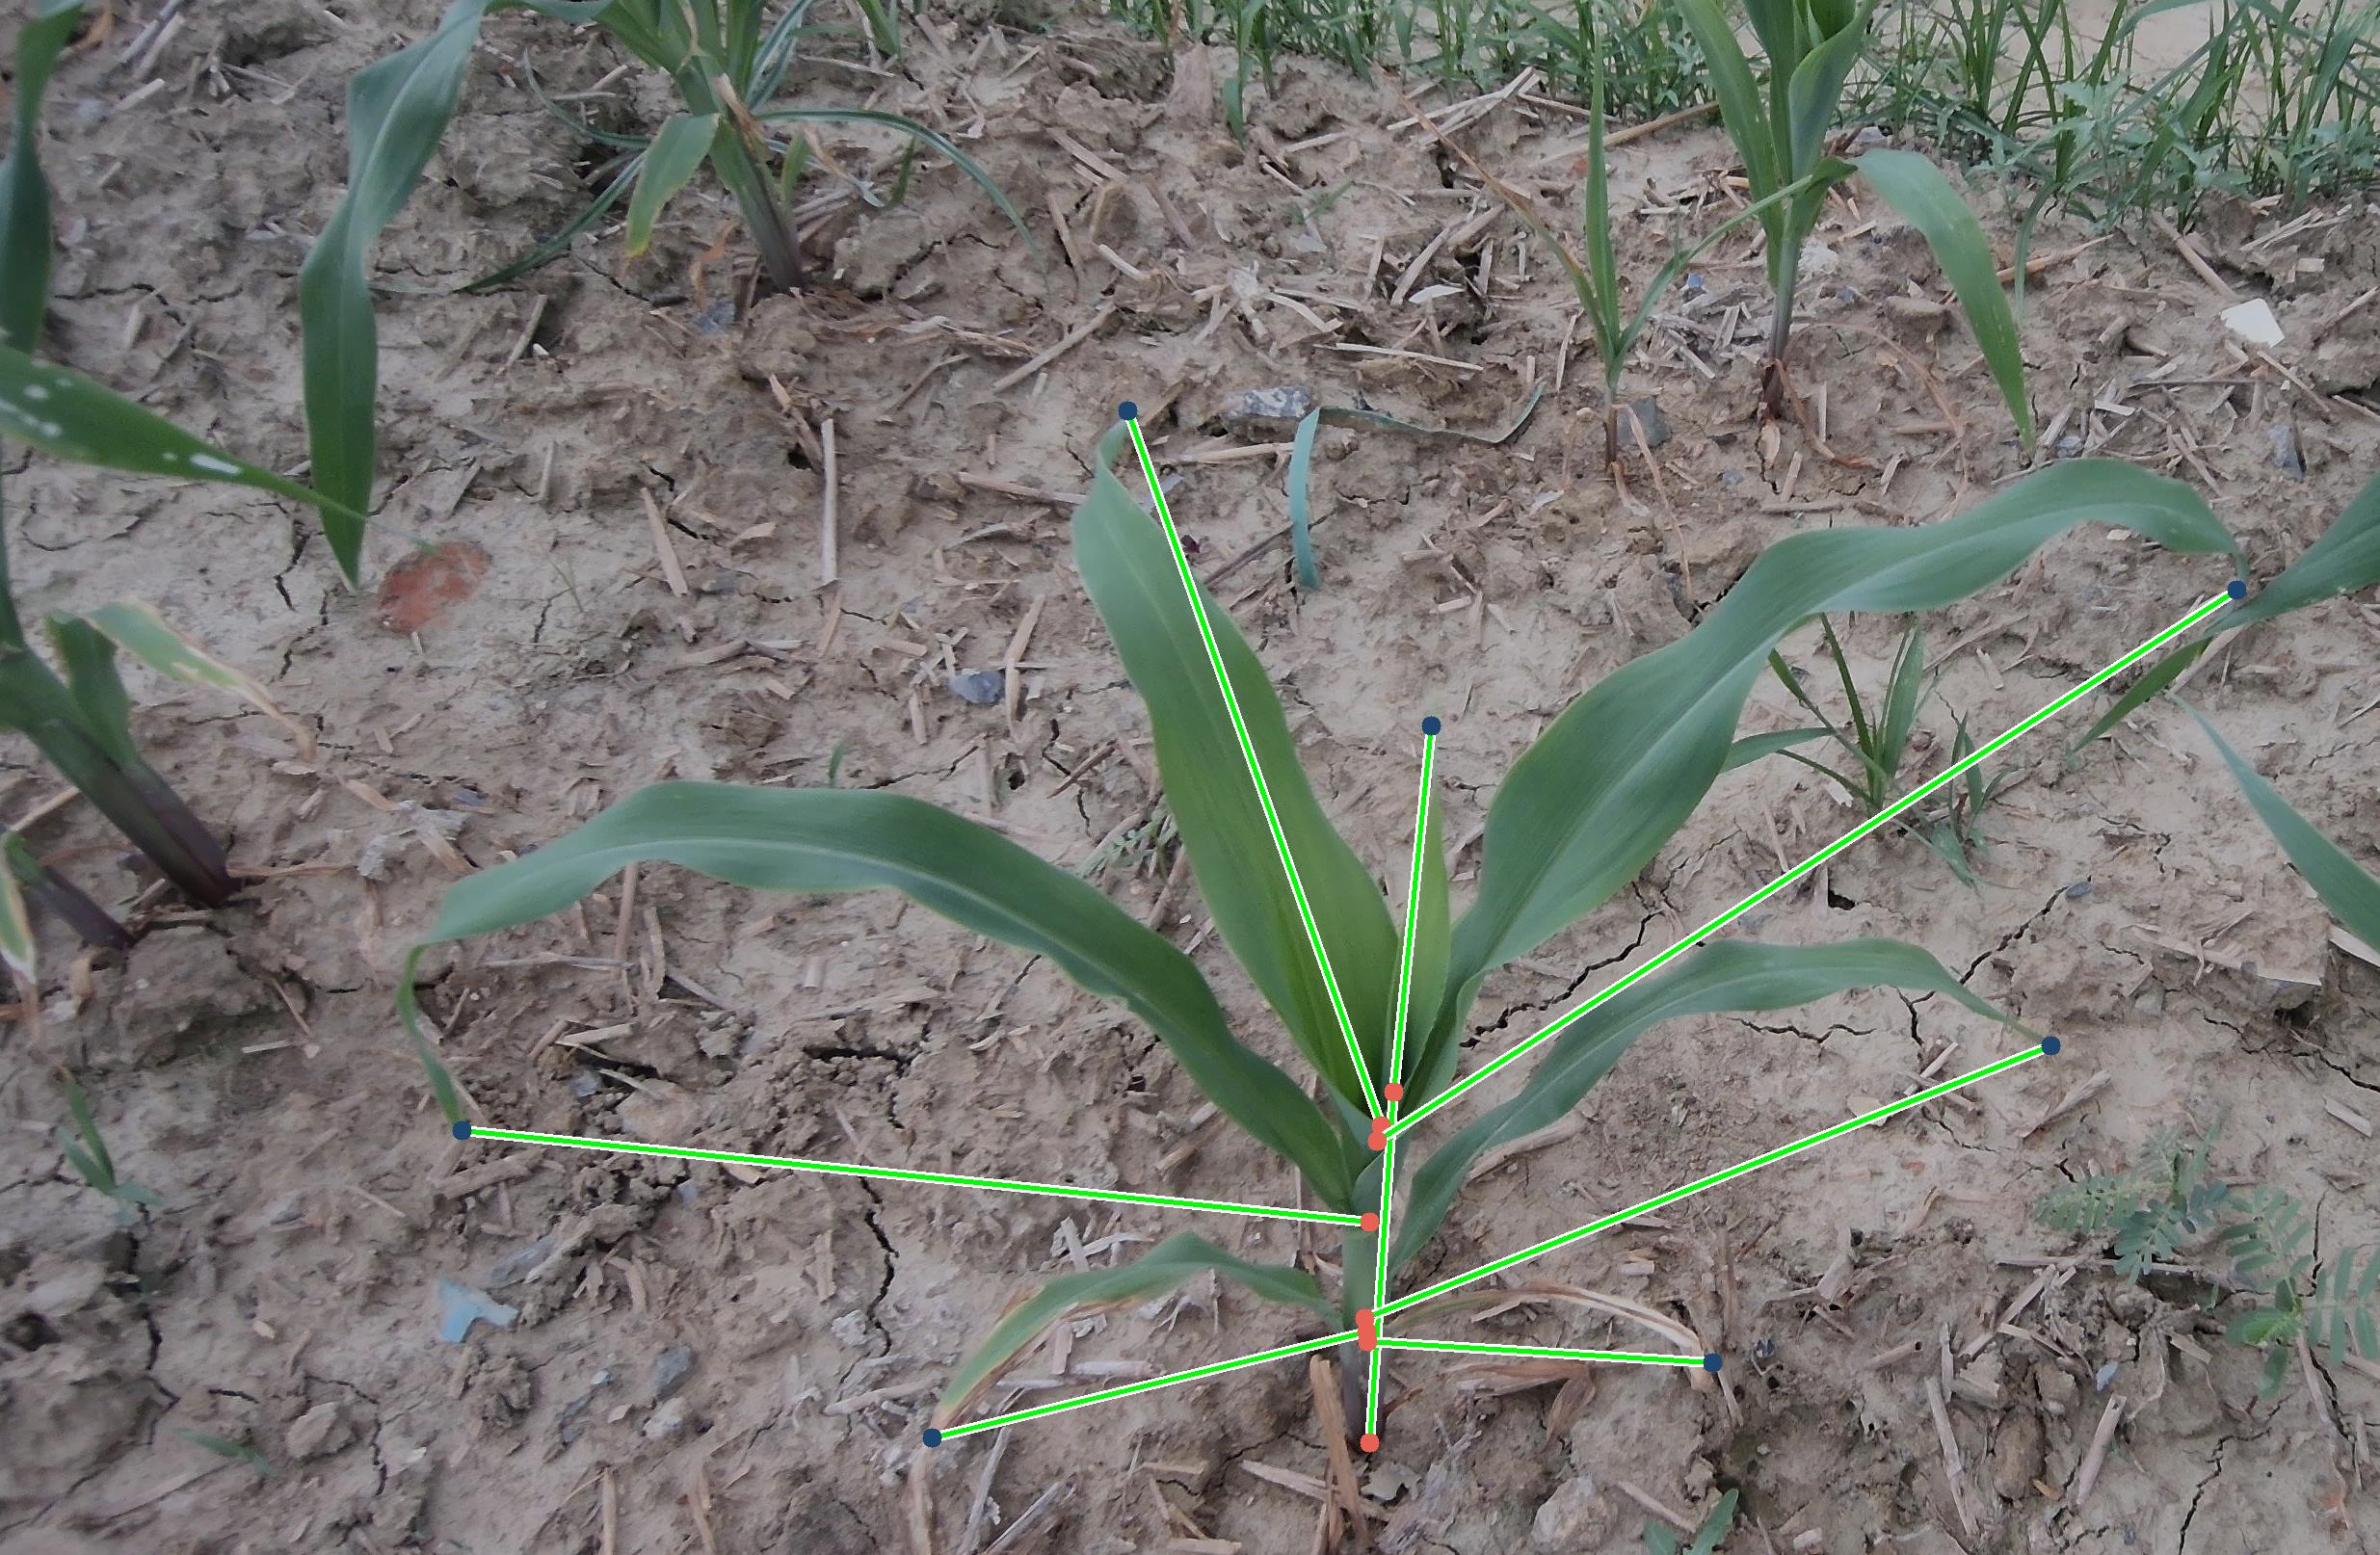 | 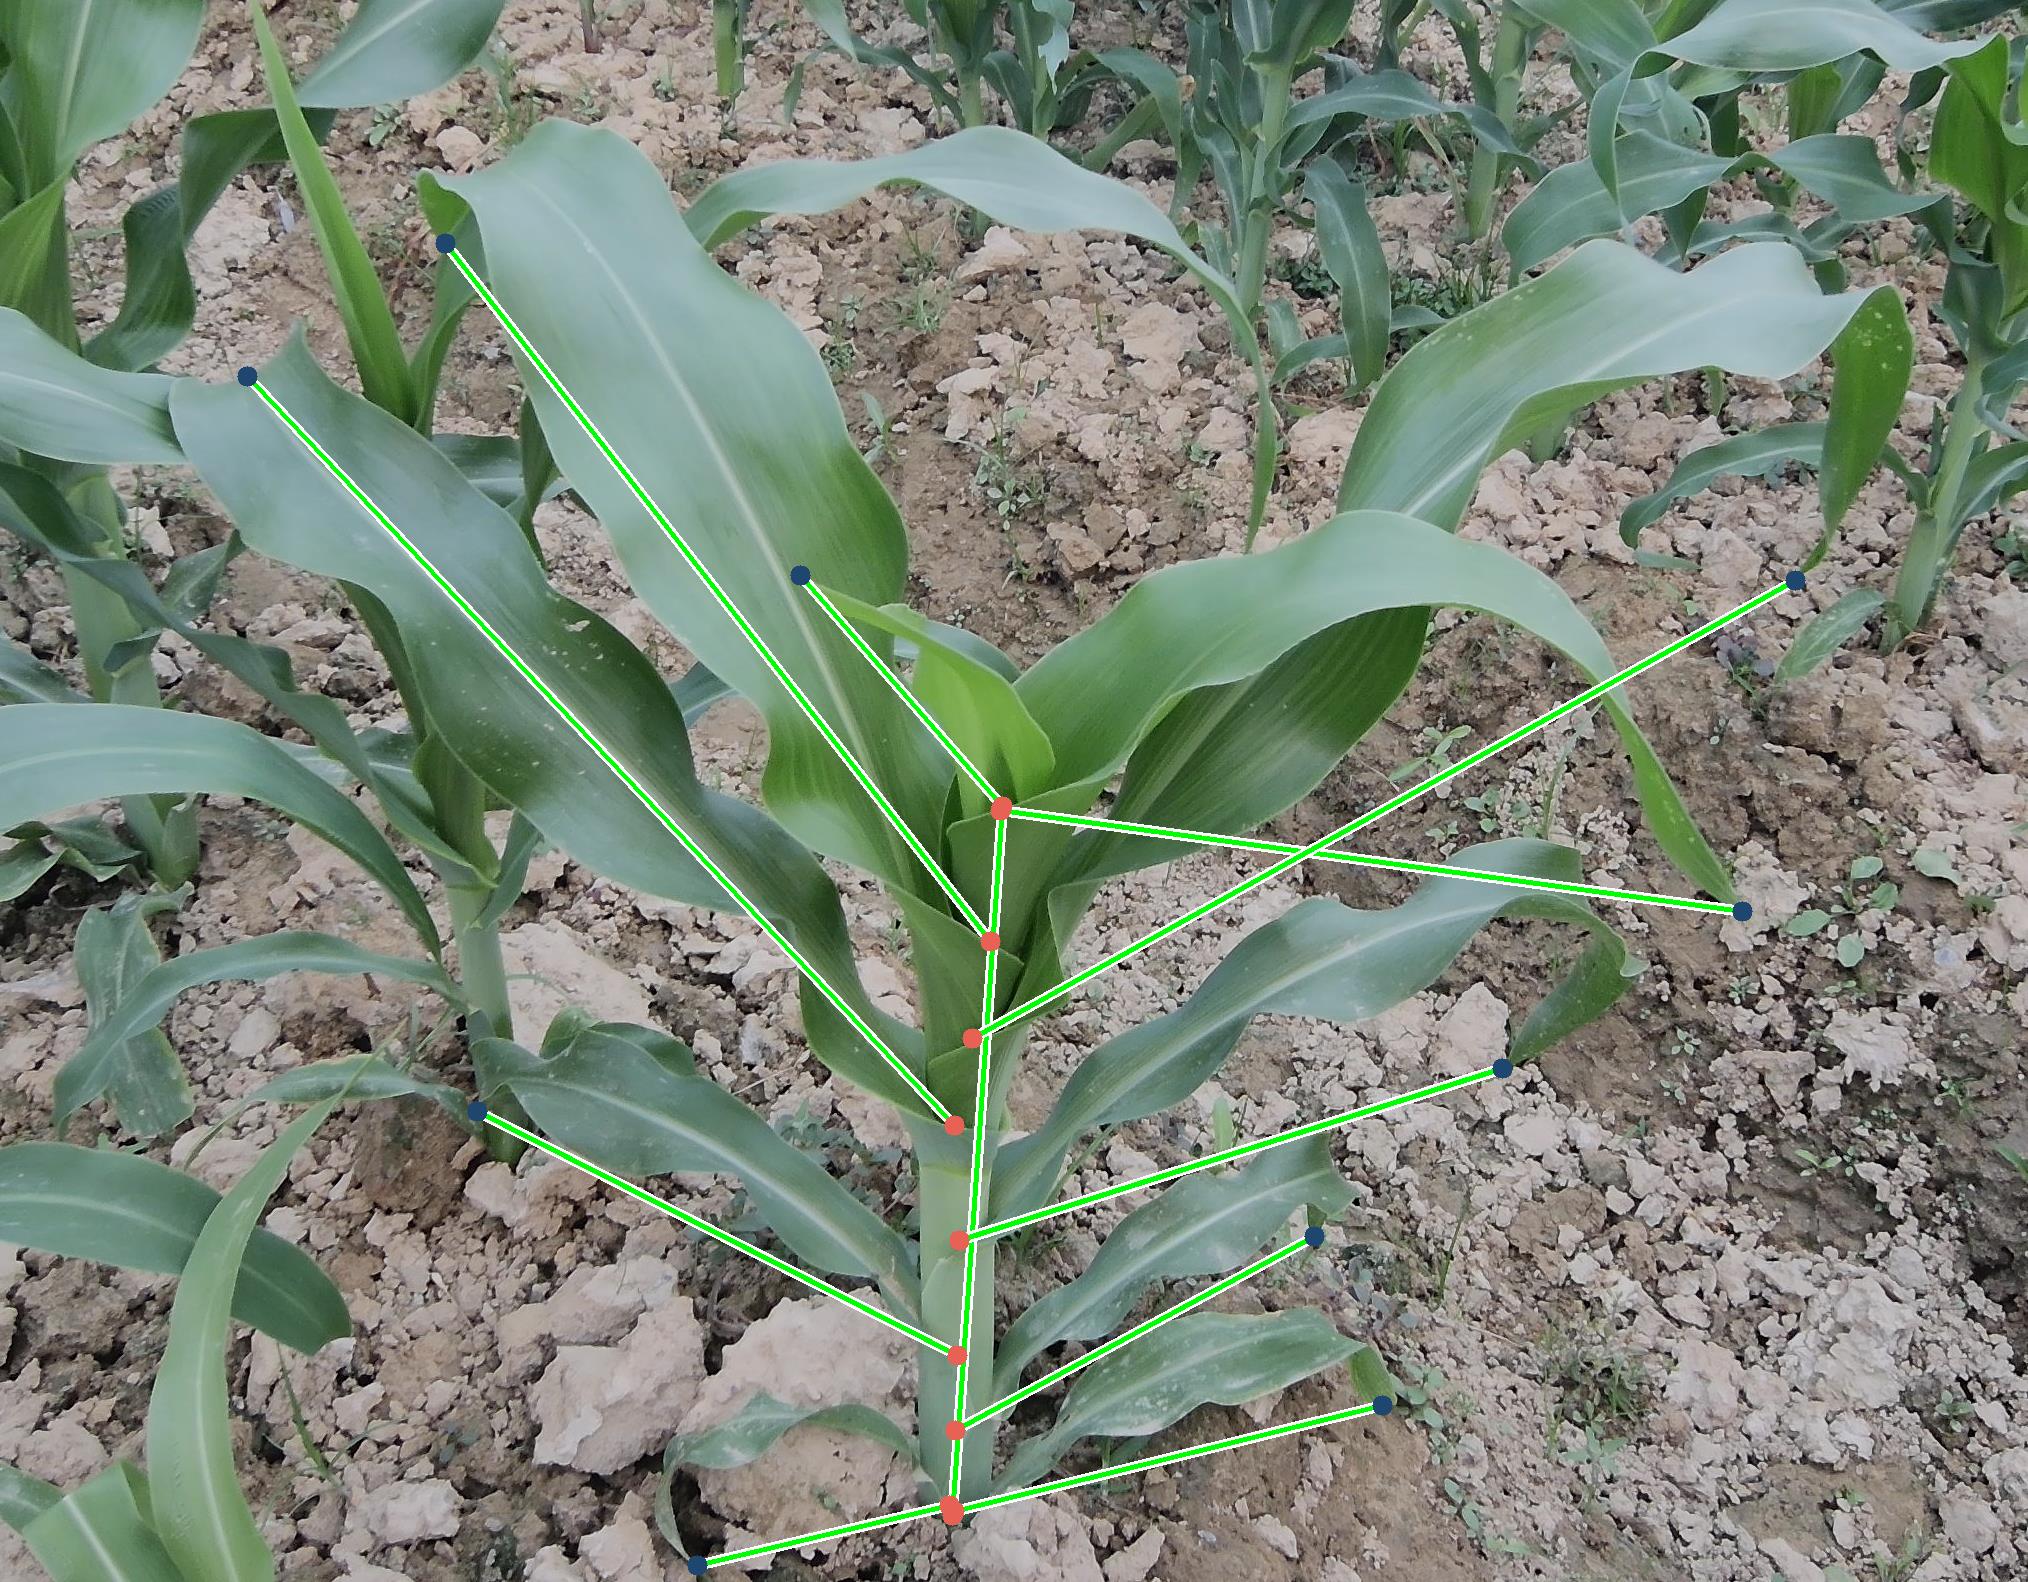 |
| 采样数:3 | 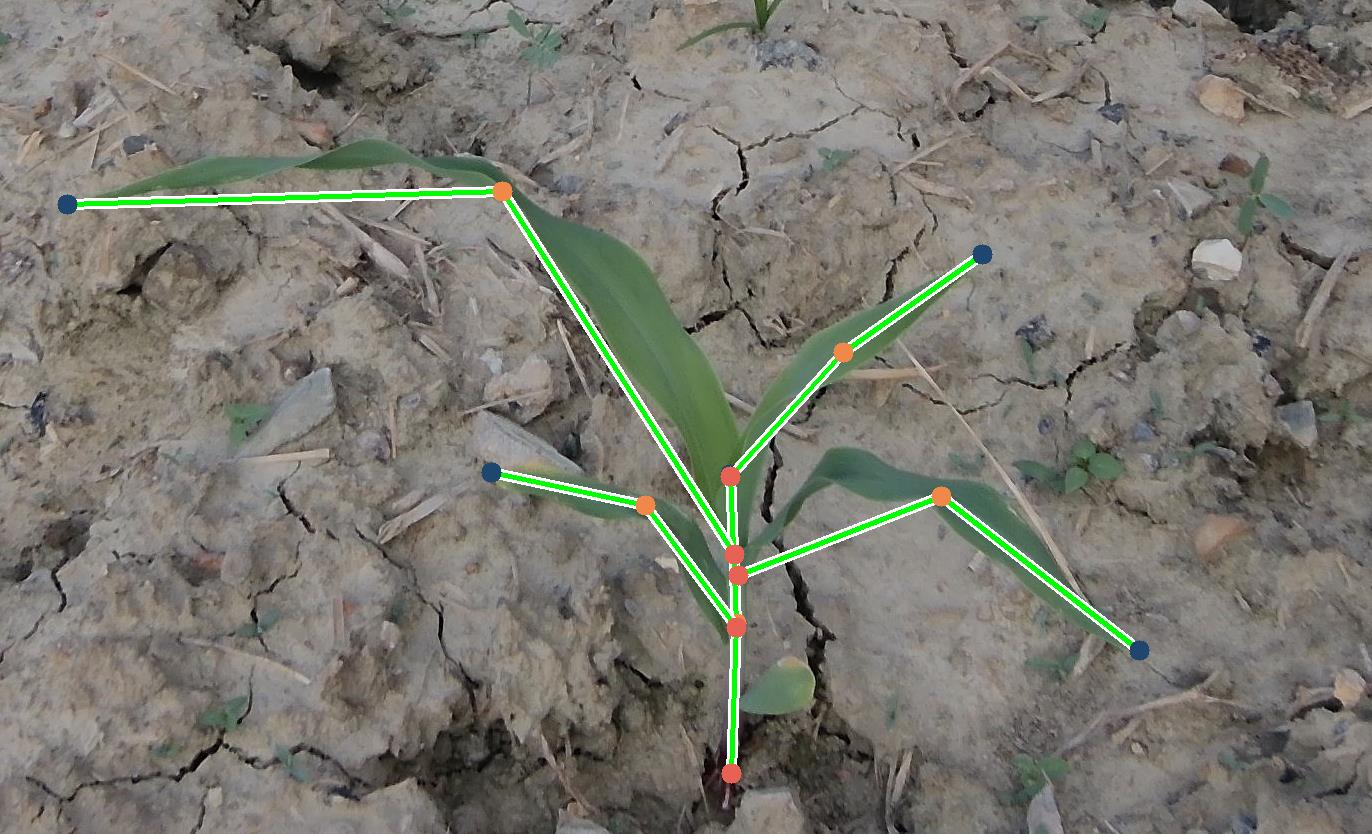 | 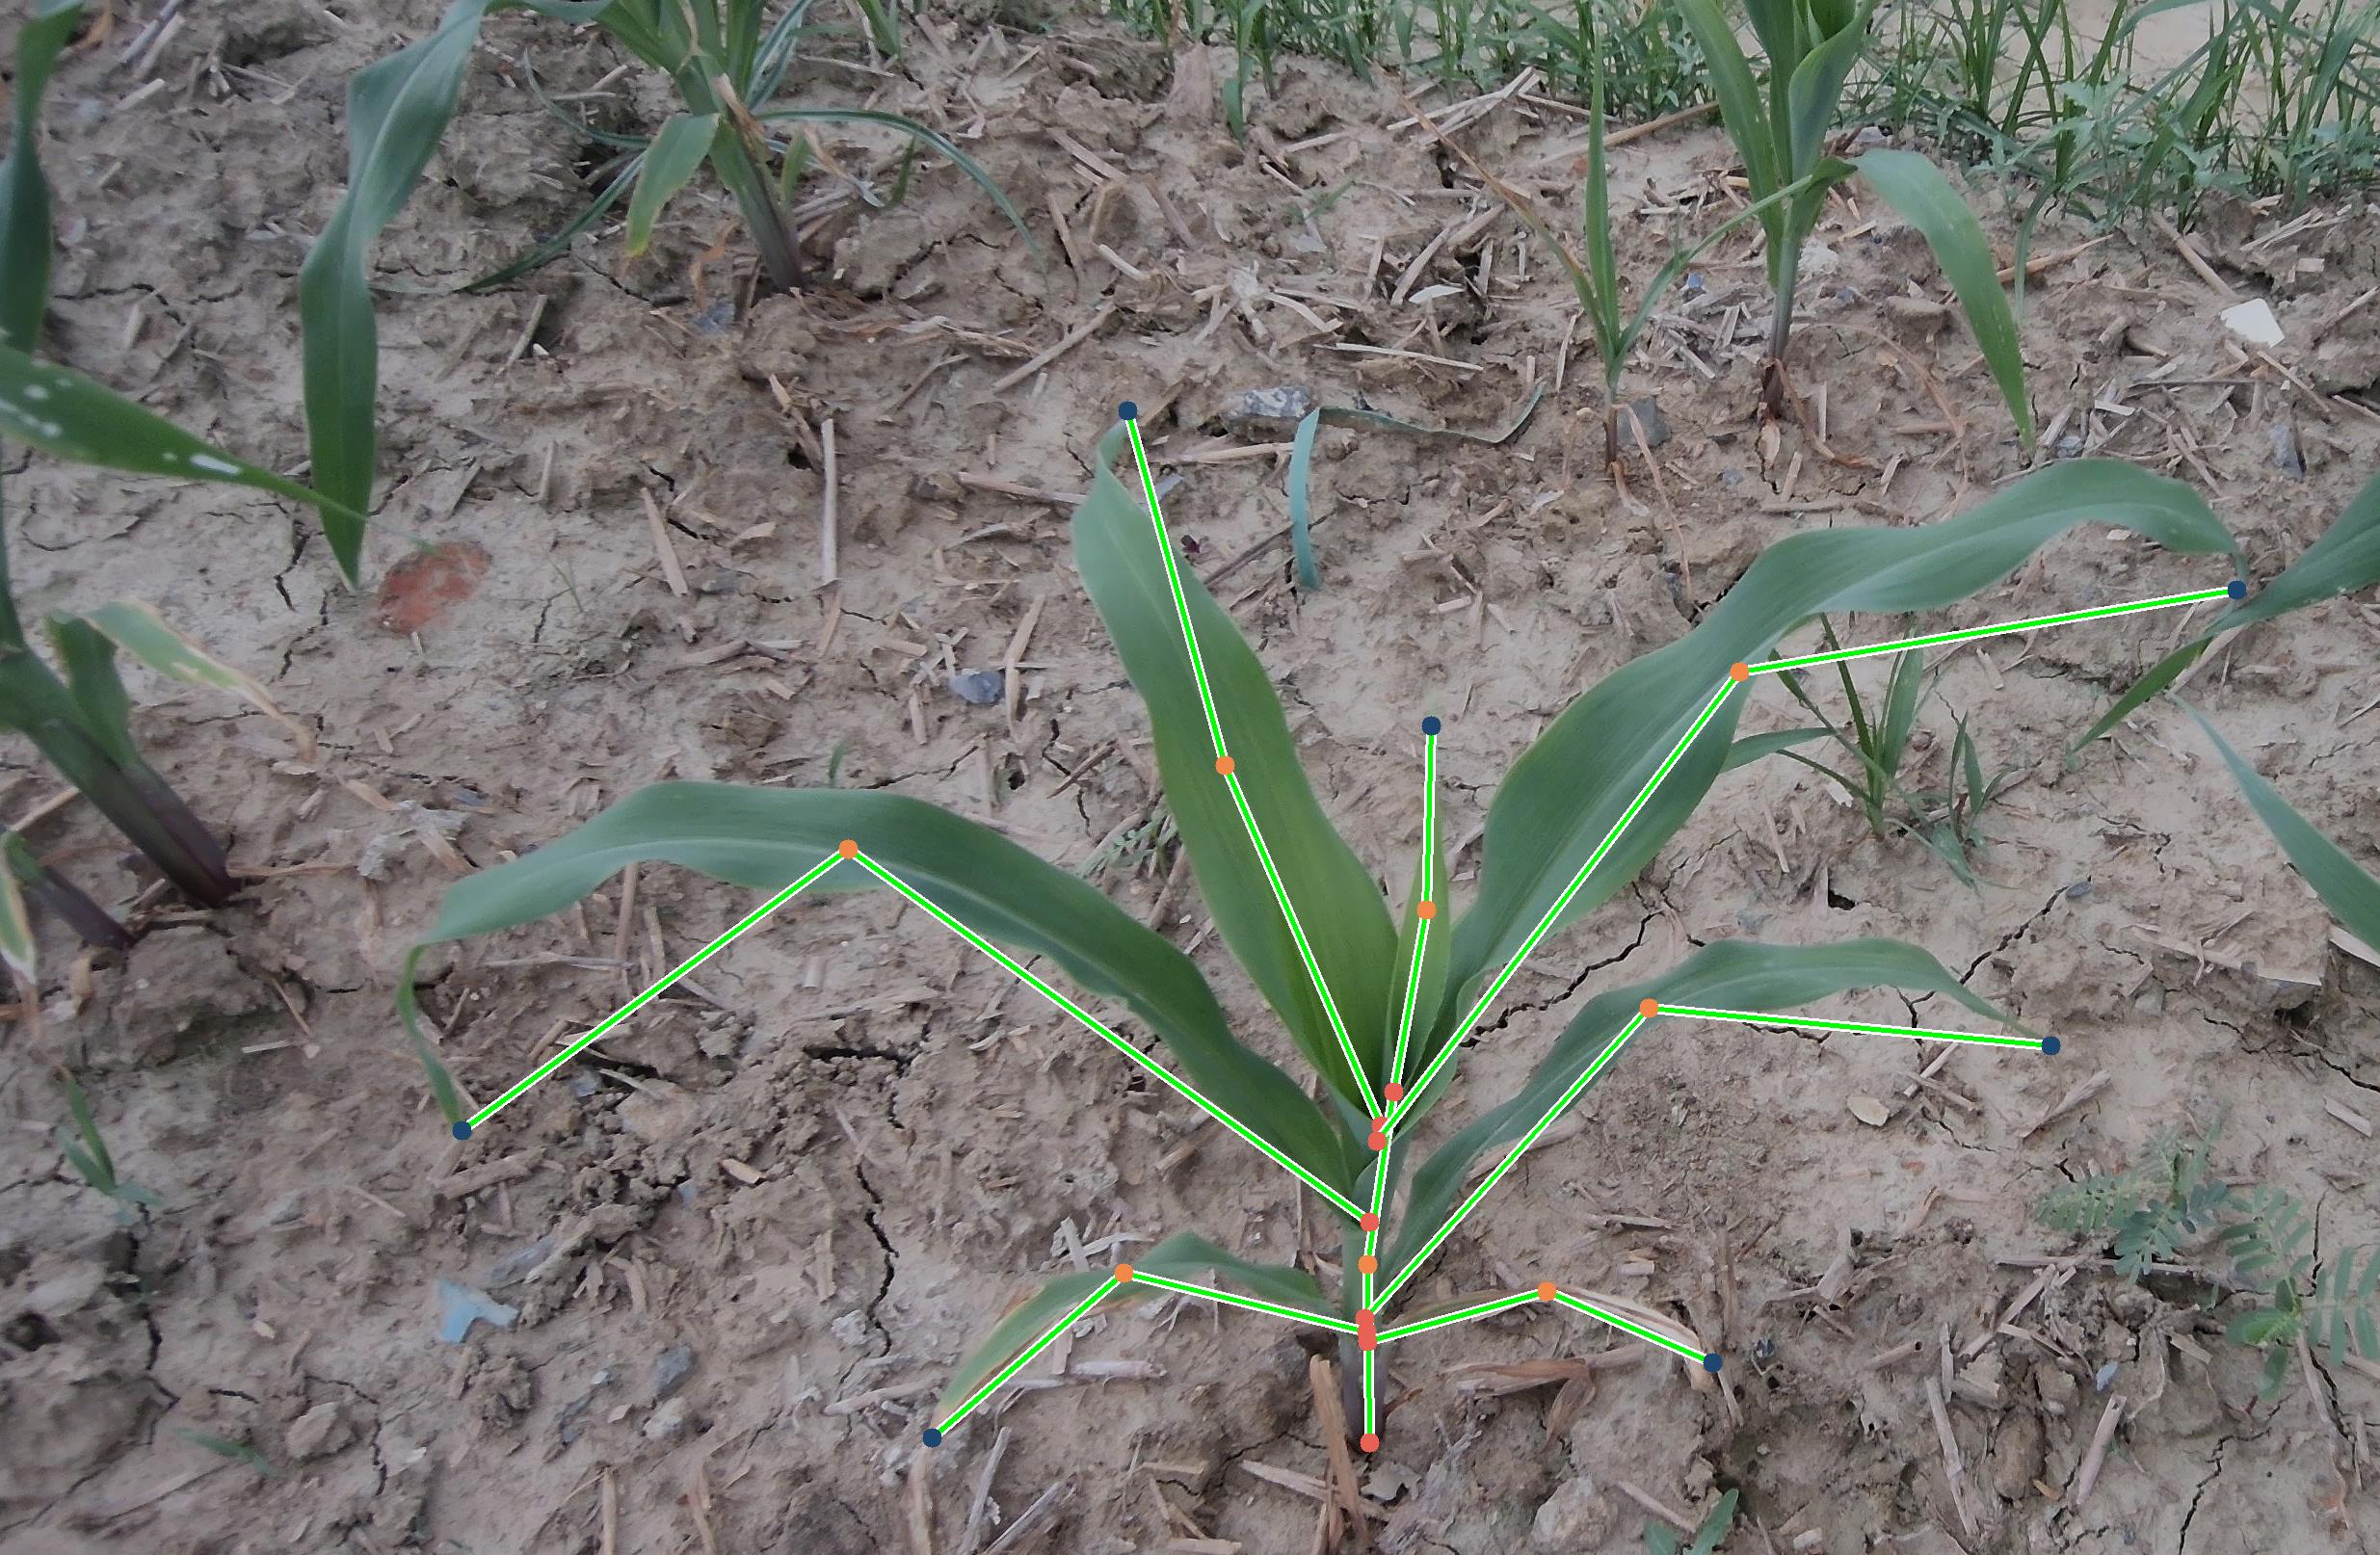 |  |
| 采样数:4 | 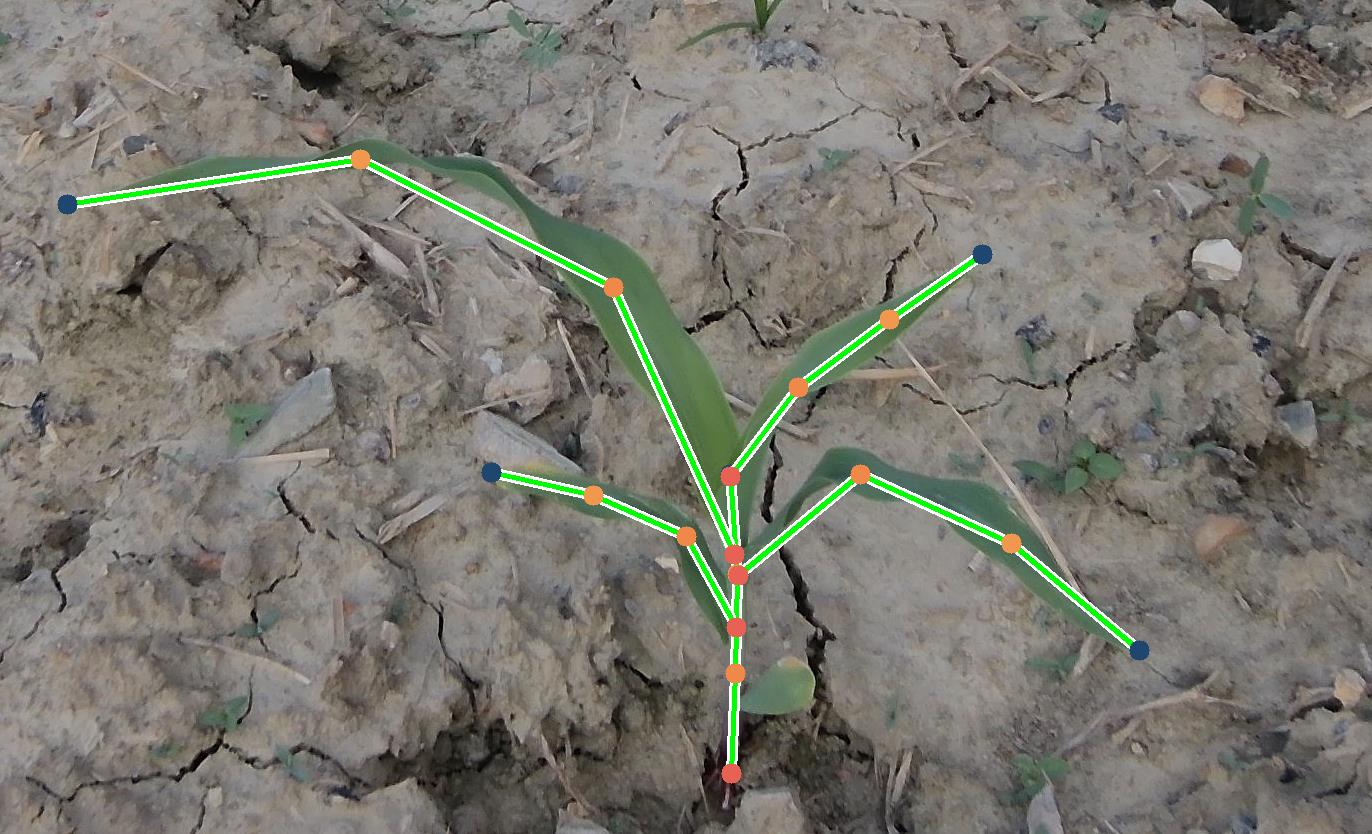 | 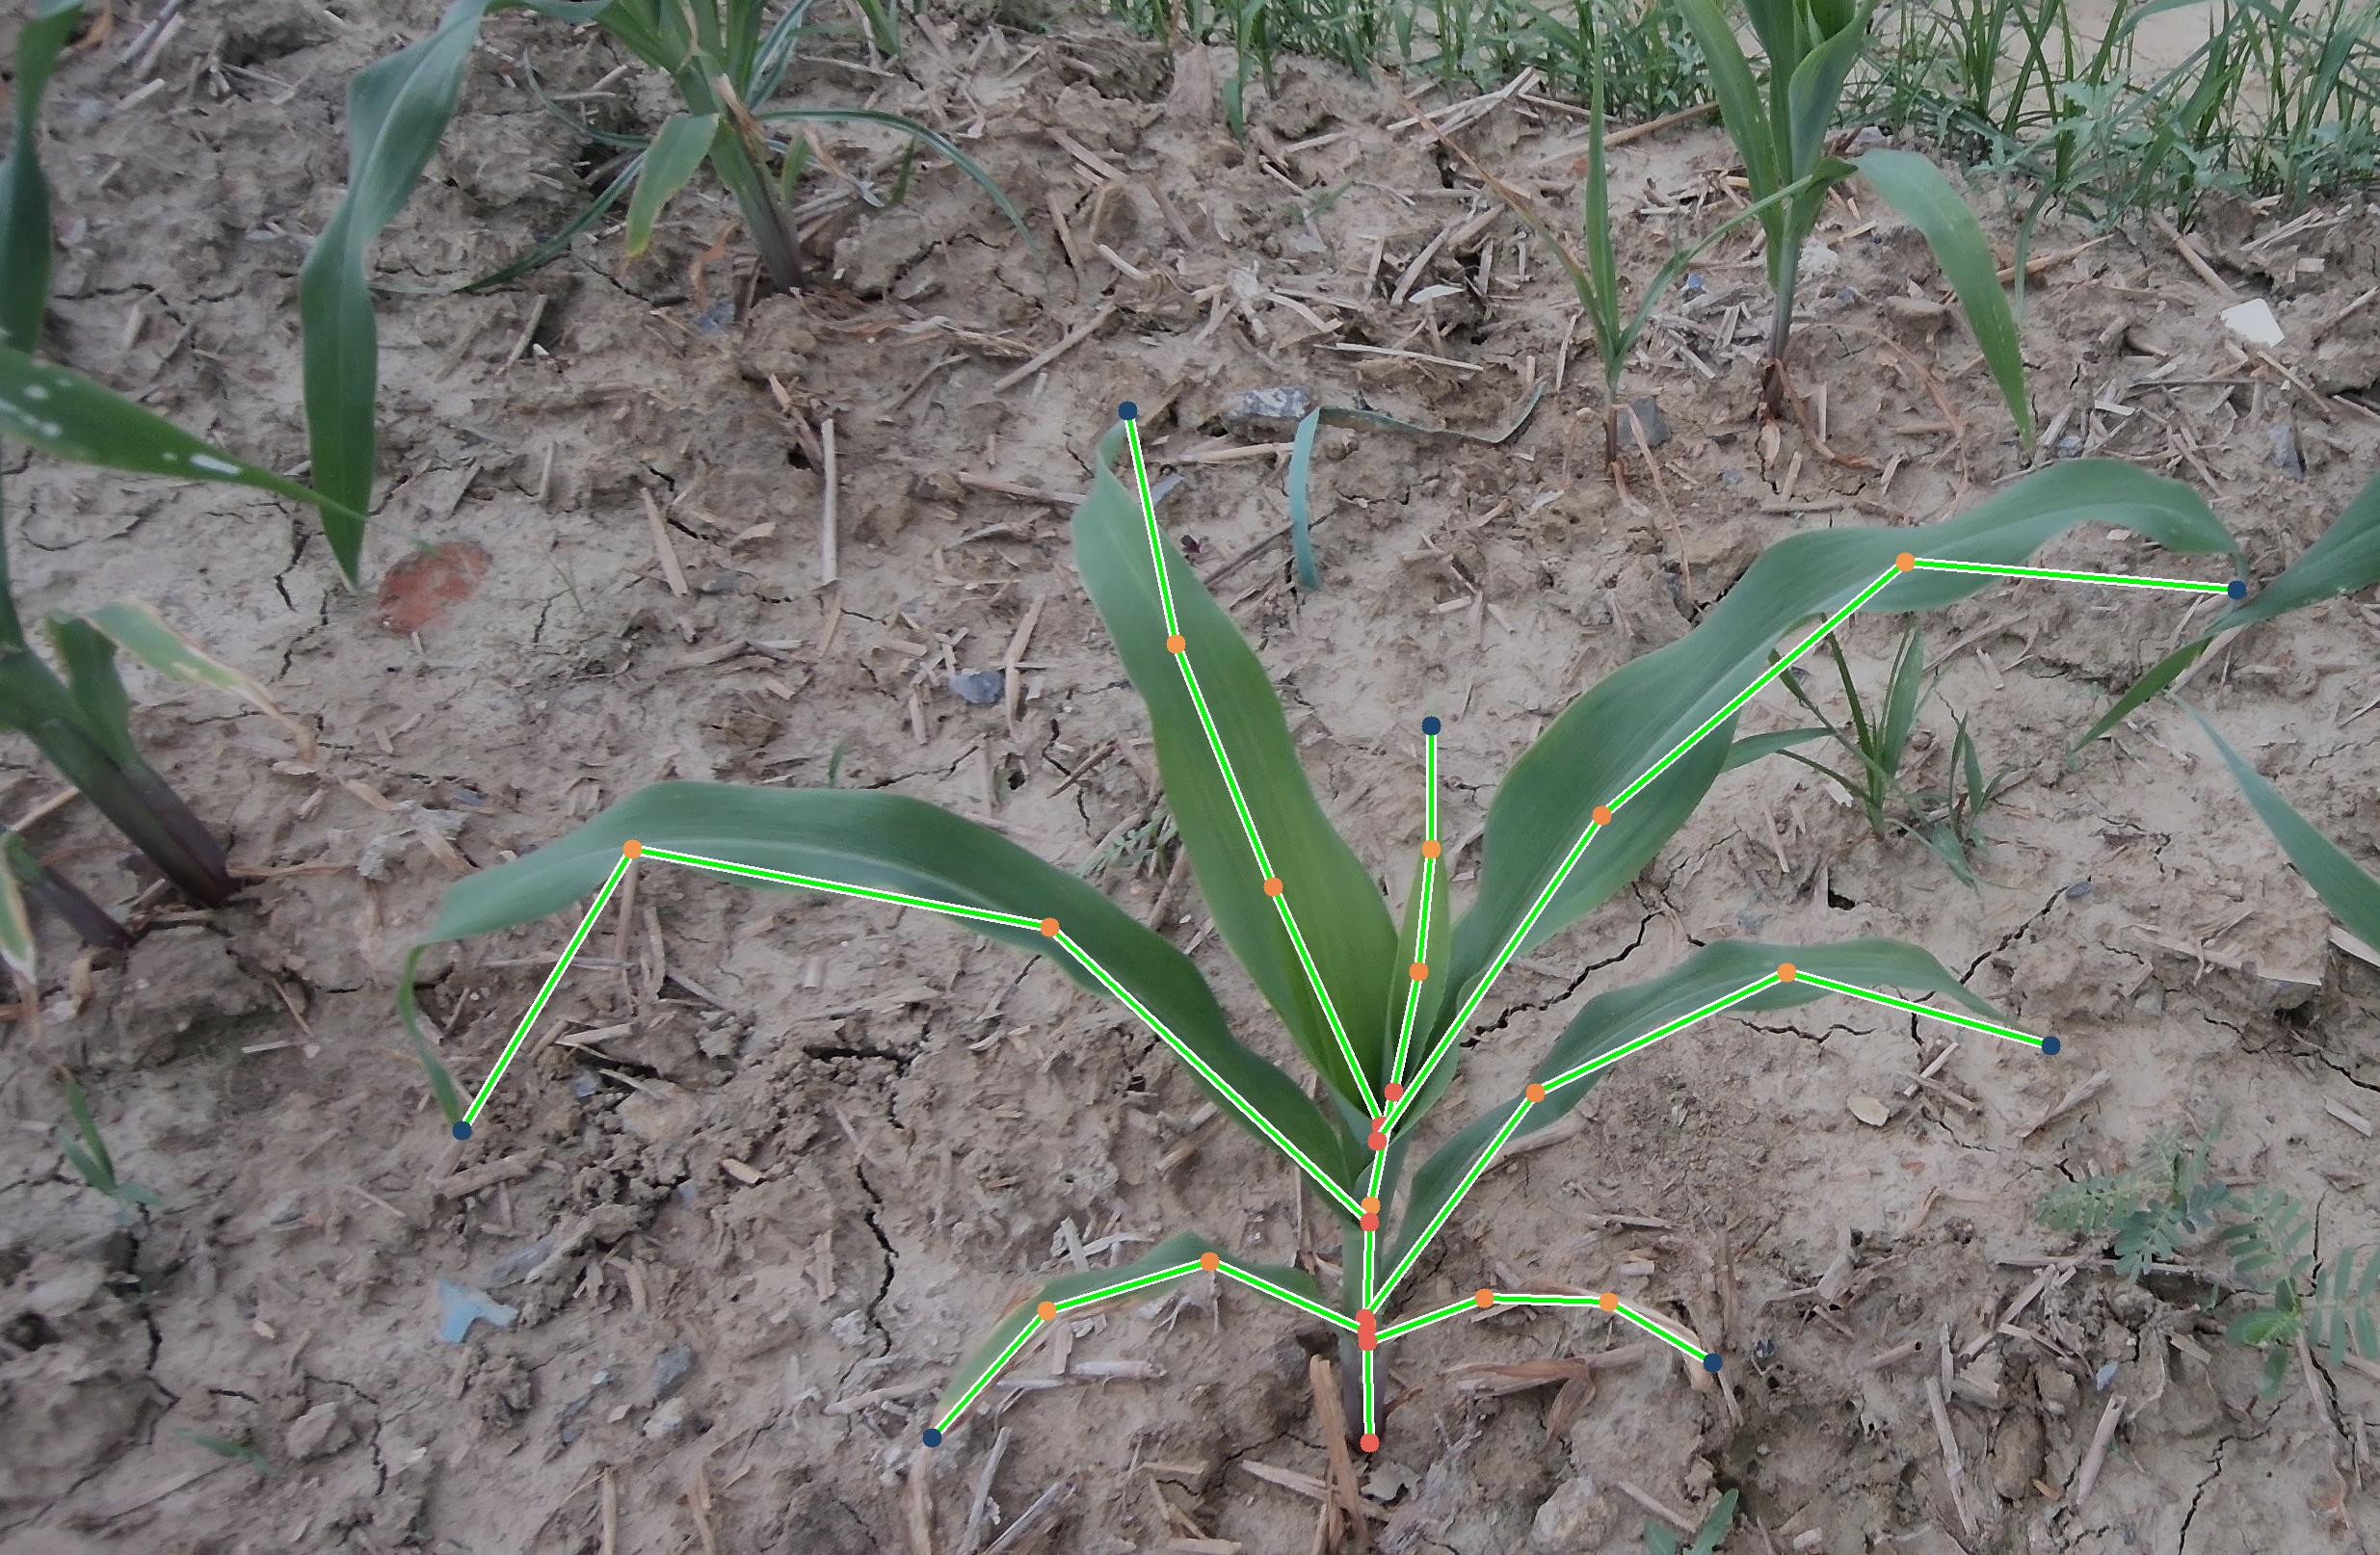 | 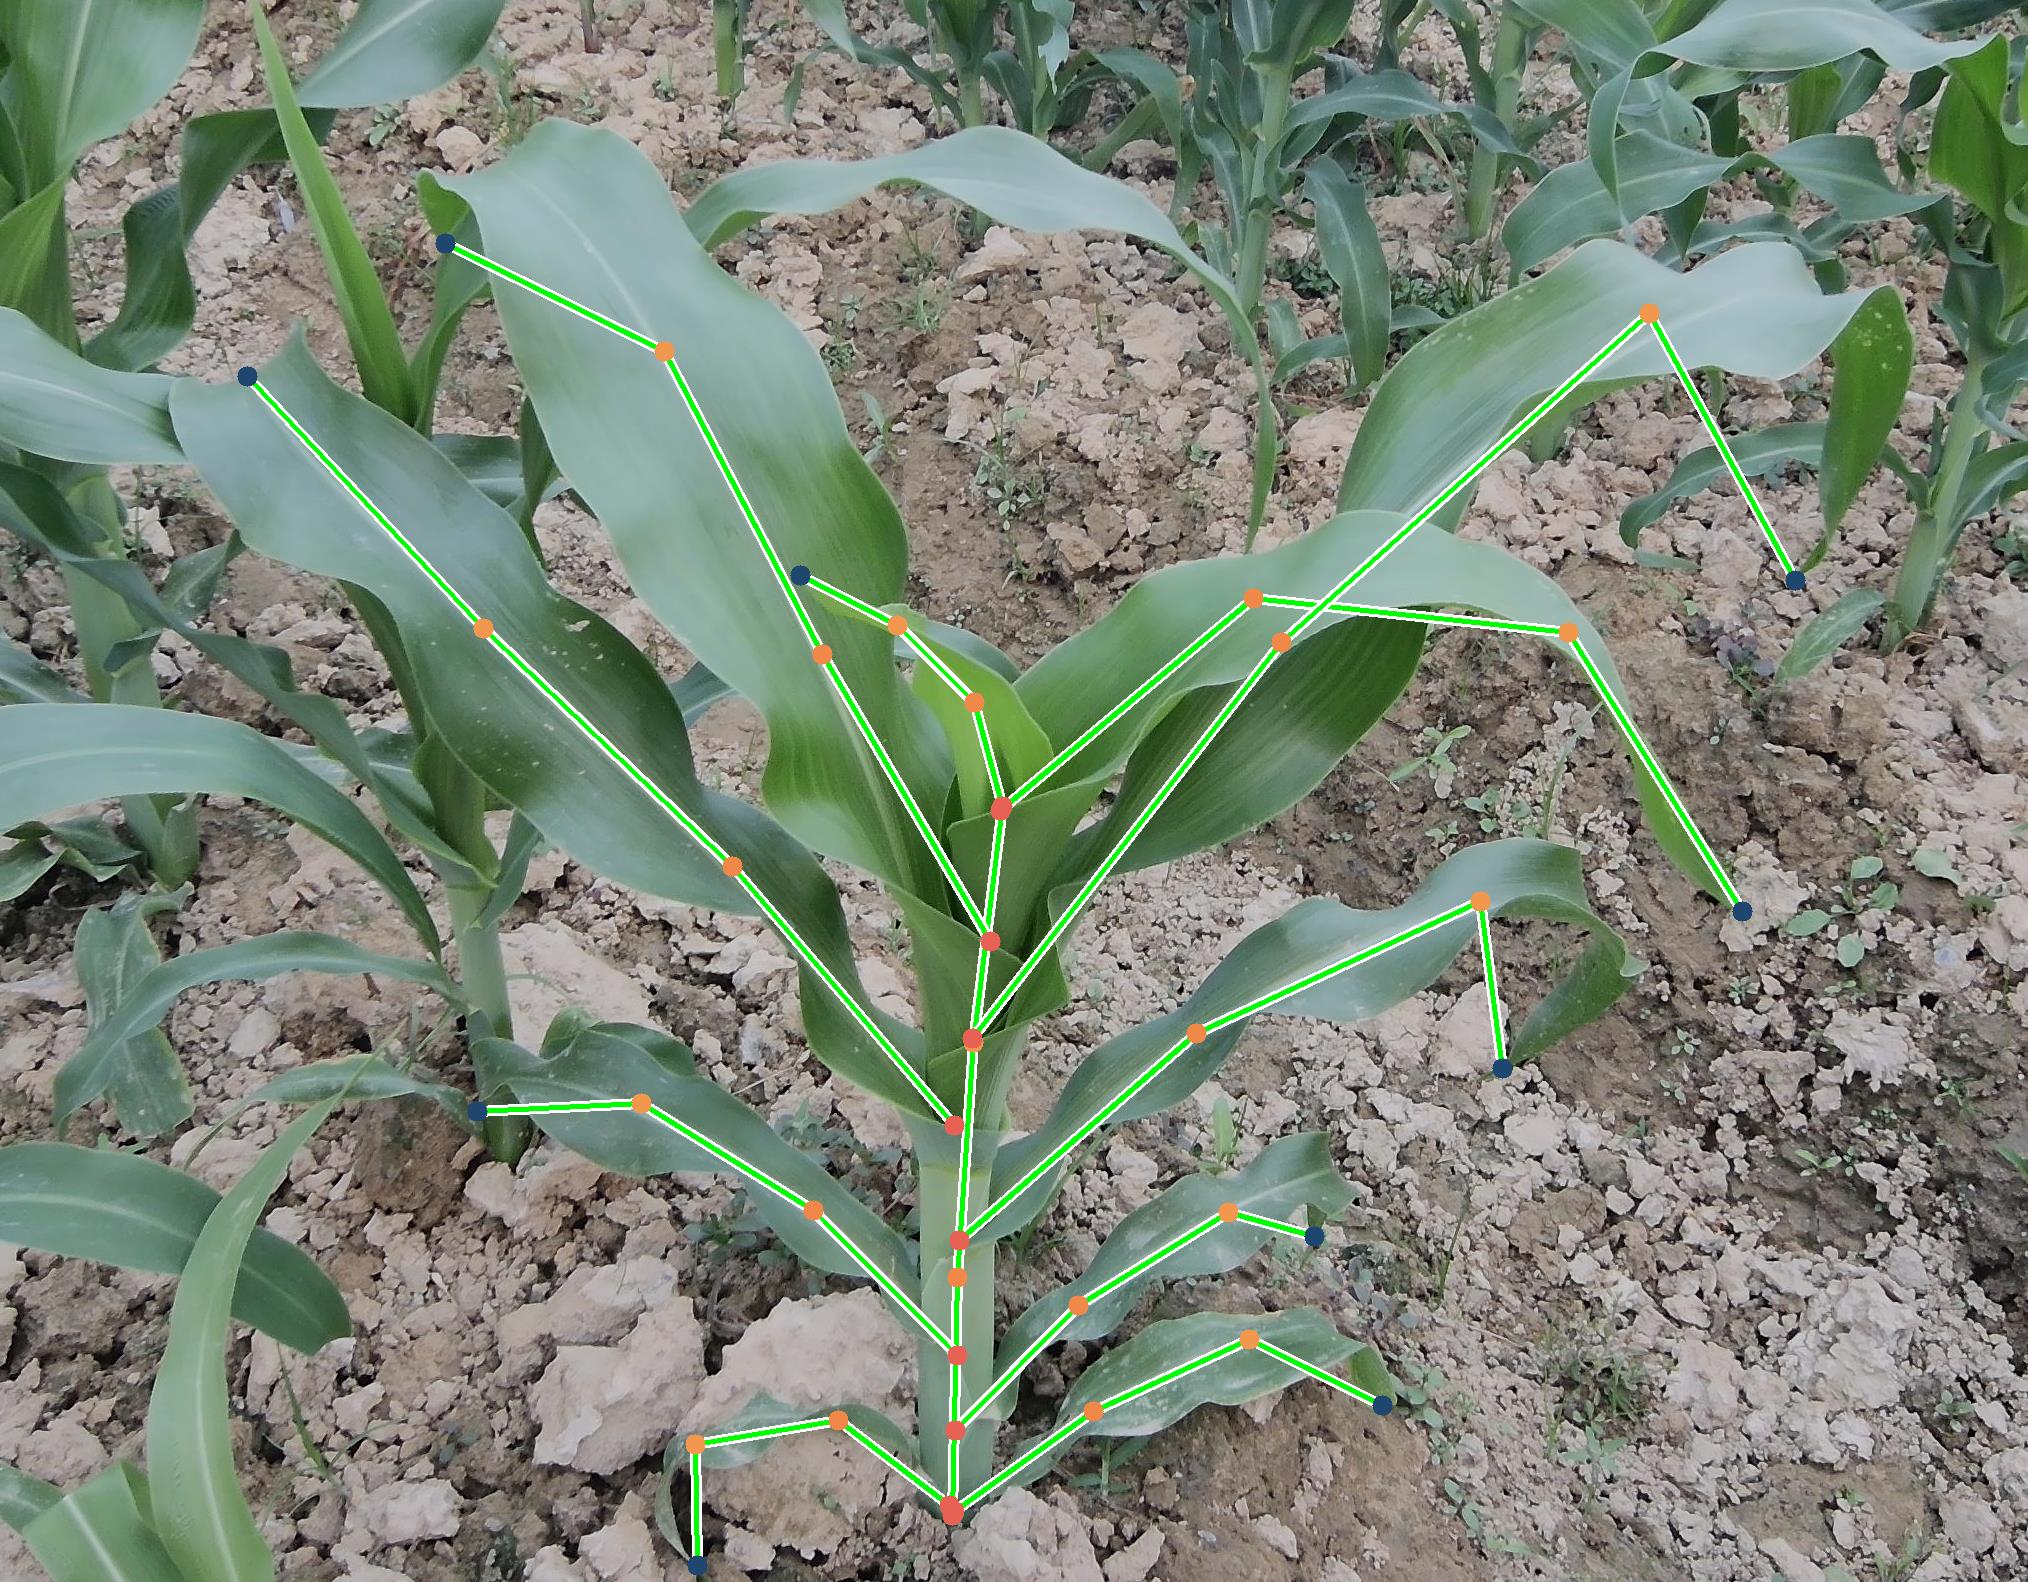 |
| 采样数:5 | 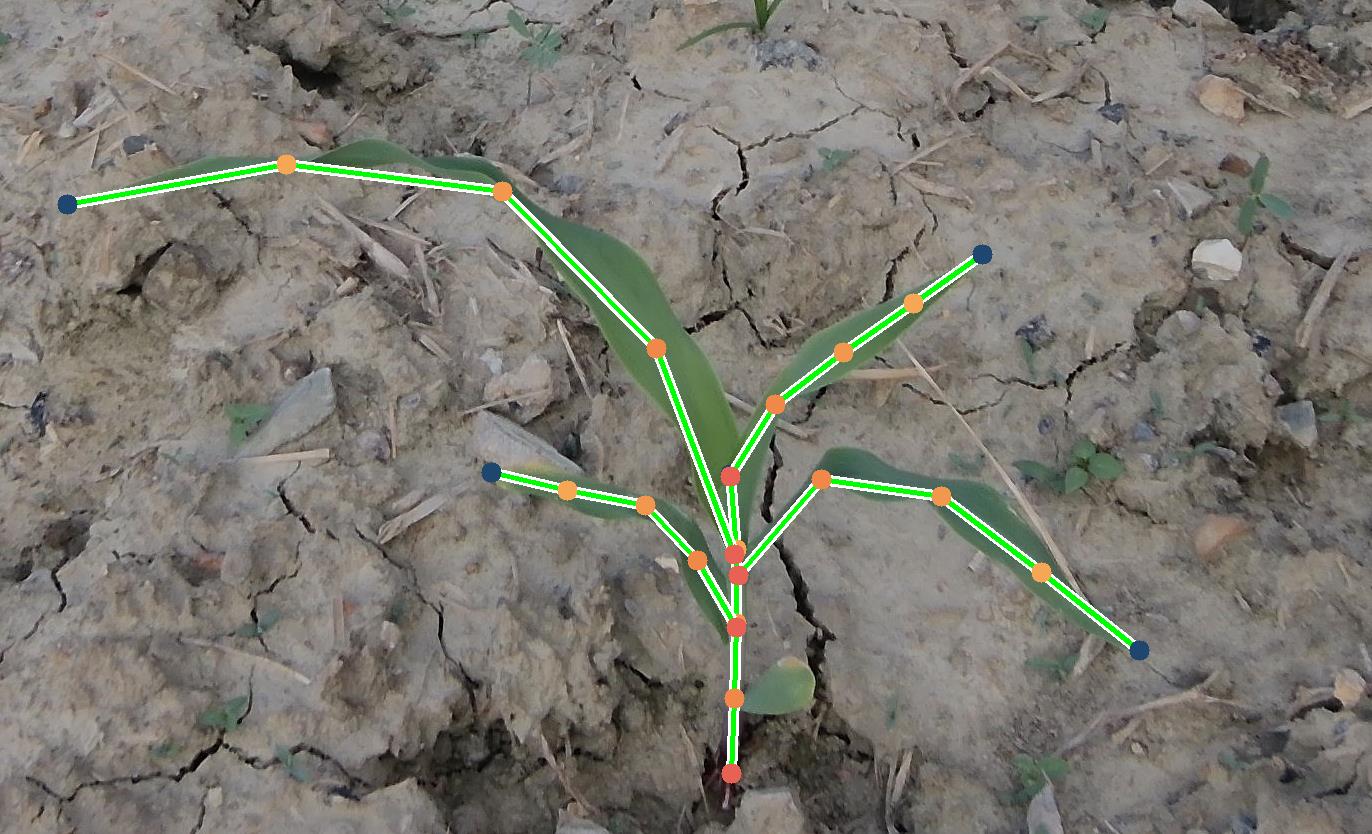 | 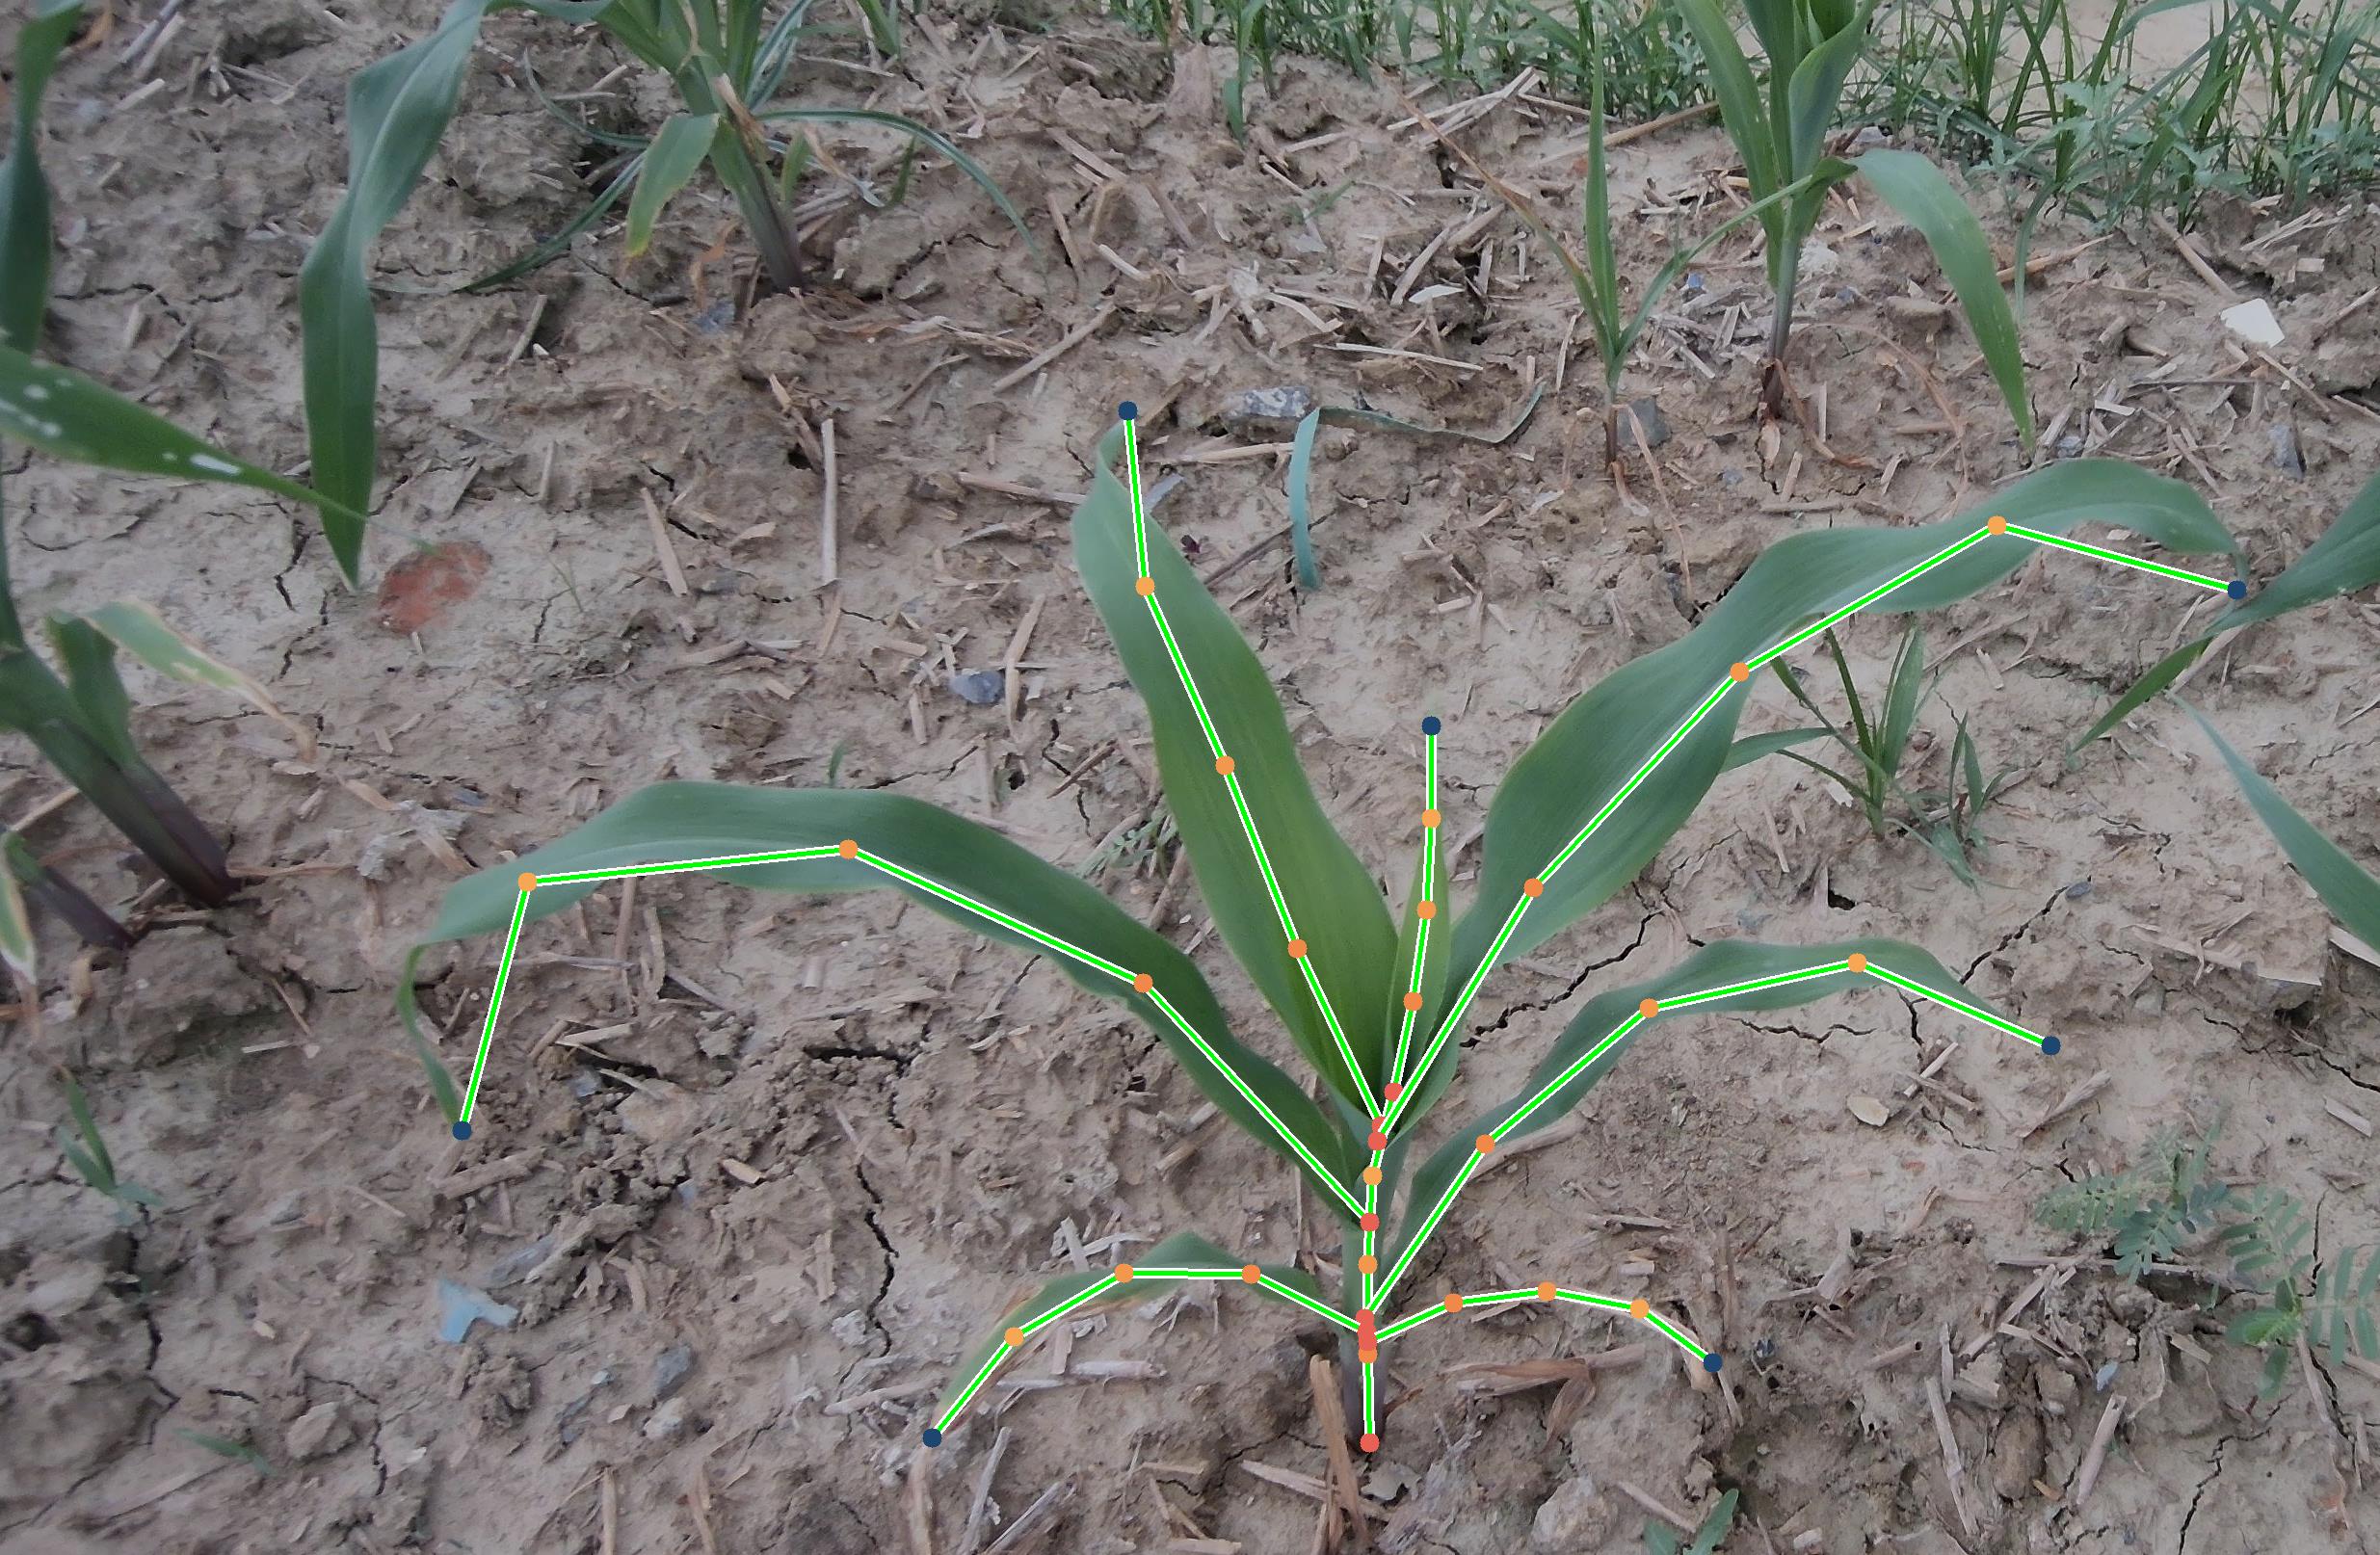 |  |
| 采样数:10 | 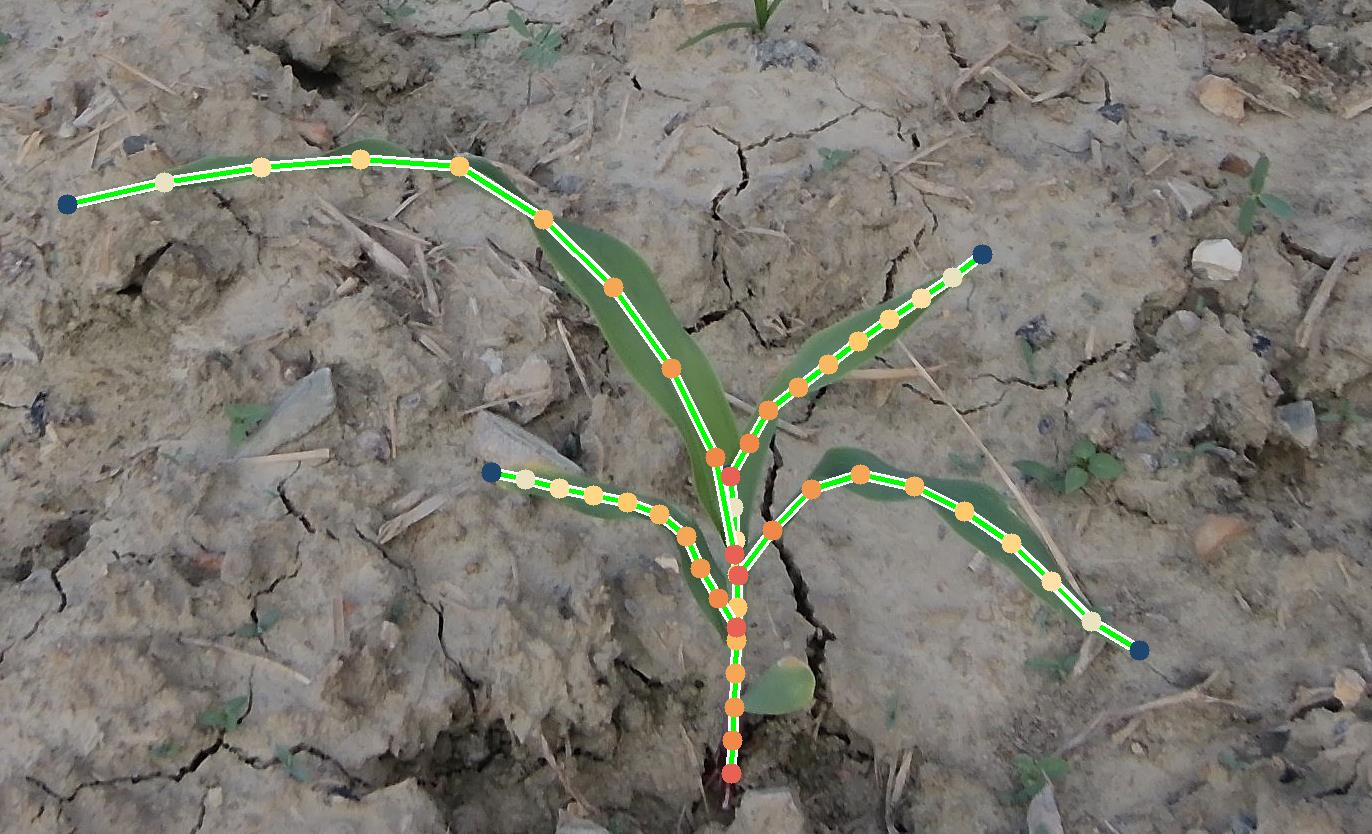 | 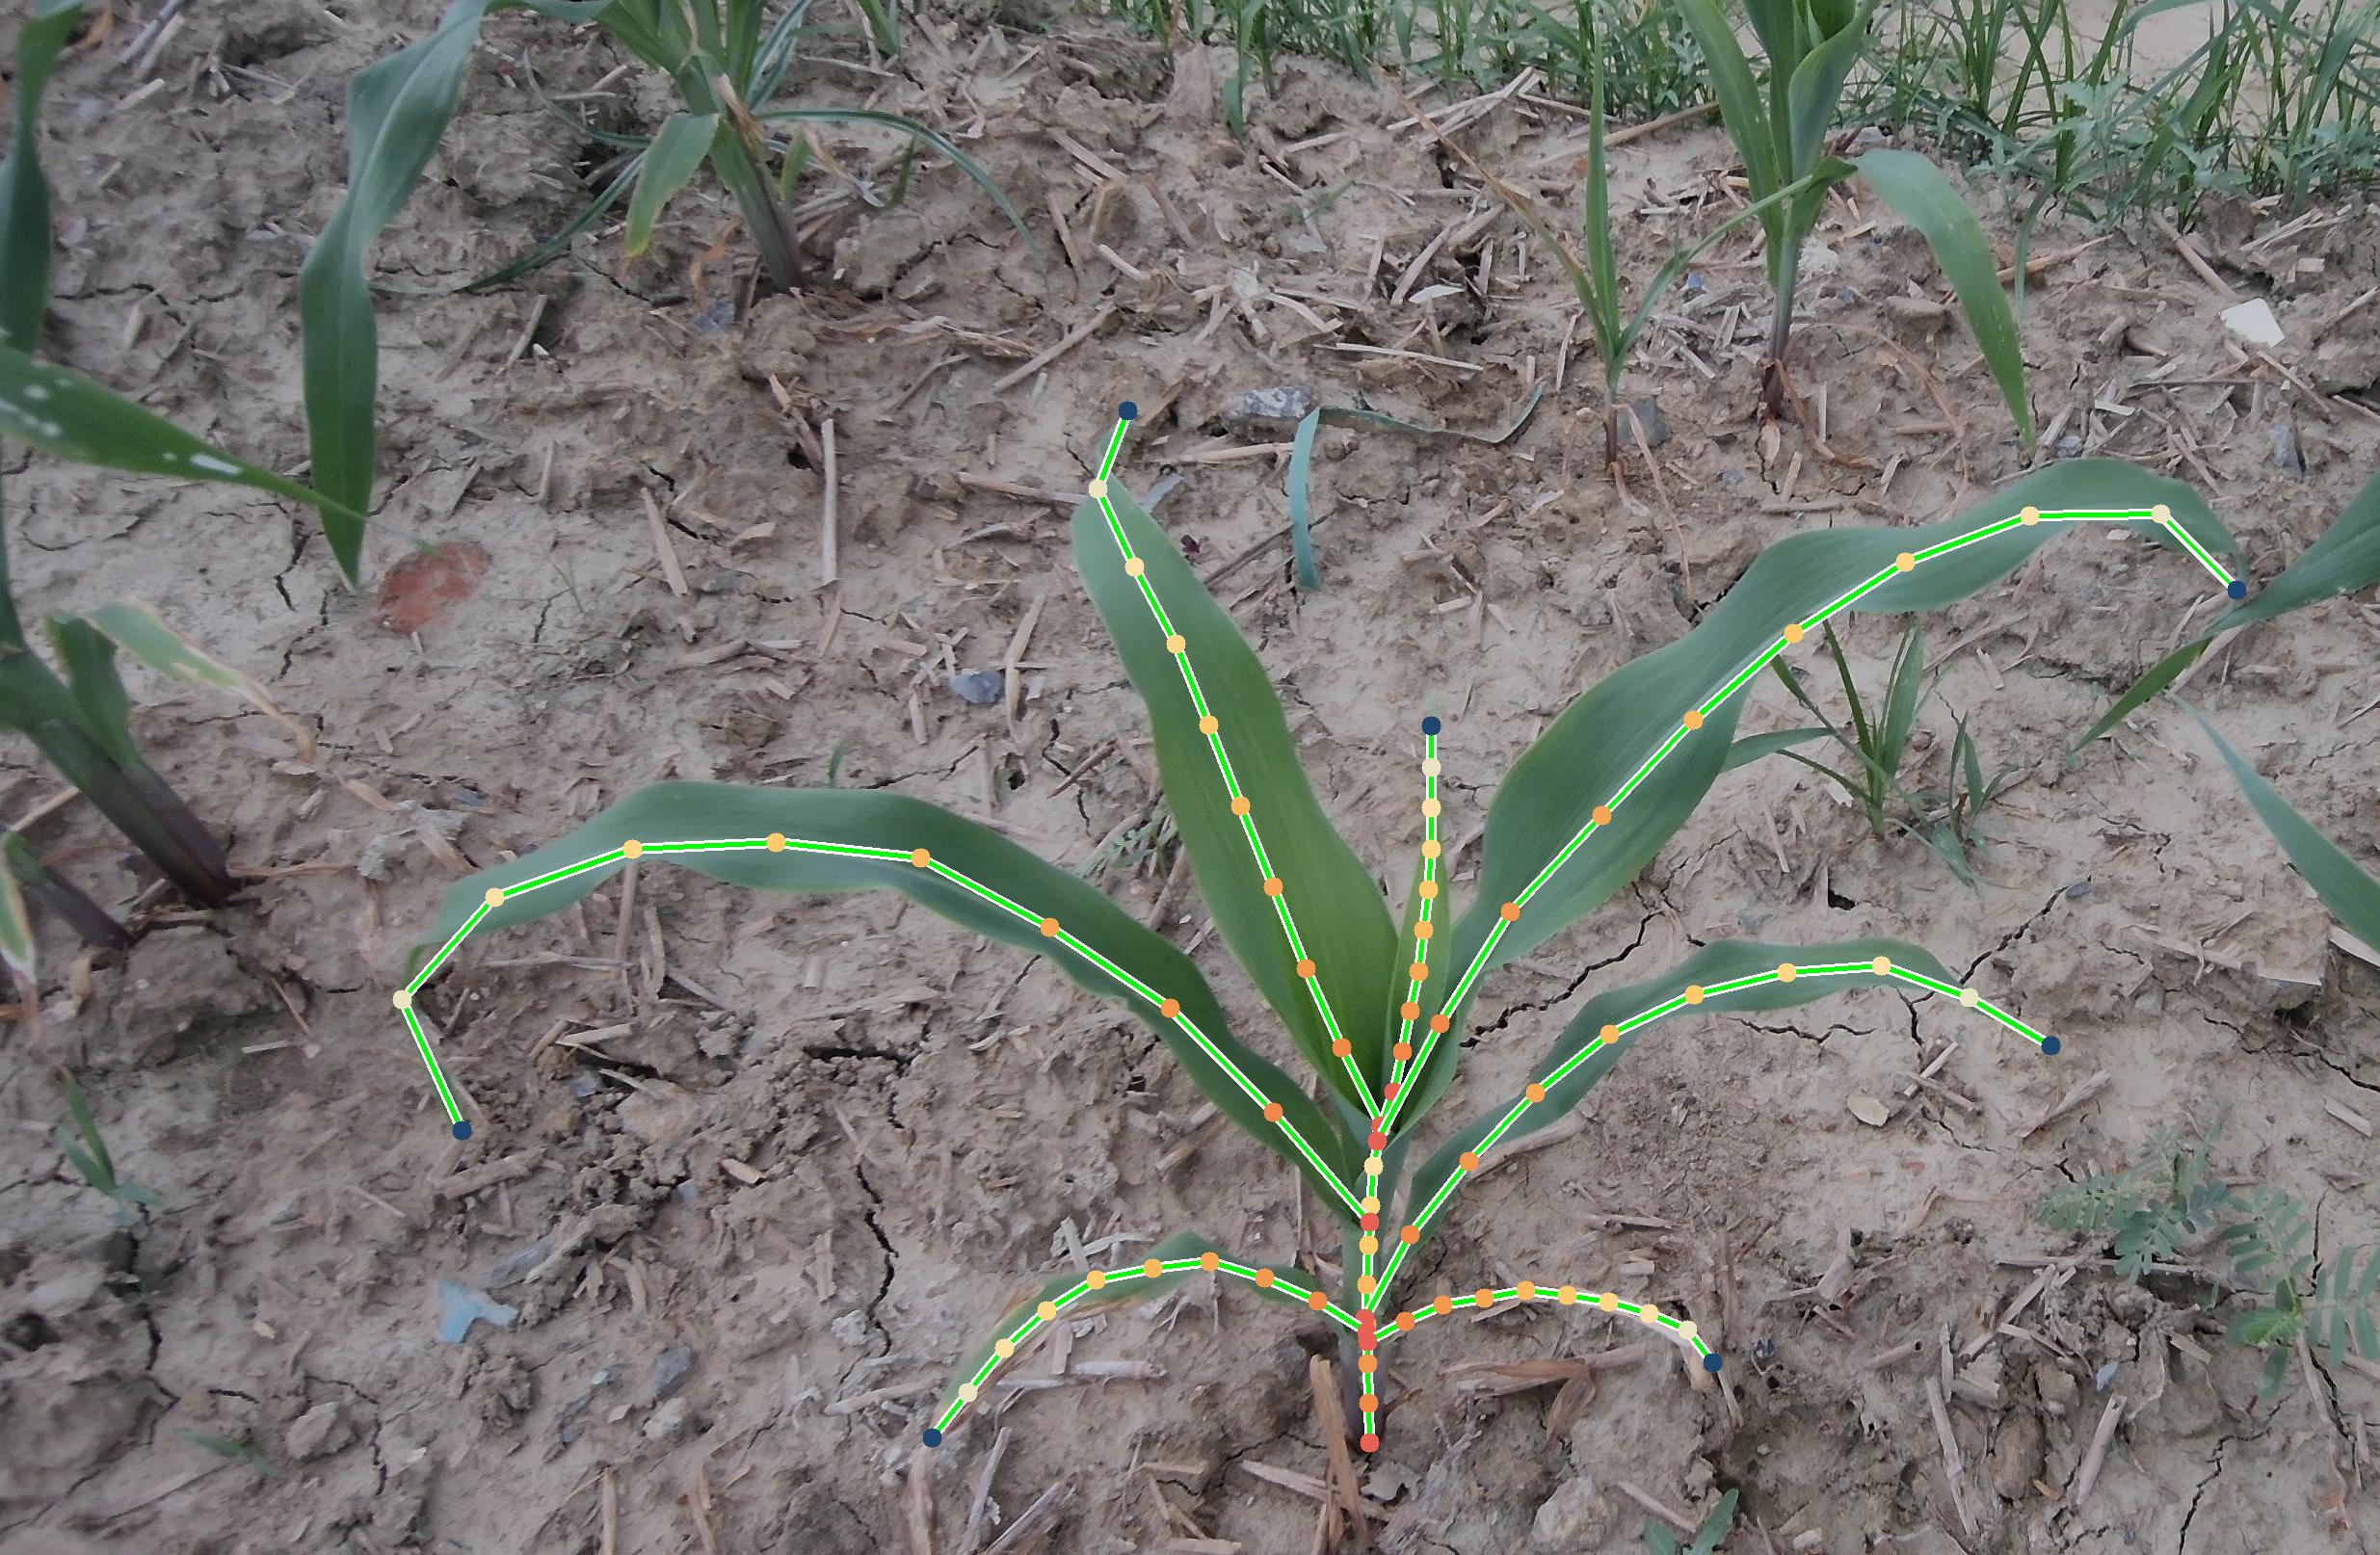 | 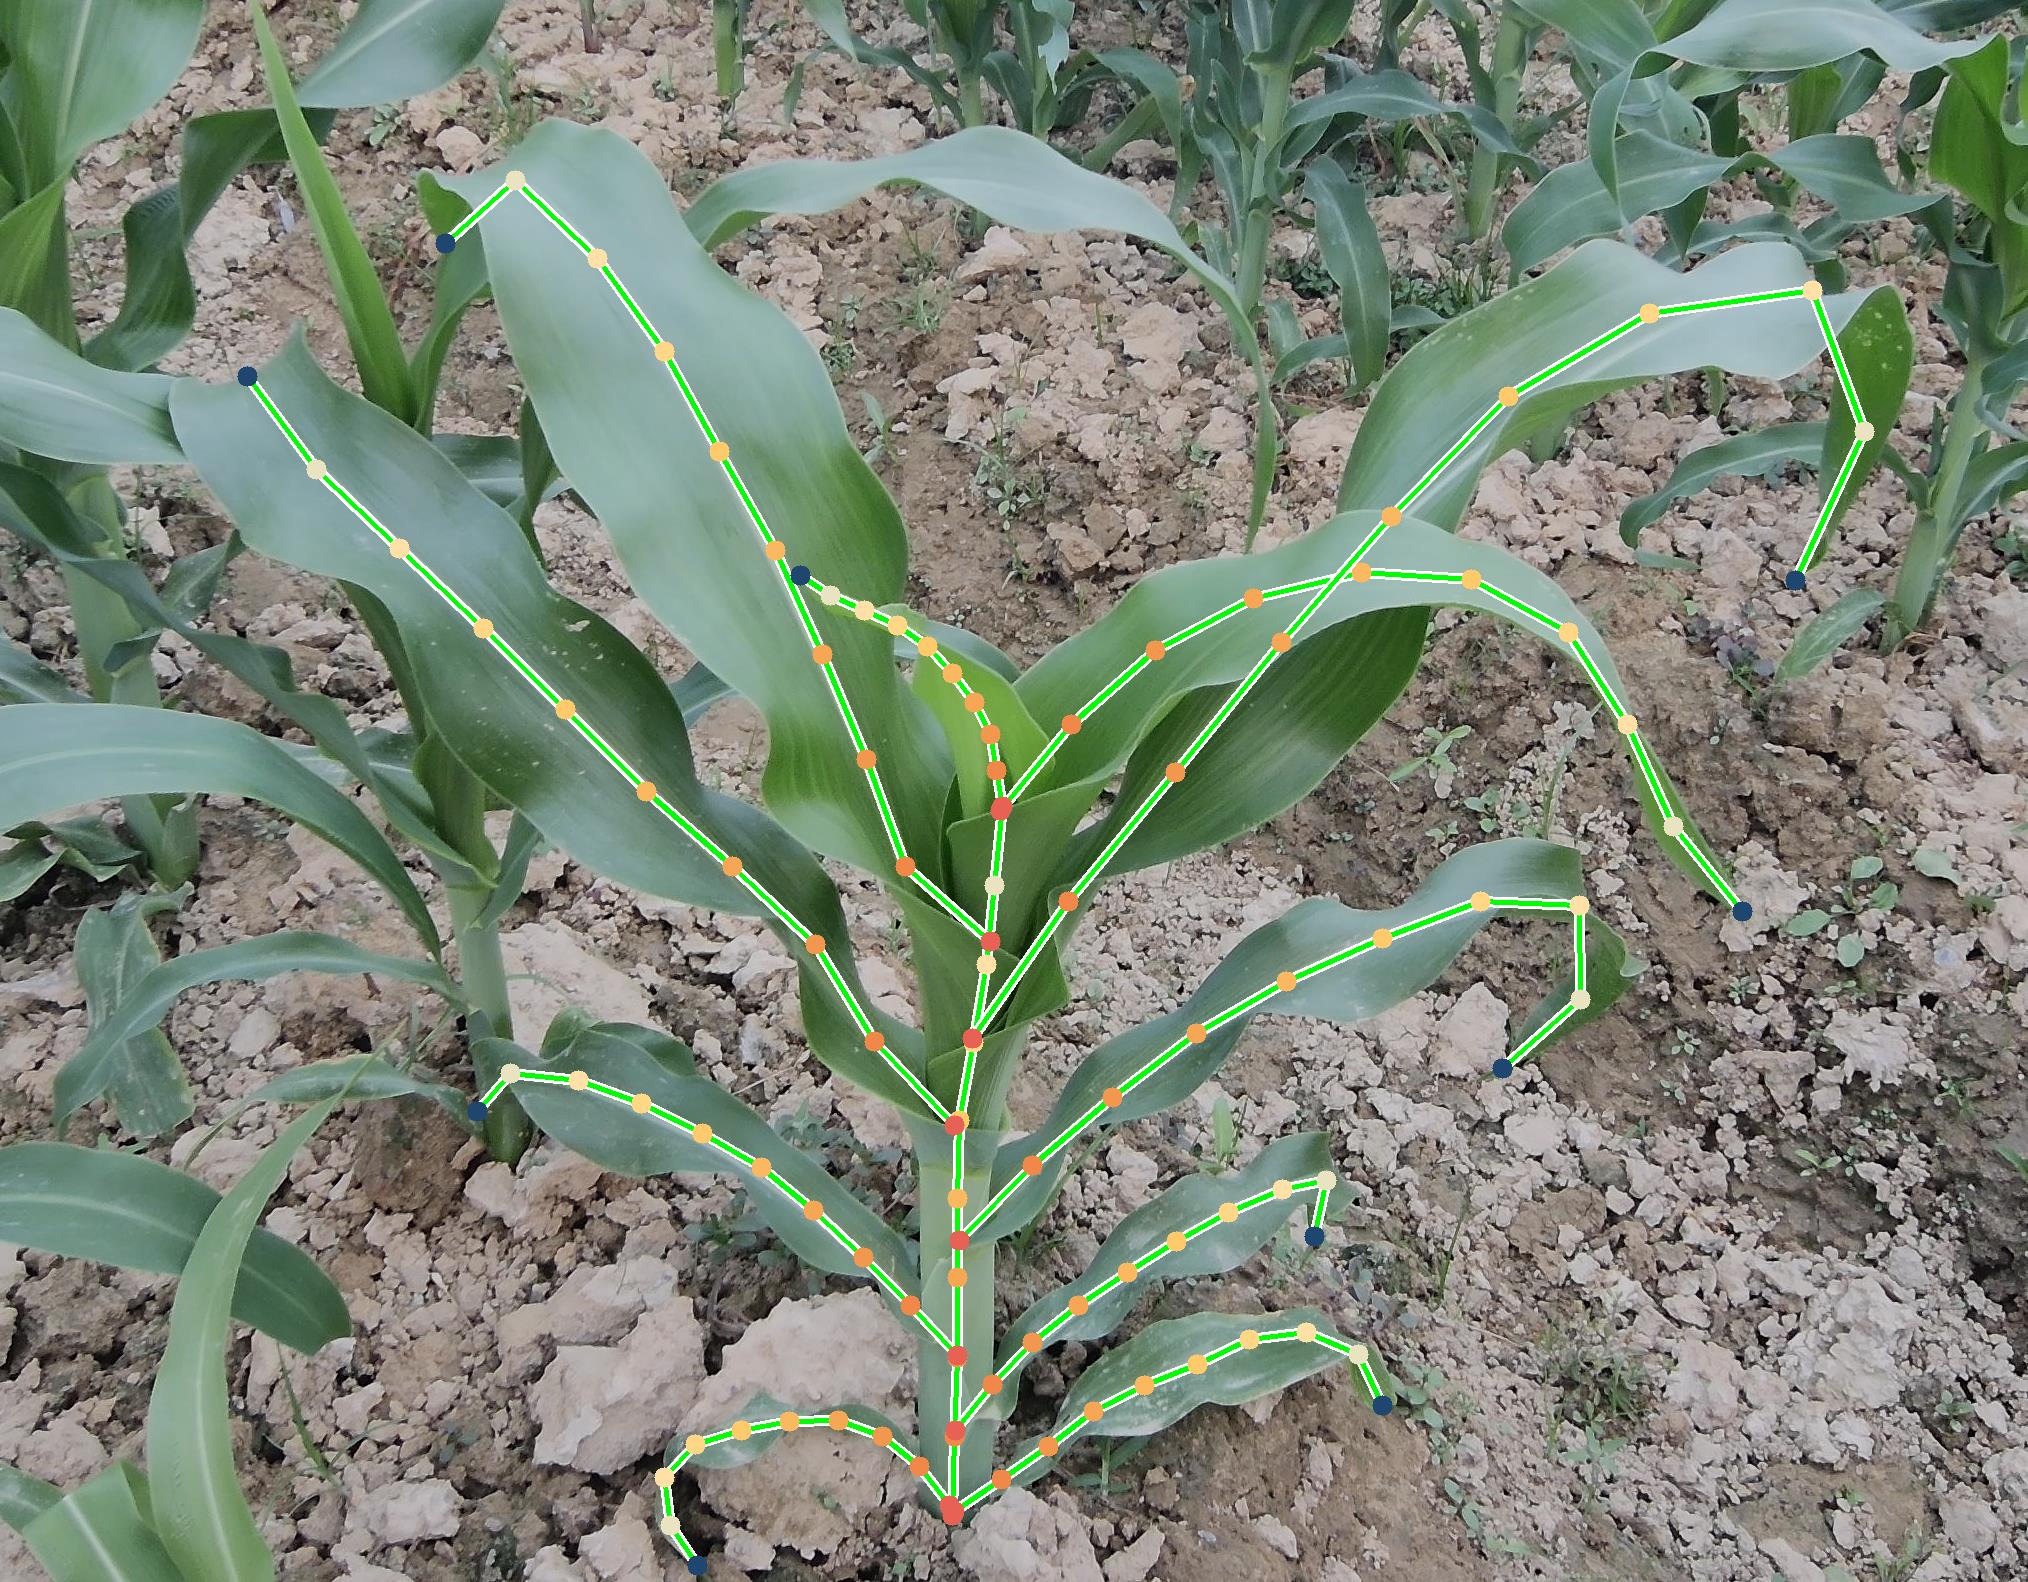 |
| 采样数:20 | 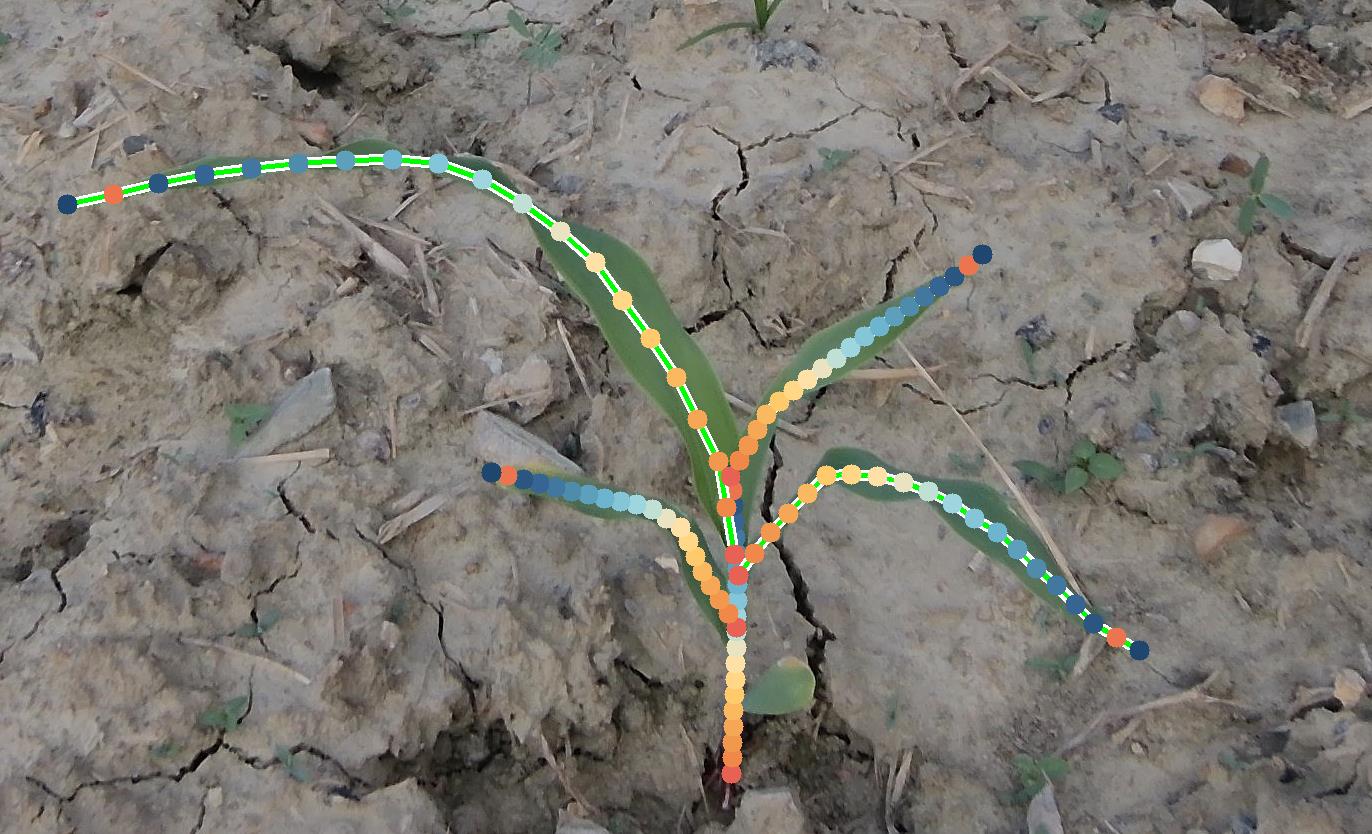 | 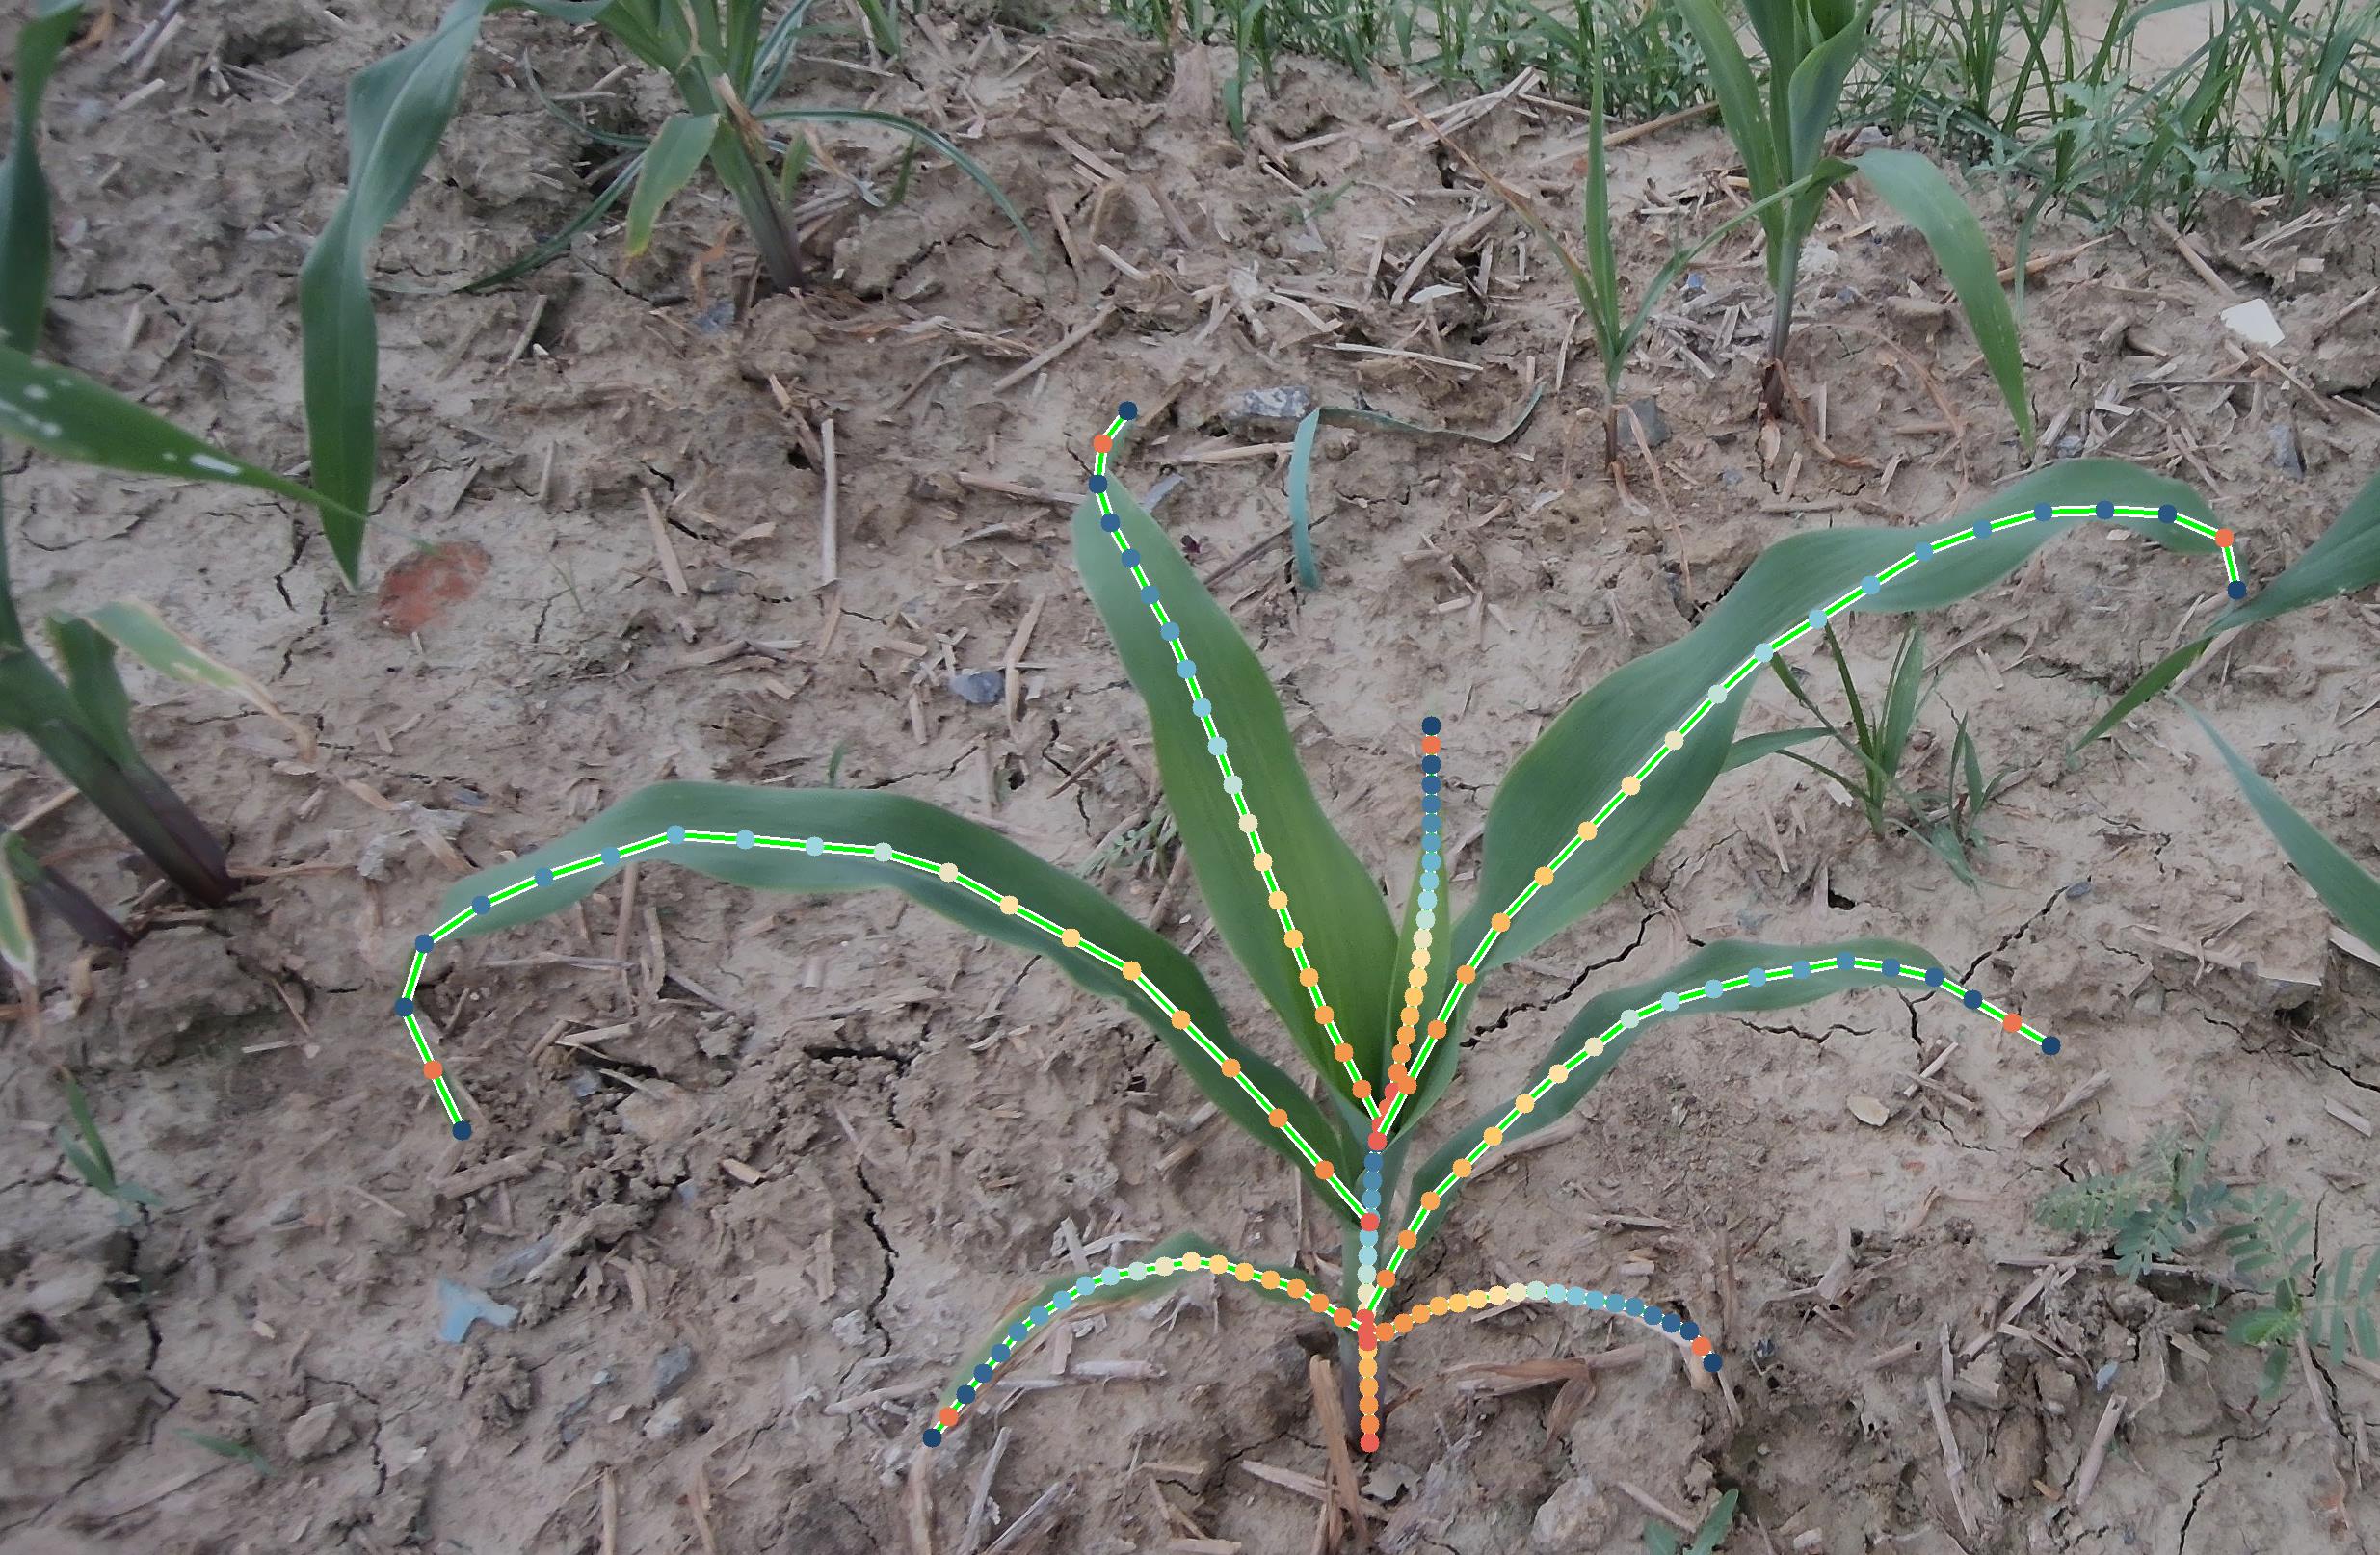 |  |
为了量化不同采样点数的骨架与原始骨架的相似程度,计算了平均Fréchet距离,结果如图4所示。当采样点数较低时,Fréchet距离超过100,表明骨架相似度较低;当采样点数为10时,Fréchet距离达到最低值为79.008,表明此时采样骨架与原始骨架的相似度最高。然而,当采样点数增加至20时,Fréchet距离略有上升,可能是过度上采样引入的冗余点导致局部形态的微小偏离。

综合分析表明,从关键点均匀采样的角度,每个实例采样10个关键点是当前的最佳设置,既能有效保持原始骨架的形态特征,又能避免冗余点带来的负面影响,为后续建模提供了高效、准确的骨架数据基础。
2.2 玉米植株骨架提取
2.2.1 基于改进YOLOv11-Pose模型的骨架提取性能
表1 不同模型的边界框检测性能对比Table 1 Comparison of bounding box detection performance of different models |
| 模型 | Precision | Recall | mAP50 | mAP50-95 |
|---|---|---|---|---|
| 改进YOLOv11-Pose | 0.717 | 0.495 | 0.579 | 0.372 |
| YOLOv11-Pose | 0.648 | 0.529 | 0.536 | 0.320 |
表2 不同模型的关键点检测性能对比Table 2 Comparison of keypoint detection performance of different models |
| 模型 | Precision | Recall | mAP50 | mAP50-95 |
|---|---|---|---|---|
| 改进YOLOv11-Pose | 0.641 | 0.442 | 0.490 | 0.349 |
| YOLOv11-Pose | 0.573 | 0.453 | 0.442 | 0.282 |
从表1可以看出,除召回率略有降低外,改进YOLOv11-Pose模型在边界框检测的各项指标上均优于原始模型,其中精度提高了10.6%,mAP50提高了8.02%,而mAP50-95提升最大,提高了16.3%。上述指标说明改进模型在目标检测的各项性能均得到增强,说明改进模型在更准确、更全面地识别目标方面有更大优势。
如表2所示,在关键点检测任务中,除了召回率略有降低外,改进YOLOv11-Pose模型在各项指标上均超过了YOLOv11-Pose模型。其中,精度提升了11.9%,mAP50提升了10.9%,而mAP50-95更是显著提升了23.8%,体现了改进后的模型在关键点识别上的鲁棒性和准确性。综上所述,改进YOLOv11-Pose模型在边界框和关键点检测上均实现了较大性能提升,尤其是在关键点检测任务中展现出更强的能力,验证了改进模型的有效性。
为了突出模型在密集叶片遮挡情况下的解析性能,选取了从苗期到穗期的三个典型玉米作物实例。在后两个实例中,由于玉米作物的生长,出现了作物自身叶片遮挡以及株间遮挡的现象。图5展示了改进YOLOv11-Pose模型与原始YOLOv11-Pose模型在关键时期对玉米植株边界框检测的效果。从结果可以看出,两个模型在苗期的检测效果均较为理想,所有叶片实例均被成功检测,但由于主干较小且细长,部分主干可能未被检测到。随着玉米作物的生长,尽管叶片遮挡较为严重,改进模型仍能保持较好的检测性能,基本能够检测到当前株的叶片。而原始模型则漏检了较多叶片,尤其在玉米植株进入穗期,叶片遮挡和株间遮挡更加显著,导致原始模型未能有效识别被遮挡的叶片,出现了较高的漏检率,影响了检测的全面性和精度。
图5 玉米植株的边界框检测效果Fig. 5 Results of boundary box detection of maize plants |
| 改进模型 | 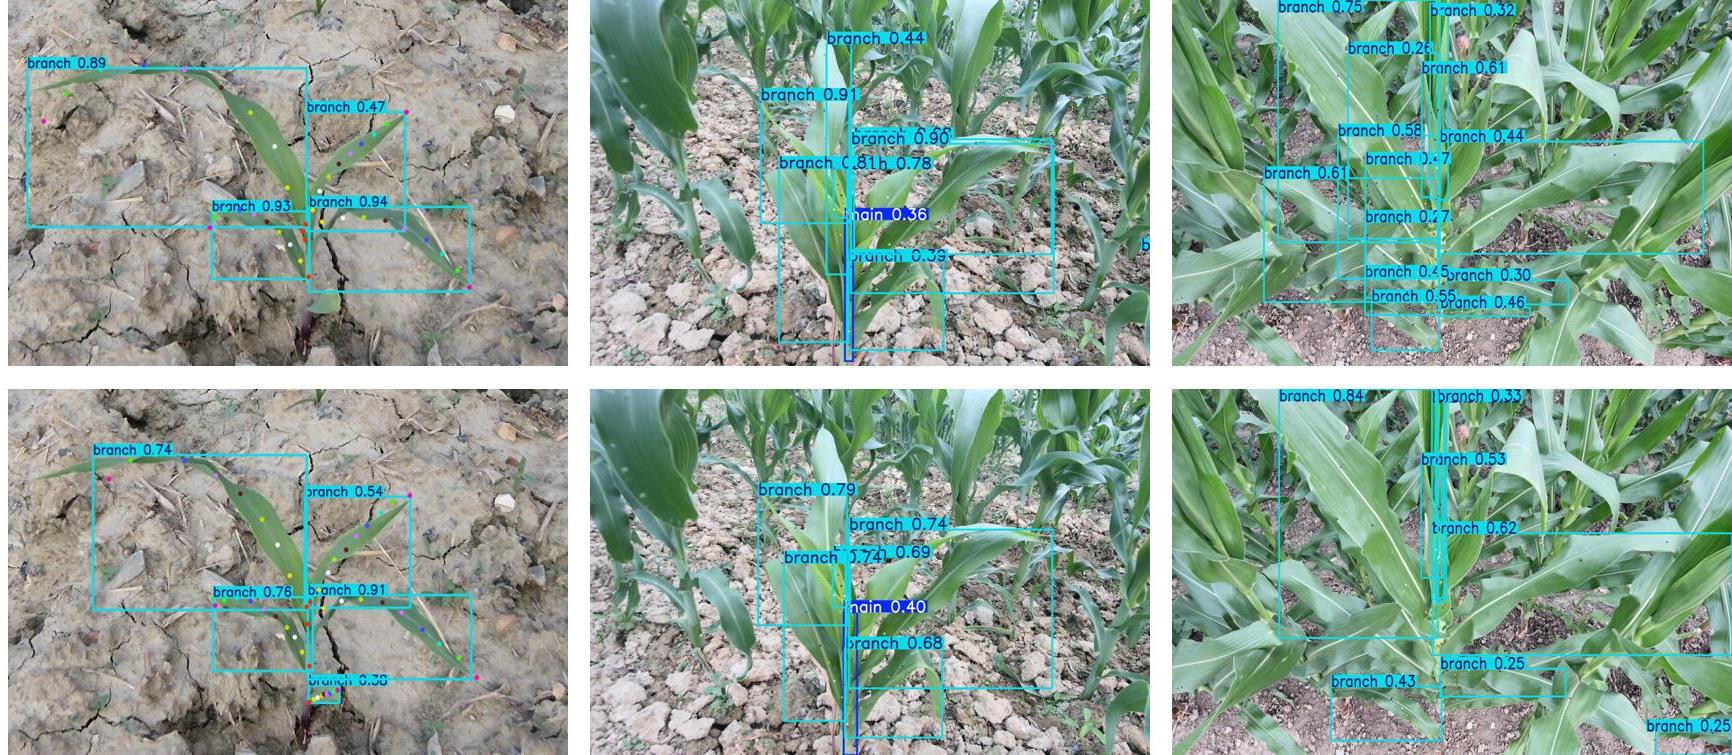 |
|---|---|
| 原始模型 |
图6展示了改进模型与原始模型在关键时期对玉米植株关键点检测的效果。从结果可以看出,在苗期两个模型都表现出了较为一致的优秀检测性能,成功地生成符合叶片骨架的关键点轨迹。在此阶段,改进模型生成的关键点连线形成的骨架更加平滑,且更符合人工标注的轨迹,能够更精确地反映植株的真实形态。而在玉米作物生长后期,受边界框漏检的影响,原始模型漏掉了部分叶片的关键点检测,导致单植株骨架提取不完整和不准确。相比之下,改进模型在面对玉米生长后期复杂的遮挡和叶片弯折时展现出了更强的鲁棒性。尽管叶片遮挡较为严重,改进模型能够有效处理这些遮挡情况,并在遮挡部位进行一定的关键点延长,确保骨架的连续性和准确性。该模型生成的关键点连线与人工标注保持高度一致,进一步证明了其在复杂环境下的适应能力和遮挡处理能力。因此,改进模型不仅在检测精度上优于原始模型,还在面对遮挡、弯折等复杂情况时表现出更为出色的鲁棒性,能够更好地进行玉米作物的骨架提取和关键点定位。
图6 玉米植株的关键点检测效果Fig. 6 Results of key point detection of maize plants |
| 改进模型 | 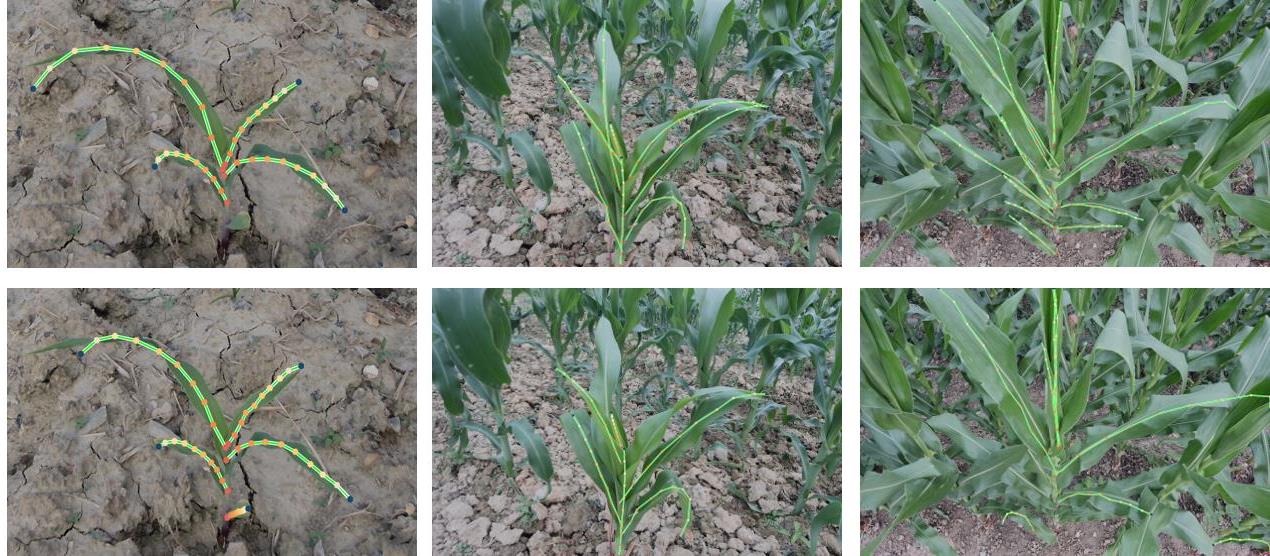 |
|---|---|
| 原始模型 |
2.2.2 基于不同采样点数量的骨架提取性能
本研究对不同采样点数量对玉米植株骨架提取性能的影响进行了探讨。表3展示了边界框检测性能的主要指标。
表3 不同采样策略的边界框检测性能对比(基于改进YOLOv11-pose模型)Table 3 Comparison of bounding box detection performance with different sampling strategies (based on the improved YOLOv11-pose model) |
| 采样数 | Precision | Recall | mAP50 | mAP50-95 |
|---|---|---|---|---|
| 2 | 0.761 | 0.605 | 0.656 | 0.398 |
| 3 | 0.606 | 0.515 | 0.527 | 0.290 |
| 4 | 0.684 | 0.598 | 0.622 | 0.360 |
| 5 | 0.674 | 0.527 | 0.581 | 0.328 |
| 10 | 0.717 | 0.495 | 0.579 | 0.372 |
| 20 | 0.661 | 0.520 | 0.562 | 0.338 |
从表3可以看出,边界框检测性能与采样点数量的相关性不大。在采样点数为2至20范围内,各项指标均保持在合理范围内,其中Precision和Recall在2个采样点时达到最高值,说明该配置下边界框检测的误检率和漏检率最低。然而,当采样点数增加至20时,Recall和mAP50均呈下降趋势,这可能是由于采样点数量过多引发的信息冗余,增加了检测的复杂性和误差。
同时,表4进一步统计了关键点检测的性能变化。
表4 基于不同采样点数的关键点检测结果Table 4 Key point detection results based on different sampling points |
| 采样数 | Precision | Recall | mAP50 | mAP50-95 |
|---|---|---|---|---|
| 2 | 0.783 | 0.739 | 0.778 | 0.710 |
| 3 | 0.692 | 0.588 | 0.631 | 0.518 |
| 4 | 0.732 | 0.640 | 0.684 | 0.562 |
| 5 | 0.651 | 0.572 | 0.607 | 0.466 |
| 10 | 0.648 | 0.535 | 0.555 | 0.341 |
| 20 | 0.485 | 0.338 | 0.293 | 0.134 |
从表4可以看出,关键点检测的性能对采样点数量的变化更加敏感。采样点数较少时,模型的性能较为优越。例如,采样点数为2时,Precision和mAP50分别为0.783和0.778,表现出较高的检测精度和覆盖率。然而,当采样点数增加到10及以上时,Precision和Recall均显著下降。例如,采样点数为20时,Precision降至0.485,mAP50降至0.293,模型性能基本不可用。这种下降可能归因于以下原因:1)关键点信息的语义密度下降。较多的采样点会分散原始骨架中的关键语义信息,导致模型难以有效学习;2)冗余点导致干扰。采样点数量过多引入了噪声,增加了模型的复杂性,导致性能下降。从综合分析来看,10个采样点是骨架描述精度与检测精度的平衡点。
2.2.3 基于不同实例对象的骨架提取性能
为了进一步验证模型在不同实例上的表现,图7展示了均匀采样10个关键点的骨架提取性能,其中主干实例(main)和叶片实例(branch)的检测结果分别进行了对比分析。结果表明,主干实例的骨架提取性能明显弱于叶片。从图7中可以看出,不同实例类别在骨架提取性能上存在显著差异。整体性能指标表明,模型对所有实例的骨架提取具有一定的准确性和稳定性,其中对边界框的Recall约为0.6,对关键点的mAP50达到0.5,表明模型在关键点和边界框检测任务上均有一定表现。然而,这些指标受到具体实例类别的差异化影响。对于主干实例,骨架提取性能明显低于叶片实例,边界框识别精度约为0.579,Recall较低仅为0.495;关键点检测Recall仅为0.338,mAP50-95仅约为0.253,说明关键点检测的覆盖率较低,可能由于主干特征信息不足,导致漏检率较高。而叶片实例的骨架提取性能明显优于主干,边界框识别精度和Recall分别达到0.738和0.592,关键点检测Recall和mAP50-95达到0.633和0.444,显示模型在叶片实例上的骨架检测覆盖率较高。
这一现象可以归因于以下几点:1)主干特征信息较少。主干的形态通常直立或斜立,变化较小,导致模型学习到的特征较少;2)关键点冗余的影响。对于主干实例,10个采样点可能过于冗余,增加了模型检测的难度。相比之下,叶片实例由于形态复杂、特征丰富,10个采样点能够较好地覆盖关键语义信息,保证了骨架提取的准确性。为了优化主干骨架提取性能,应减少主干实例的采样点数量至2—5个,以减少冗余点的干扰,同时保持骨架形态的完整性。而对于叶片实例,选取10个采样点仍为最佳配置。综上所示,针对不同实例对象的特点调整采样点数量,是提升骨架提取性能的关键策略。该方法既能确保整体骨架形态的精确性,又能优化不同实例下的检测性能。
此外,由于植株在不同生长阶段,以及不同叶片实例中,其骨架的复杂度、数量和形态均存在显著差异,这一现象表明采用关键点自适应调整策略确实能够更好地适配不同阶段和叶片的特性。然而,现有主流框架尚不支持关键点数量的自适应调整,因此,本研究选择统一关键点数量的方式进行骨架描述。这一选择主要出于以下考虑:一是保证整体框架的简洁性和通用性;二是验证在统一约束条件下骨架提取的适用性和稳定性。尽管不同生长阶段和叶片实例的骨架差异较大,但实验结果表明,统一使用10个采样点描述骨架,已能在不同阶段和叶片实例中取得较为理想的骨架提取效果。这表明,即便在统一关键点数量的约束下,骨架提取方案仍具备较高的鲁棒性和适用性。进一步地,可设计分阶段骨架提取策略,首先通过检测植株大小及整体复杂度,评估骨架的复杂程度需求。然后根据复杂度动态选择合适的骨架提取方案。该方案能够实现关键点数量的自适应调整,有优化骨架提取效果的潜力。
2.3 表型参数测量性能
基于前述研究结果,采用改进YOLOv11-Pose模型结合10个采样点的骨架提取方案在表型参数测量中展现出最优性能。表5展示了株高测量结果,测量精度达到MAE为2.435 cm和R 2为0.949的优良水平,表明模型具有较高的预测准确性。值得注意的是,RMSE达到13.621 cm且MAPE为6.561%,反映出测量结果存在明显的波动性。通过将数据按生长期划分为V2—V5和V6—V9两个阶段进行深入分析发现,这种波动主要来源于生长后期(V6—V9)的测量误差显著增大,其根本原因在于模型对玉米植株最高点关键点的识别存在一定局限性。一方面,随着植株高度增加,顶部叶片相互遮挡加剧,增加了最高点定位的难度;另一方面,后期植株的形态变化更为复杂,可能导致关键点误识别。
表5 玉米株高测量结果Table 5 Measurement results of maize plant height |
| 长势数据 | MAE/cm | RMSE/cm | MAPE/% | R 2 |
|---|---|---|---|---|
| 株高(全部) | 2.435 | 13.621 | 6.561 | 0.949 |
| 株高(V2—V5) | 1.301 | 2.966 | 5.792 | 0.983 |
| 株高(V6—V9) | 3.796 | 26.406 | 7.484 | 0.931 |
表6及图8展示了叶龄测量的统计结果与误差分布情况,由于采用单株计算叶龄的方法,其测量效果优于传统目标检测方法,有效避免了多株间相互干扰导致的误检或漏检问题。整体测量结果显示MAE为0.741,表明模型对叶龄的预测误差基本控制在1个叶龄期以内,具有较好的实用性。从误差分布趋势来看,模型对小叶龄阶段的预测精度更高,这主要得益于幼苗期叶片形态规则且相互遮挡较少;当叶龄达到V7阶段时误差达到峰值,MAE超过1,这与该阶段叶片快速生长导致的形态多变性和相互遮挡加剧有关;而在更高叶龄阶段误差又有所回落,这是因为成熟期叶片的排布规则性增强,虽然单叶形态的个体差异导致预测结果波动性增大,但整体识别难度反而降低。
表7和图9展示了叶长测量的统计结果与预测-实际值分布散点图。由于深度图质量限制和模型漏检叶片的影响,本次统计仅包含叶长测量正确且被模型完整检测到的叶片样本。总体测量结果表明,MAE为5.453 cm,MAPE为3.482%,R 2达到0.961,这说明模型预测值与人工测量真实值具有高度一致性,验证了所提方法的可靠性。从图9中的散点分布可以看出,数据点紧密围绕y=x参考线分布,表明预测值与实际值较为接近。同时观察到明显的趋势特征:叶长较小时预测误差较小,随着叶长增加误差逐渐增大。这种趋势主要与两个因素有关:一是较大叶片更容易产生卷曲,导致预测骨架偏离实际主轴;二是较长叶片的叶尖位置更容易出现漏检情况。具体而言,当预测值大于实际值时,往往是由于叶片卷曲导致骨架偏离主轴;当预测值小于实际值时,则多与骨架检测未完整覆盖叶尖位置有关。尽管如此,绝大多数测量结果都维持在合理可用的误差范围内,这充分证明了所提出的方法在骨架检测和表型参数测量应用方面的有效性和实用性。
3 结论
本研究提出了一种基于改进YOLOv11-Pose模型的玉米植株骨架提取方法,以解决田间种植环境光照变化、复杂背景、目标繁多导致的骨架提取难题。通过引入关键点均匀采样和单头自注意力机制,优化了模型对遮挡区域和复杂场景的适应能力,并提高了骨架提取的精度和效率。当关键点均匀采样点数设置为10时,骨架形态与原始骨架的相似度最高(Fréchet距离最低为79.008),实现了形态特征的有效保持与冗余点的削减。改进的YOLOv11-Pose模型在关键点检测任务中的mAP50和mAP50-95分别提升了10.9%和23.8%,展现了在复杂田间环境中的卓越性能。在边界框检测和关键点检测任务中,该方法均实现了精度与效率的良好平衡,单张图像的推理耗时仅为52.7 ms,满足作物生长数据获取需求。
研究进一步结合RGB-D相机提供的空间几何信息,将骨架提取结果应用于表型参数测量,实现株高测量MAE为2.435 cm,叶龄检测误差小于1个生长时期,叶长测量误差3.482%的效果,验证了所提出的方法在表型参数测量应用方面的有效性和实用性。未来研究可结合地面农机、无人机等形成移动式作物信息获取系统,进一步提升玉米骨架检测通量,并探索多目标环境下的骨架提取应用,为更多作物的精细化长势数据获取提供支持。


