

0 Introduction
With the transformation and upgrading of livestock production methods, intensive farming models have shown rapid growth trends in many countries and regions [1]. In intensive farming environments, both the animal stocking density per unit area and the overall population size significantly increase, which improves space utilization and production efficiency but also raises the risk of disease transmission[2, 3], and at the same time, poses new challenges for the refined management of animals. Individual animal behavior can reflect their health status, and environmental adaptability [4]. However, in large group size farming conditions, traditional manual observation struggles to achieve accurate individual identification and continuous monitoring [5]. Therefore, developing automated and intelligent systems for individual animal behavior detection is crucial for improving farm management efficiency and ensuring animal welfare.
Animal behavior detection methods are categorized into contact-based and non-contact-based approaches. Contact-based methods collect motion data using wearable sensors and offer relatively high detection accuracy[6]. Wearable devices based on inertial measurement units (IMUs) represent the mainstream solution for contact-based recognition. Researchers attach tri-axial accelerometers and gyroscopes to animals' necks or legs to capture movement features for behavior classification, which is mainly used in cattle industry. However, contact-based methods face challenges such as high equipment maintenance costs [7] and the potential to induce animal stress responses [8], limiting their widespread application in commercial farming settings. Non-contact methods mainly include video-based and audio-based sensing technologies. The former enables remote monitoring via video surveillance, while the latter identifies specific behaviors by analyzing animal vocalizations. Non-contact methods avoid direct disturbance to animals and are thus suitable for large group size farming conditions [9]. Early video-based non-contact approaches relied on traditional image processing techniques for manual feature extraction, followed by classification using various machine learning algorithms. These machine learning methods heavily depend on feature engineering, which is labor-intensive and requires substantial expert knowledge. Moreover, they exhibit poor algorithmic robustness under complex conditions such as varying illumination, background interference, and object occlusion [10, 11]. In large group size farming environments, frequent animal clustering causes severe occlusion, reducing the localization and segmentation accuracy of traditional machine learning methods, leading to bounding box confusion and missed detections, thereby decreasing classification accuracy.
Deep learning technology, through multi-layer neural networks that automatically extract data features, has introduced a new paradigm for individual animal behavior detection in complex scenarios. Based on task types, deep learning methods are primarily divided into three categories: 1) end-to-end object detection methods, such as You Only Look Once (YOLO)[12] series and Single Shot MultiBox Detector (SSD)[13], which simultaneously perform object localization and classification within a single-stage network, offering high inference speed and strong real-time performance; these have been widely applied in behavior detection of cattle, pigs, and sheep[14]; 2) two-stage detection methods, such as Faster R-CNN (Region-based Convolutional Neural Network)[15] and Cascade R-CNN [16], which are variants of the R-CNN and first generate region proposals and then conduct refined classification, achieving higher detection accuracy at the cost of lower computational speed; 3) instance segmentation methods, such as Mask R-CNN[17] and You Only Look At CoefficienTs (YOLACT)[18], which further segment precise contours of each individual beyond object detection, effectively handling overlapping objects, though requiring substantial computational resources and thus limited in real-time applications. Additionally, pose estimation methods based on keypoint detection[19] identify fine-grained behaviors by locating key body parts (e.g., head, limbs, tail), providing richer semantic information for posture analysis such as standing and lying, but suffer from high annotation costs and poor stability under severe occlusion[20].
Regarding sheep behavior detection, recent research has focused on optimizing deep learning models and their practical deployment across diverse farming contexts. Improved methods based on the YOLO architecture have become the dominant technical approach, enhancing recognition performance through attention mechanisms and feature fusion strategies. For instance, the FESS-YOLOv8n model integrates the efficient multi-scale attention mechanism (EMA) and channel synergistic attention module (SCSA) attention modules for recognizing basic behaviors in indoor housing environments [21]. PD-YOLO employs the convolutional block attention module (CBAM) mechanism and demonstrates practical edge deployment capability on resource-constrained devices [22]. To address challenges in grazing environments, an improved YOLOv5 model integrating the bi-directional feature pyramid network (BiFPN) was developed to maintain performance under variable lighting and weather conditions [23]. In terms of abnormal behavior monitoring, a detection-classification cascade architecture has been reported for identifying disruptive behaviors such as aggression and biting in ranch settings [24]. Furthermore, acoustic monitoring is emerging as a promising non-contact technique, with spectrogram feature fusion methods offering a complementary solution for scenarios where visual occlusion limits camera-based detection [25].
However, these studies are primarily developed for scenarios with relatively dispersed animal distributions, such as grazing pastures or low-occupancy indoor pens. In intensive farming systems, animals exhibit frequent clustering behavior during feeding and resting periods, resulting in severe mutual occlusion that substantially increases recognition difficulty. Moreover, existing work predominantly addresses common behaviors (standing, lying, feeding), with limited attention to minority-class behaviors (such as licking and drinking) that are crucial for health monitoring despite their low occurrence frequency. The combination of frequent occlusion patterns and class imbalance challenges in intensive farming environments necessitates specialized algorithmic approaches beyond those developed for conventional settings.
Hu sheep, an important Chinese meat sheep breed, are known for their docile temperament and good tolerance to confined housing and large group rearing environments [26]. However, existing research on Hu sheep behavior detection is considerably limited. As the intensification of Hu sheep farming increases, larger group sizes in farms leads to severe occlusion, and dynamic changes in lighting conditions further increase the difficulty of extracting visual features. Meanwhile, imbalanced data distribution across different behavioral classes reduces model accuracy in recognizing minority class behaviors. In addition, camera with fixed positions, which is widely used in sheep farms, constrain the model's ability to accurately recognize behaviors of distant or occluded individuals.
To address challenges such as occlusion, imbalanced data distribution, and illumination variations in object detection of Hu sheep in intensive farming environments, the DCAttention YOLO (DC-YOLO) and SheepDatabase (SheepDB) is proposed to achieve accurate detection of Hu sheep and precise recognition of their behavioral categories.
The characteristics of SheepDB present three primary technical challenges for Hu sheep behavior detection tasks: 1) Imbalanced data distribution of behavioral categories leads to reduced model performance in identifying minority class behaviors such as drinking; 2) In intensive breeding scenarios, occlusion between individuals tends to blur object boundaries, causing confusion or missed detections due to the overlap; 3) Significant differences across three lighting conditions challenge the stability of feature extraction: Daytime natural lighting produces clear image features, but shadow interference may weaken local details; Nighttime pseudo-color images suffer from color distortion and texture loss, limiting feature expression; Abnormal lighting conditions exacerbate image quality instability through localized overexposure or underexposure. These complex characteristics demonstrate that traditional object detection algorithms struggle to achieve expected performance in complex livestock production environments, necessitating the design of Hu sheep behavior detection solutions addressing critical issues such as category imbalance, dense occlusion, and varying lighting conditions
The main contributions of this study are summarized as follows.
1) To construct DCAC3K2 by introducing an adaptive detail-contextual attention mechanism to enhance DC-YOLO's ability to focus on subtle visual features of occluded objects and to improve its utilization of contextual information for non-occluded objects.
2) To propose comprehensive classification-quality focal loss (CQFL), which comprehensively considers minority class samples and classification scores during loss calculation. It assigns higher weights to objects with lower classification scores and lower weights to those with higher scores, thereby compensating for the effects of imbalanced data distribution and missing visual information from occlusion.
3) To propose bounding box similarity soft-NMS (BS-NMS), which implements a score decay for sub-optimal boxes through a box similarity-based mechanism, while applying only a slight decay to occluded object boxes to ensure their retention.
4) To propose a pre-training strategy based on SheepDB: partitioning the dataset into three subsets by illumination type to train a "Light-Encoder" (the shallow structure of DC-YOLO). These parameters are used to initialize the detection model, enabling it to differentiate between lighting conditions (e.g., day and night) early in training.
1 Materials and methods
1.1 Dataset
The data for this study was collected from a sheep farm in Tianjin, China. The experimental subjects were 8–10-month-old non-pregnant hybrid ewes of Hu sheep selected for observation. Dahua 1230C-A cameras (focal length: 2.8 mm, resolution: 1 920×1 080, 25 f/s) were mounted on ceiling supports within the sheep sheds, providing a top-down perspective to record the daily behaviors of Hu sheep. Rather than employing strictly fixed camera angles, the installation approach prioritized ensuring that the primary pen areas remained clearly visible in the field of view, with camera angles adjusted appropriately according to the on-site roof structure and mounting conditions. This flexible installation strategy reflects practical deployment scenarios in real-world farming environments.
Nipple drinkers and feeding troughs were placed on one side of each pen, ensuring that all object behaviors (standing, lying, licking, eating, and drinking) occurred within the camera's field of view. Data collection spanned from July 10 to August 25, 2023, and from December 26, 2023, to January 31, 2024, with continuous 24-hour video recording. The cameras automatically switched between daylight and infrared modes, capturing footage under various lighting conditions, including day-night transitions. To enhance data diversity and capture complex scenarios such as occlusion, a shed with a large group size (about 20-30 ewes per pen) was selected as a data source. Fig. 1a shows the planar layout of the cameras, while Fig. 1b illustrates their installation location.
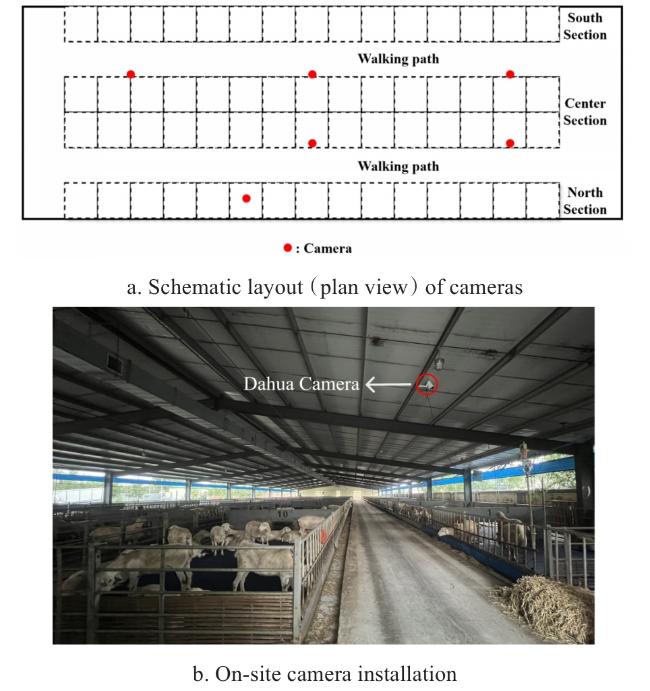
Fig. 1 Camera deployment and installation |
The dataset constructed in this study focused on five typical daily behaviors of farm-raised Hu sheep: standing, licking, lying, eating, and drinking (defined in Table 1 and illustrated in Fig. 2). To build a representative dataset, 55 video clips (30 daytime, 25 nighttime), each 30 minutes long, were manually selected from the raw footage to cover diverse behavioral patterns and lighting conditions. A total of 505 images were obtained by extracting one frame every 10 minutes from these clips.
Table 1 Definitions of 5 typical Hu sheep behaviors |
| Behavior ID | Typical behavior | Description |
|---|---|---|
| 0 | Drinking | Standing with limbs outstretched and drinking water while looking down at the pipe |
| 1 | Eating | Standing with limbs extended and head lowered to eat in front of the feeding trough |
| 2 | Lying | Body resting on the ground, with limbs bent or tucked |
| 3 | Licking | Standing with limbs outstretched and licking the salt brick |
| 4 | Standing | Standing on all limbs with the body supported, and not actively engaged in eating, drinking, or licking |

Fig. 2 Examples of the 5 annotated Hu sheep behaviors |
The X-AnyLabeling tool was used to annotate the bounding boxes for all Hu sheep in each image and label their corresponding behavioral categories. All annotations underwent manual verification to ensure accuracy. The resulting dataset, named SheepDB, was divided into training, validation and test sets in a 7:1:2 ratio. Furthermore, to facilitate the pre-training strategy and an object analysis of model robustness, the dataset was classified into three subsets based on distinct lighting conditions: natural daylight, nighttime infrared, and challenging/transitional illumination.
1.2 Dataset features and analysis
After annotation and quality screening, the dataset contains 505 images with 8 285 labeled instances of Hu sheep behavior. Analysis revealed a notable behavioral category imbalance: standing behavior (36.3%, 3 009 instances) and lying (38.0%, 3 151 instances) dominate, while eating behavior accounts for 22.0% (1 822 instances). Licking behavior (2.2%, 181 instances) and drinking behavior (1.5%, 122 instances) were relatively scarce, as shown in Fig. 3.
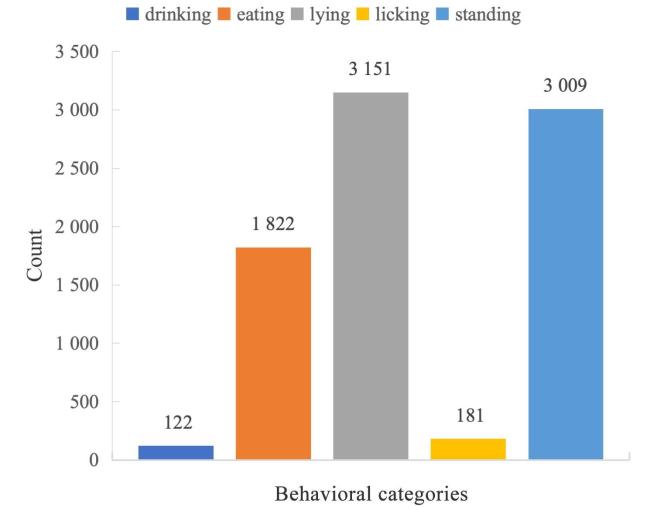
Fig. 3 Distribution of behavior categories in SheepDB |
To address the diversity of lighting conditions, the datasets were categorized into three types based on illumination characteristics, as shown in Fig. 4. The first category comprised daytime natural lighting images characterized by uniform illumination, rich colors, and excellent visual contrast. The second category included nighttime infrared images acquired through infrared imaging technology, which were enhanced with pseudocolor processing to improve nighttime scene visibility. The third category covered abnormal lighting images, covering challenging (or abnormal) lighting conditions, which included light spot interference caused by artificial illumination at night, image blurriness during early morning and evening due to insufficient lighting, and color distortion resulting from sunlight penetrating colored light-filtering materials. These categories encompassed complex scenarios such as day-night alternation, variations in illumination intensity, and special optical interference, ensuring the model's robustness under diverse lighting conditions.
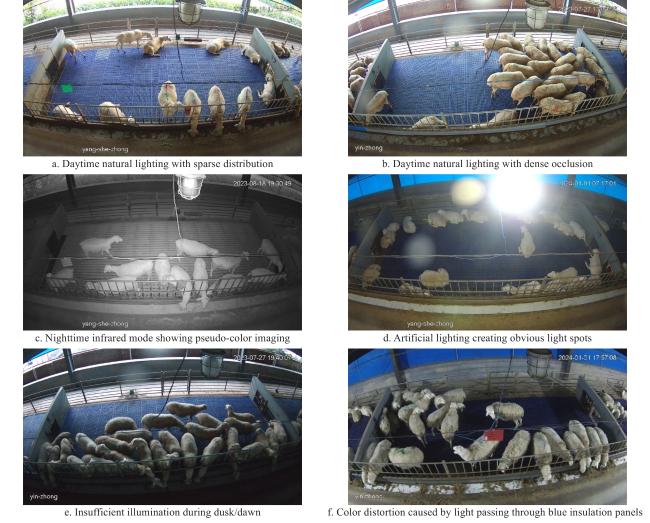
Fig. 4 Representative examples of SheepDB under different illumination conditions and object densities |
In this study, all images from the SheepDB training set were categorized into the aforementioned three illumination classes to construct an image classification dataset for training the Light-Encoder. This classification dataset was split into training and validation subsets at an 8∶2 ratio. This strategy ensures no data leakage into the downstream behavior detection task and enables the model to first learn discriminative representations of varying illumination conditions.
1.3 Method
1.3.1 Object detection algorithm (YOLO)
As a seminal end-to-end object detection framework, YOLO revolutionized object localization through 2 processes: multi-box prediction and post-filtering. This approach achieves two critical functions: object localization and category classification, while maintaining high efficiency and real-time performance that has made it widely adopted in research. YOLOv8[27] model introduced an innovation by incorporating distribution focal loss (DFL)[28] into its detection head. This transformed bounding box regression from absolute coordinates to discrete probability distributions. Subsequent versions like YOLOv11 [29] enhanced this architecture by replacing the C2f structure with C3k2, significantly boosting feature extraction capabilities. YOLOv12[30] builds upon these core innovations, incorporating an Area Attention Mechanism to adapt to diverse detection scenarios and removing the spatial pyramid pooling-fast (SPPF) + cross stage partial with spatial attention (C2PSA) module, achieving a substantial reduction in model parameters at the cost of only a marginal drop in accuracy.
However, YOLO's heavy dependence on post-processing makes it prone to incorrect elimination of true positives in severe occlusion scenarios. In addition, the diversity of illumination conditions in the dataset, the limited dataset size and the imbalanced distribution of behavior categories all increase the difficulty of the task.
Therefore, YOLOv12 was adopted as the baseline and the default parameter configuration of the YOLOv12n model was employed. On this basis, the following improvements were incorporated to achieve behavioral detection of Hu sheep.
1.3.2 Adaptive detail-contextual attention (DCAttention)
Inspired by biological vision mechanisms and the regional attention partitioning strategy in YOLOv12, humans can quickly locate unobstructed objects in images through holistic perception when searching for specific objects. However, when required to identify all objects[31] (especially small or occluded ones), human tend to adopt a line-by-line scanning strategy. When encountering regions of interest (ROI) with missing information but suspected objects, visual attention focuses on these areas for detailed analysis, using subtle visual features to confirm object presence and classify them. Mimicking this process, adaptive detail-contextual attention (DCAttention) was proposed.
DCAttention employs each pixel as a query to achieve dual perception: 1) detail perception through neighborhood sampling, and 2) context perception through global sampling. This mechanism dynamically calculates attention weights for object pixels by coupling local details with global context. When the object is unobstructed, context features receive higher weights; when occluded, the neighborhood's weight becomes dominant. This dual-perception coupling forms an adaptive attention mechanism, enabling feature map pixels to autonomously adjust whether to rely more on neighboring pixel details or context information for object detection. Fig. 5 illustrates the computation process of DCAttention.
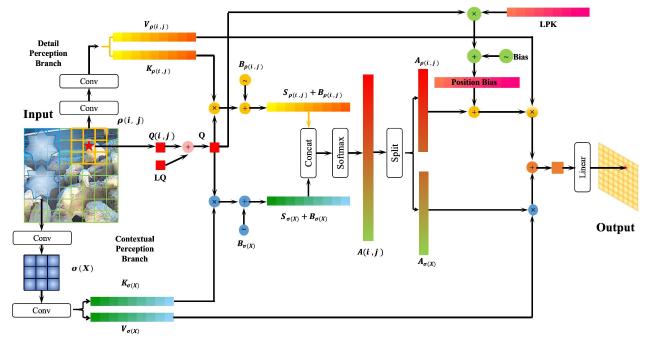
Fig. 5 DCAttention computation process |
For a given image, DCAttention took the pixel (i, j) as the center and used each pixel within the central neighborhood k×k window region | |=k 2 as the source of detail-perception Key and Value components (in this study, k=3, i.e., a 9-pixel neighborhood). A k×k convolution was applied with a stride of k to extract global contextual information as the source of context-perception key and value components (thereby transforming the original feature map into one of size × , where each resulting pixel served as a Key and Value source), and the feature map after this operation was denoted as . To enhance spatial position awareness and emphasize detailed information extraction, two learnable positional encodings were introduced: positional features were embedded into the learnable query (LQ), and the learnable positional key (LPK) was incorporated into the detail-perception branch. Finally, a scaled cosine attention mechanism was adopted to compute adaptive weights. This design enabled the model, upon completion of training, to dynamically adjust the coupling weights between detail perception and context perception according to the occlusion state of the object, the completeness of visual features.
In the computation of the entire DCAttention, the attention scores for the detail-perception and context-perception branches are calculated as in Equation (1) and Equation (2) :
Where, and represent the Keys computed on and , respectively; and represent the attention scores computed on and , respectively; is the query at pixel (i, j).
Then, positional biases were incorporated into the two branches respectively. For the detail-perception branch, a learnable positional bias B(i, j) was adopted, while the global context-perception branch introduced log-spaced continuous position bias (log-CPB) to characterize the relative coordinate relationships in global features. The positional biases are directly concatenated in a one-to-one correspondence with the queries of both branches, as in Equation (3) :
After adding positional bias to the two branches, the attention scores of the coupled two branches were combined, and the attention weights were calculated through the softmax function. By splitting the coupled attention weights (A), the detail-perception weights and context-perception weights can be obtained. This achieves dynamic adjustment of the contribution weights between detail perception and context perception based on the completeness of the object visual features. The calculation is as Equation (4) and Equation (5) :
Where, is the attention weights at pixel (i, j); represent the attention weights computed on and , respectively; The other variables are the same as those in the above formula.
Multiplied the segmented attention weights with the corresponding branch's value and coupled the computation results. Finally, mapped the coupled features through a fully connected layer to obtain the pixel value at position (i, j) in the new feature map. The calculation is as Equation (6) and Equation (7) :
Where, is the computation result of DCAttention at pixel (i, j); represents a fully connected layer computation; represent the attention weights computed on and , respectively; The other variables are the same as those in the above formula.
1.3.3 DCAC3K2
Inspired by the structural design concepts of C3K2 in YOLOv11 and A2C2f in YOLOv12, DCAttention was integrated into the C3K2 architecture to form DCAC3K2. DCAC3K2 can focus on extracting large-scale contextual information near the object center when the object is unobstructed, while paying more attention to detailed features in small regions around the object center when the object is obstructed. As shown in Fig. 6, to optimize computational efficiency and control parameter size, DCAC3K2 divides input information into two parts by channel. One part undergoes three consecutive DCAttention computations, while the other part is merged across channels. The output channel was then adjusted using a 1×1 convolution kernel to maintain the input dimensions. In the DC-YOLO design, DCAC3K2 was applied to both shallow and deep layers of the backbone network to enhance the model's adaptive feature extraction capability: emphasizing low-dimensional detail extraction in shallow layers while focusing on high-dimensional abstract feature extraction in deep layers.
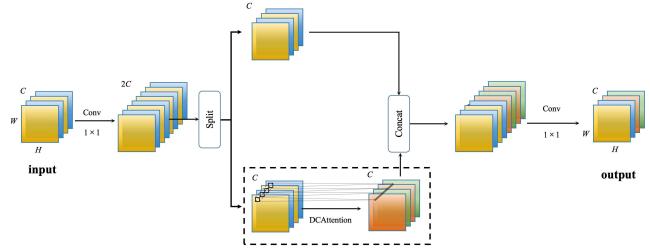
Fig. 6 DCAC3K2 structure |
Where, C, H, and W represent the channel, length, and width of the feature map, respectively.
1.3.4 Comprehensive classification-quality focal loss (CQFL)
Inspired by Focal Loss, CQFL was proposed. This loss function guided the model to focus on minority class behaviors like drinking and licking, as well as occluded objects during training, while reducing attention weights for well-sampled, information-sufficient objects. This approach aimed to enhance learning efficiency for minority class behaviors and information-deficient samples, ultimately improving the overall recognition accuracy of DC-YOLO.
Each behavior category score predicted for a single bounding box was treated as a binary classification task, and the binary cross-entropy loss (BCEL) was used to calculate the loss value of a single box, as shown in Equation (8) :
Where, represents the number of behavior categories; and represent the model's predicted probability value and label value for the object box with behavior category c, respectively.
Calculate the loss between all predicted bounding boxes and the ground truth bounding boxes to form the total classification loss, as shown in the Equation (9) :
Where, represents the number of bounding boxes; represent the ground truth label and predicted probability list of the i-th bounding box, respectively.
To address the issue of insufficient samples of drinking and licking behavior, a class weighting mechanism was introduced. Based on the statistical distribution of sample quantities {n1, n2, ..., nc } in the training set, the calculation method for the category weight Wi of behavior category i is as Equation (10) :
As shown in Equation (10) , the fewer the number of samples in a category, the larger the weight coefficient assigned to it. A square root function was employed for smoothing to ensure that categories with a larger number of samples can also obtain reasonable weights, thereby avoiding excessive suppression.
Moreover, considering that occluded objects during training tend to have lower scores in classification, a weighting term was introduced into the loss function to assign higher loss weights to bounding boxes with lower classification confidence[28]. Finally, by integrating the class weight term and the information deficiency weight term ( , CQFL was formulated. CQFL is calculated as Equation (11) :
Where, α and β represent the weighting coefficients for the minority classes weighting term and the predicted probability weighting term, respectively. This indicates that difficult samples in model predictions are assigned greater weights.
1.3.5 Bounding box similarity soft-NMS (BS-NMS)
In YOLO, the NMS algorithm was used during validation to filter the large number of bounding boxes generated by the model, retaining appropriate ones to improve accuracy [32]. To ensure that severely occluded Hu sheep of the same class are retained during post-processing, BS-NMS was proposed. BS-NMS computed a comprehensive metric based on both Intersection over Union (IoU) and aspect ratio similarity between each candidate box and the current highest-scoring box (i.e., the leading box), and applied weighted confidence decay accordingly. After score decay, suboptimal boxes fell below the post-processing confidence threshold (typically 0.25) and were suppressed, while occluded object boxes maintained confidence above this threshold, thereby achieving effective suppression of redundant detections while preserving occluded instances.
When calculating the decay function, the aspect ratio similarity ( ) with all candidate boxes of the same category is computed as Equation (12) :
Where, is the aspect ratio similarity with all candidate boxes of the same category; (hi, wi ) and (hm, wm ) represent the height and width of the current candidate box ( ) and the leading box ( ), respectively. To enhance the algorithm's sensitivity to minor proportional differences, a logarithmic form of aspect ratio similarity is adopted. Equation (12) indicates that the higher the similarity of aspect ratios between two bounding boxes, the higher the calculated similarity p.
Based on the calculated similarity between two bounding boxes, the formula for assigning a score decay weight to candidate boxes and computing new scores is as Equation (13) and Equation (14) :
Where, and represent the score decay weight, bounding box score and new score of the i th candidate boxes, respectively; The variables are the same as those in the above formula.
Fig. 7 shows the pseudocode of BS-NMS post-processing algorithm proposed in this study. Based on the NMS algorithm, the score of each candidate box was updated using weights, rather than directly setting the candidate box score to zero. D was the set of detection boxes obtained from the model's predictions, which was initialized as an empty set and populated in each iteration with a group of bounding boxes to be retained along with their behavior categories.
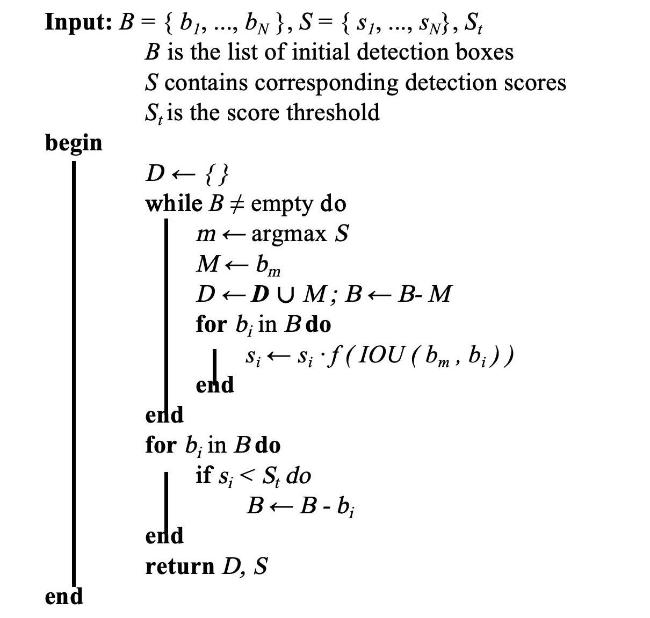
Fig. 7 Pseudocode for BS-NMS |
1.3.6 Light-Encoder
The dataset introduced in Section 1.2 encompassed image samples from Hu sheep farms under various day-night lighting conditions. To mitigate the impact of lighting variations on model performance, enabling the model to learn illumination characteristics during the initial training phase enhanced its generalization capability for round-the-clock monitoring. A lighting classification model was designed as a pre-training task using an encoder-decoder architecture (Fig. 8): The encoder extracted lighting and color features from images through a DC-YOLO shallow feature fusion module, while the decoder mapped features to lighting categories via a YOLO classification head.
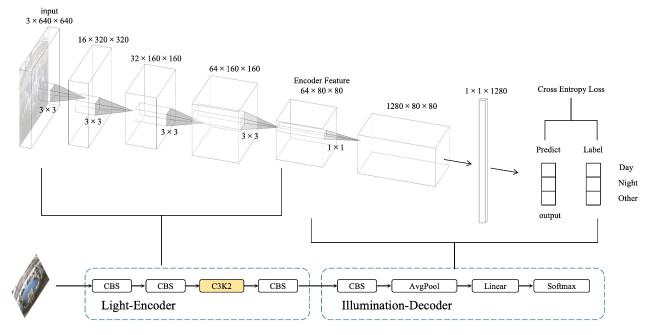
Fig. 8 Architecture of the light encoder and its classification head |
During the DC-YOLO training process, the Light-Encoder transferred its pre-trained weights to the shallow layers of DC-YOLO, enabling DC-YOLO to establish an implicit representation of illumination conditions within the shallow network.
1.3.7 Overall architecture
Based on the aforementioned difficulty analysis and targeted improvement strategies, the architectural and modular advantages of YOLOv12 were integrated in this study to construct DC-YOLO (Fig. 9).
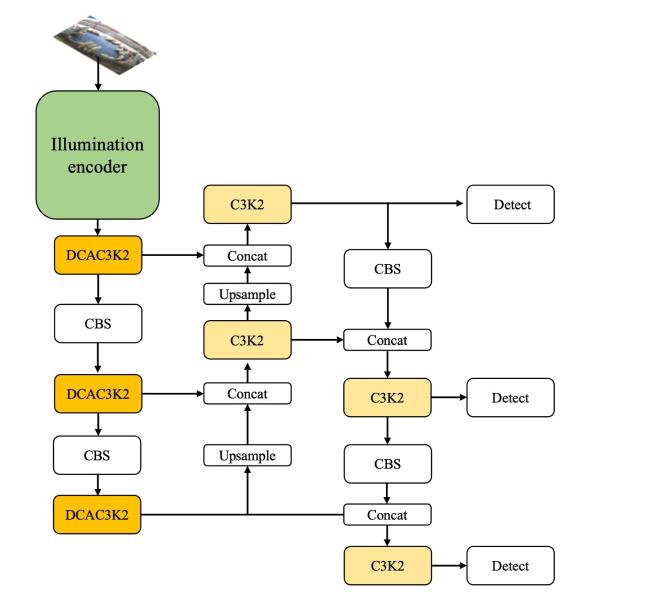
Fig. 9 DC-YOLO structure |
DCAC3K2 was introduced in the feature extraction stage, while the Light-Encoder structure was deployed in the shallow layers of the model. Fig. 9 shows DC-YOLO architecture diagram, where the modules responsible for feature extraction and output to the feature fusion layer in the backbone network are replaced with DCAC3K2. By removing SPPF and C2PSA combination, the parameter count was significantly reduced, while C3K2 was adopted in the Neck section for feature fusion. The use of CQFL enabled DC-YOLO to focus more on difficult samples during training. During training, the weight parameters of the corresponding layer were initialized by loading pre-trained Light-Encoder weights. For intensive Hu sheep farms, BS-NMS algorithm was applied in the validation stage to effectively retain intra-class occluded objects.
1.4 Experimental environment and evaluation metrics
1.4.1 Experiment environment
To verify the effectiveness of this research method, ablation experiments were conducted on the DC-YOLO architecture, and comparative experiments were performed between DC-YOLO and mainstream object detection models. Table 2 details the experimental environment configuration.
Table 2 Experimental environment |
| Configuration Item | Value |
|---|---|
| CPU | Intel(R) Xeon(R) Platinum 8352 V CPU @ 2.10 GHz |
| GPU | NVIDIA GeForce RTX 4090 |
| OS | Ubuntu 20.04 |
| Programming language | Python 3.8 |
| Deep learning framework | PyTorch 2.0.0 |
| Version of CUDA | CUDA 11.8 |
| System RAM | 120 GB |
After image preprocessing, input images of DC-YOLO were resized to 640×640, batch size was set to 32, initial learning rate maintained at 0.01, momentum parameter kept at 0.937, weight decay coefficient adjusted to 0.000 5, patience was 10, dropout was 0.1. Training was performed on GPU devices using the SGD optimizer with 150 epochs.
1.4.2 Evaluation metrics
The model performance on datasets was evaluated using three metrics: Precision (P), Recall (R), mean Average Precision (mAP) under the curve with a 0.5 threshold (mAP@50), and mAP@50:95 denoted the average of mAP computed across multiple IoU thresholds ranging from 0.5 to 0.95 with a step size of 0.05. Model size and validation speed were assessed through parameters, giga floating-point operations (GFLOPs), and frame per second (FPS).
For the IoU between predicted bounding boxes retained after NMS algorithm and ground truth boxes, it can be determined whether a predicted box is a true positive (TP). Based on this, Precision and Recall are calculated as Equation (15) and Equation (16) :
Where, nc represents the number of behavior categories with i representing the i-th category. TP, FP, and FN represent the counts of true positives, false positives, and false negatives, respectively.
Average precision (AP) for each category comprehensively considers the precision and recall within that behavioral category, defined as the area under the P-R curve. The mAP is obtained by calculating the mean of the AP across all behavioral categories. AP and mAP are computed as Equation (17) and Equation (18) :
FLOPs (Floating Point Operations) serve as a metric for quantifying the computational complexity of a model, representing the number of floating-point operations required during inference. Higher FLOPs correspond to increased computational cost and reduced inference speed. Typically, FLOPs are calculated based on the forward propagation process of the model and characterize the operations at each layer. FLOPs is obtained by summing the FLOPs of each layer, which can be estimated using Equation (19) and Equation (20) :
Where, n represents the total number of layers in the model; represents the number of input channels; represents the number of output channels; represent the height and width of the feature map; represents the size of the convolutional kernel. GFLOPsrepresent 1 billion FLOPs.
Parameters represent the enumeration of weights within the model. The parameter count directly determines the spatial complexity of the model, signifying the storage footprint it imposes. The total number of parameters can be calculated using Equation (21) :
The variables are the same as those in the FLOPs formula. The total number of parameters represents the memory cost of the model.
FPS represent the average number of frames processed per second. Since only CPU-based computing devices are typically available in real-world production environments, all reported FPS values are computed using a CPU unless otherwise specified, ensuring that the reported inference speed closely reflects practical deployment conditions. In this study, FPS is computed as Equation (22) :
Where, tpre, tinfer, and tpost represent the preprocessing, inference, and post-processing times respectively during validation. The sum of these three times constitutes the total processing time for a single image.
2 Results and analysis
During model training, the Light-Encoder was trained first on the illumination classification dataset, with its pre-trained weights preserved. The top-1 accuracy of the classification network reached 98.5%. DC-YOLO was then initialized using these pre-trained weights.
2.1 Ablation experiments and analysis
DCAC3K2, CQFL, BS-NMS, and SPPF+C2PSA, along with their combinations, were incorporated into the baseline model (YOLOv12) for ablation experiments. The results of the ablation experiments on the test set are presented in Table 3. Notably, when both DCAC3K2 and A2C2f are present, A2C2f replaces only the C3K2 module within the DC-YOLO architecture.
Table 3 Results of ablation experiments of DC-YOLO |
| Model | DCAC3K2 | CQFL | BS-NMS | A2C2f | P/% | R/% | mAP@50/% | mAP@50:95/% | Parameters/M | t infer/ms | t post/ms |
|---|---|---|---|---|---|---|---|---|---|---|---|
| YOLOv12 | × | × | × | √ | 81.6 | 78.5 | 83.6 | 64.9 | 2.51 | 172.8 | 0.37 |
| 1 | √ | × | × | √ | 79.0 | 87.7 | 86.7 | 66.0 | 2.17 | 130.3 | 0.31 |
| 2 | × | √ | × | √ | 85.9 | 74.5 | 85.5 | 66.9 | 2.51 | 165.3 | 0.39 |
| 3 | × | × | √ | √ | 83.7 | 82.8 | 87.6 | 68.6 | 2.51 | 168.2 | 1.60 |
| 4 | √ | √ | × | √ | 86.5 | 86.2 | 88.0 | 71.5 | 2.17 | 143.2 | 0.37 |
| 5 | √ | √ | √ | √ | 91.0 | 86.8 | 90.1 | 73.8 | 2.17 | 133.5 | 1.74 |
| 6 | √ | √ | × | × | 85.9 | 86.1 | 88.9 | 73.5 | 2.29 | 163.7 | 1.71 |
| DC-YOLO | √ | √ | √ | × | 91.0 | 86.6 | 91.4 | 75.9 | 2.29 | 115.5 | 1.69 |
|
In terms of model architecture, loss function, and post-processing methodology, the YOLOv12 framework was adopted as the basis and the three proposed components were incrementally integrated. Finally, a comparative study was conducted between the region-attention-based A2C2f module and the convolution-based C3K2 module in the feature fusion stage, culminating in the final DC-YOLO model architecture. DCAC3K2's superior handling of information-deficient objects resulted in reduced confidence scores for well-informed objects compared to YOLOv12, leading to a 2.6 percentage points decrease in overall P while boosting R and mAP by 9.2 and 3.1percentage points, respectively, with a 13.4% reduction in parameter count. CQFL focused on challenging samples improved precision and mAP by 4.3 and 1.9 percentage points, respectively, though at the cost of a 4 percentage points R drop. Incorporating BS-NMS for post-processing during validation enhanced precision, recall, and mAP by 2.1, 4.3, and 4 percentage points respectively. Although this increased post-processing time by 1.23 ms, the additional post-processing overhead was negligible relative to the inference time.
Furthermore, the synergistic effects of these methods relative to the baseline model (YOLOv12) were experimentally validated in this study. The combination of DCAC3K2 and CQFL improved precision, recall, and mAP by 4.9, 7.7, and 4.4 percentage points, respectively. Subsequently, replacing the post-processing algorithm with BS-NMS further enhanced precision, recall, and mAP by 9.4, 8.3, and 6.5 percentage points. When Model 6 replaced A2C2f in the feature fusion section of Model 5 with C3K2, mAP decreased from 90.1% to 88.9%, while the parameters increased by approximately 5.5% compared with Model 4. The integrated DC-YOLO, which combined DCAC3K2, CQFL, and BS-NMS with C3K2 in feature fusion, achieved an 11-percentage-point improvement in mAP@50:95 and 7.8 percentage points mAP boost over the baseline model. Finally, DC-YOLO had 2.29 M parameters, an 8.74% reduction compared to YOLOv12. On CPU, the inference time of DC-YOLO was reduced to 115.5 ms and the frame rate increased to 8.50 f/s, corresponding to improvements of 33.2% and 48.9%, respectively. The compiled data in Table 3 and the detailed analysis clearly demonstrate the impact of each introduced module on algorithmic effectiveness.
To investigate the effect of initializing DC-YOLO with pre-trained weights from the Light-Encoder, an ablation experiment was designed on the pre-training weights. Since the shallow structures of YOLOv11, YOLOv12, and Light-Encoder were identical to that of DC-YOLO, 3 different pre-trained weights and randomly initialized weights were used to initialize the corresponding layers of three models. YOLOv11n and YOLOv12n referred to the official Nano version pre-trained weights released by Ultralytics, which had the same parameter configuration in the corresponding layers as DC-YOLO during training. Since the ablation experiment only transferred the weights of the corresponding layers from the pre-trained models to DC-YOLO, all experimental settings had the same number of parameters. The results in test set are presented in Table 4. Among them, YOLOv11n and YOLOv12n employ only shallow-layer weight initialization for their respective models to control variables, ensuring that all three pre-trained weight sets initialize only the front-layer modules of the model. Moreover, three test sets were constructed separately using the data under the three lighting conditions in the test set, and each test set was evaluated using its corresponding model; the mAP values of the model under different lighting categories were reported.
Table 4 Results of ablation experiments based on Light-Encoder and pretrained model of DC-YOLO |
| Model | Pre-training method | mAP/% | P/% | R/% | |||
|---|---|---|---|---|---|---|---|
| daytime natural | nighttime | abnormal lighting | All | ||||
| YOLOv11 | YOLOv11n | 93.0 | 82.9 | 84.5 | 87.3 | 88.1 | 83.9 |
| Random initial weights | 91.9 | 82.1 | 83.9 | 86.8 | 83.4 | 81.8 | |
| Light-Encoder | 92.8 | 83.4 | 88.4 | 88.9 | 84.9 | 77.6 | |
| YOLOv12 | YOLOv12n | 92.5 | 80.8 | 78.7 | 84.6 | 79.5 | 82.7 |
| Random initial weights | 91.8 | 80.1 | 77.3 | 83.6 | 81.6 | 78.5 | |
| Light-Encoder | 92.4 | 82.9 | 80.1 | 85.7 | 77.4 | 85.9 | |
| DC-YOLO (ours) | YOLOv11n | 94.1 | 84.3 | 87.4 | 90.6 | 90.0 | 86.1 |
| YOLOv12n | 94.0 | 84.4 | 86.9 | 90.5 | 83.7 | 85.1 | |
| Random initial weights | 93.1 | 83.7 | 85.9 | 89.9 | 83.4 | 87.6 | |
| Light-Encoder | 93.9 | 85.1 | 89.3 | 91.4 | 91.0 | 86.6 | |
Results demonstrated that initialization methods resulted in similar mAP values. Pre-trained initialization outperformed random initialization for DC-YOLO. Specifically, targeted Light-Encoder initialization optimized the feature extraction module of the backbone, though the performance improvement remained limited. In the context of this study, the architectural improvements in DC-YOLO proved more effective than the pre-training strategy. Moreover, the YOLOv11, YOLOv12, and DC-YOLO models achieved improvements of 4.5, 2.8, and 3.4 percentage points, respectively, under abnormal lighting conditions when using the Light-Encoder initialization method compared to random initialization; under nighttime conditions, the corresponding improvements were 1.3, 2.8, and 1.4 percentage points, respectively. These results demonstrated the effectiveness of the Light-Encoder in addressing diverse illumination challenges.
2.2 Comparative experiments
To evaluate the effectiveness of DC-YOLO, the following baseline models were selected for comparison based on computational efficiency and practical applicability: YOLOv8[27], YOLOv9[33], YOLOv10[34], YOLOv11 [29], YOLOv12 [30], YOLOv13 [35], RT-DETR[36], DAB-DETR[37] and DINO[38]. All YOLO models were configured in their smallest parameterized versions (n: Nano). In validation tests, the auxiliary decision branches were removed from YOLOv9 and YOLOv10 to calculate their parameter counts. Table 5 presents the comprehensive performance metrics of these models compared with DC-YOLO under identical datasets and experimental configurations.
Table 5 Comparison of performance among different models on SheepDB |
| Model | P /% | R /% | mAP /% | Parameters/M | Computational/GFLOPs | FPS/(f/s) |
|---|---|---|---|---|---|---|
| YOLOv8 | 81.4 | 81.6 | 85.8 | 2.69 | 6.8 | 8.56 |
| YOLOv9 | 83.5 | 78.0 | 84.3 | 2.43 | 6.4 | 7.03 |
| YOLOv10 | 79.4 | 76.4 | 82.2 | 2.27 | 6.5 | 7.51 |
| YOLOv11 | 83.4 | 81.8 | 86.8 | 2.59 | 6.4 | 7.58 |
| YOLOv12 | 81.6 | 78.5 | 83.6 | 2.51 | 6.9 | 5.71 |
| YOLOv13 | 77.9 | 83.8 | 83.9 | 2.45 | 6.1 | 4.29 |
| DINO | 62.7 | 67.6 | 68.7 | 47.00 | 279.0 | 2.58 |
| DAB-DETR | 43.2 | 51.7 | 50.4 | 43.00 | 195.0 | 2.52 |
| RT-DETR | 63.1 | 73.6 | 71.4 | 42.77 | 130.5 | 1.21 |
| DC-YOLO | 91.0 | 86.6 | 91.4 | 2.29 | 6.2 | 8.50 |
Experimental results demonstrated that DC-YOLO achieved 91.0% P, 86.6% R, and 91.4% mAP. Within YOLO series, YOLOv8 and YOLOv11 exhibited higher precision, while YOLOv12 showed relatively lower accuracy. This discrepancy may stem from YOLOv12's region attention mechanism being unsuitable for dense livestock farming detection tasks. Notably, RT-DETR, DAB-DETR and DINO, despite their large parameter size, achieved the lowest mAP. Models that discarded post-processing methods require more parameters to match YOLOv8's detection accuracy. DC-YOLO outperformed all competing models with 8.50 f/s, while maintaining a small parameter size (8.74% reduction compared to YOLOv12), achieving a 48.9% f/s improvement. Overall, DC-YOLO delivered superior accuracy and efficiency.
2.3 Performance of DC-YOLO
To validate the performance of DC-YOLO in practical farm scenarios, the performance of DC-YOLO in Hu sheep behavior detection and its adaptability under different illumination conditions were evaluated in this study.
2.3.1 DC-YOLO's performance in behavior detection
Table 6 compares the detection accuracy of YOLOv12 and DC-YOLO in identifying typical behaviors of Hu sheep on the test set of SheepDB. Here, ALL refers to the average results across all behaviors. DC-YOLO outperforms YOLOv12 across all metrics, with the most significant improvement in licking behavior. However, its mAP remains at 76.5%, as shown in Table 6 and Fig. 10a confusion matrix, which indicates that licking is frequently misclassified as standing. For recognizing behaviors such as drinking, feeding, lying down, and standing, DC-YOLO demonstrates robust performance.
Table 6 Comparison of performance of YOLOv12 in different categories |
| Behavior | DC-YOLO | YOLOv12 | ||||
|---|---|---|---|---|---|---|
| P /% | R /% | mAP /% | P /% | R/% | mAP /% | |
| Drinking | 90.8 | 98.7 | 95.9 | 76.8 | 76.2 | 80.7 |
| Eating | 96.1 | 96.0 | 97.8 | 95.4 | 95.0 | 97.2 |
| Lying | 93.8 | 86.3 | 92.8 | 91.1 | 85.7 | 92.8 |
| Licking | 80.5 | 63.6 | 76.5 | 54.3 | 51.5 | 54.0 |
| Standing | 93.8 | 86.9 | 94.4 | 91.2 | 84.2 | 93.1 |
| All | 91.0 | 86.6 | 91.4 | 81.6 | 78.5 | 83.6 |
Compared to YOLOv12, DC-YOLO showed improvements of 9.4 percentage points in precision, 8.1 percentage points in recall, and 7.8 percentage points in mAP.
Moreover, since the number of drinking and licking behavior samples in SheepDB was relatively small, the improvement in DC-YOLO's prediction accuracy for these two behaviors also validated its effectiveness in addressing data distribution imbalance issues. As shown in Fig. 10, when comparing the confusion matrices of DC-YOLO and YOLOv12, DC-YOLO demonstrated superior prediction accuracy for drinking and licking tasks.
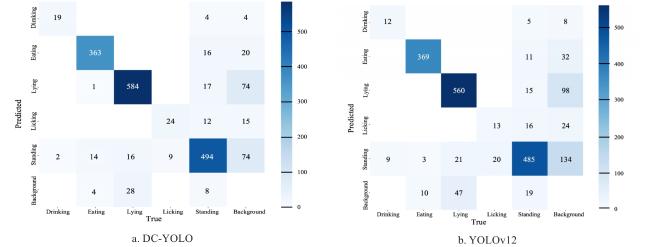
Fig. 10 Normalized confusion matrix |
In Fig. 10, when the predicted bounding box of the model fails to match the annotated bounding box, then the Ground Truth for this predicted box is "background". This type of error mostly originates from unannotated targets in other sheep pens on both sides of the image.
2.3.2 DC-YOLO's performance under different illumination conditions
To evaluate the performance of DC-YOLO in 24/7 Hu sheep behavior detection tasks under varying illumination conditions, images from intensive farming scenarios with different lighting conditions were selected, and the performance was assessed by observing the corresponding detection results. Fig.11 to Fig.15 present the Hu sheep behavior detection results on images from the test set under varying lighting conditions. These figures show DC-YOLO with BS-NMS post-processing, with default NMS, and with YOLOv12 and default NMS across multiple scenarios, respectively. The red arrows highlight differences among the three methods. Challenging regions (e.g., occluded objects or low-information areas) were enlarged to highlight the model's detection details of typical Hu sheep behaviors.
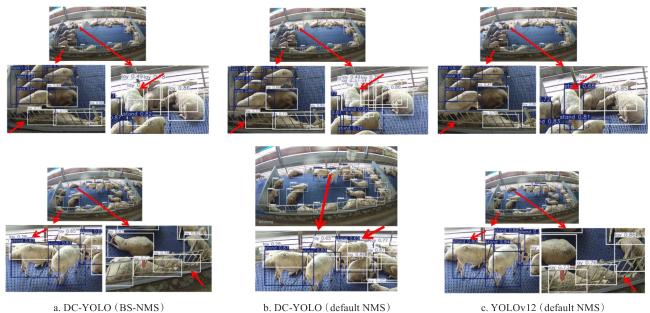
Fig. 11 Comparison of detection results of different models under normal daylight conditions |
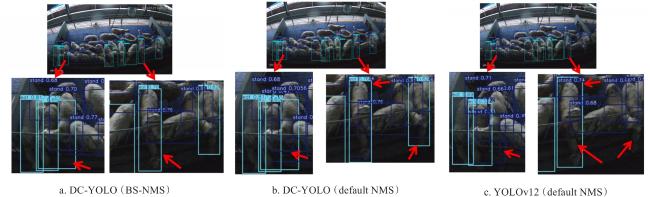
Fig. 12 Comparison of detection results of different models in a dim evening scenario |
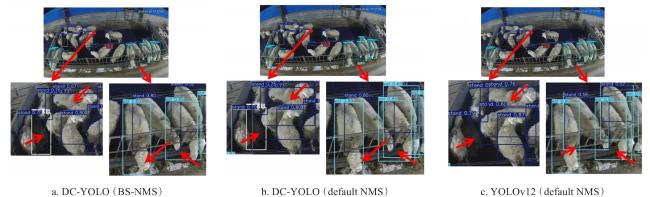
Fig. 13 Comparison of detection results of different models under daytime illumination with light filtered by blue insulation panels |
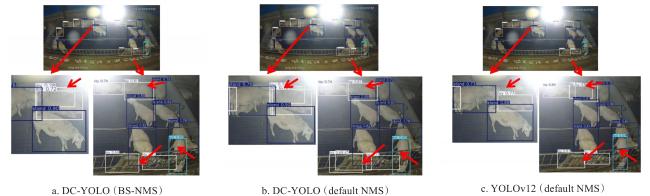
Fig. 14 Comparison of detection results of different models under nighttime conditions with artificial light spot interference |
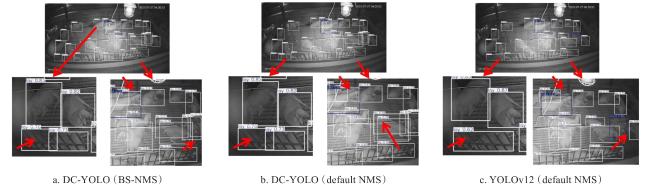
Fig. 15 Comparison of detection results of different models under nighttime infrared illumination |
The visualization detection results from Fig. 11 to Fig. 15 indicate that YOLOv12 tends to miss detections in occluded regions or dark corners where information is incomplete. When DC-YOLO used the default NMS algorithm, multiple bounding boxes of similar behaviors were retained for closely related behavior categories, resulting in overlapping boxes, while partially occluded objects may be incorrectly removed. In contrast, DC-YOLO with BS-NMS algorithm correctly eliminated suboptimal boxes and effectively resolved the overlapping box issue by retaining only those with higher behavioral confidence scores.
Furthermore, comparing YOLOv12 and DC-YOLO, YOLOv12's misjudgment of behavior stems from bounding box detection. Due to the barrier's obstruction, YOLOv12 often failed to detect the elongated neck of the Hu sheep during bounding box determination, whereas DC-YOLO's detection box can fully cover the animal's body.
The visualization results in real-world scenarios clearly demonstrated the superiority of DC-YOLO and the effectiveness of BS-NMS in dense environments. Furthermore, validation under various lighting conditions confirmed DC-YOLO's reliability, making it suitable for all-day identification of Hu sheep behavior in intensive farms.
3 Discussion
To better evaluate the performance of DC-YOLO in detecting behaviors of Hu sheep, the impact of dataset construction and post-processing algorithms on model performance was discussed, and future work was explored by integrating the detection results of DC-YOLO with tracking tasks.
3.1 Limitations in dataset and model
In intensive farming environments, the construction of datasets required for training animal behavior detection models still faces the following challenges. First, the high variability in farm scenarios—such as diverse camera positions and the fluctuating spatial distribution of Hu sheep—makes it difficult to train models with robust generalization capabilities. Second, dataset quality is often compromised by inconsistent collection methods, ambiguous annotation objectives, and a lack of clear, standardized behavioral definitions.
Strategies to enhance data utilization efficiency in datasets with limited samples were explored in this study by optimizing datasets, models, and training methodologies. To address information gaps caused by occlusion and lighting variations in dense scenes, targeted annotations were implemented during dataset construction. When selecting image samples, diverse lighting conditions and detection challenges were comprehensively evaluated, and images with significant occlusion and complex lighting scenarios were included to better simulate real-world conditions. Furthermore, DC-YOLO assigns higher weights to occluded regions during training, improving data efficiency. Ultimately, this research achieves high-performance behavioral detection models trained on small-sample datasets.
Regarding occlusion-induced object information loss, the issues of missed detection and erroneous deletions stem not only from the model but also from post-processing algorithms. This study achieves the removal of suboptimal boxes and retains occluded objects through improved post-processing algorithms. Simultaneously, it resolves the overlapping box problem where a single object is classified into multiple categories or multiple boxes are retained. Fig. 11 to Fig. 15 demonstrate how DC-YOLO, when combined with BS-NMS algorithm, effectively eliminates erroneous category boxes in overlapping regions.
However, post-processing algorithms in YOLO series must traverse at least 8 400 object boxes, making this stage a non-negligible computational step. Experimental results in Table 3 show that the proposed BS-NMS algorithm requires 1.6 ms on the CPU, while the default NMS algorithm needs only 0.3 ms. Although this introduces an additional 1.3 ms of processing time, this increase constitutes only a small fraction of the overall inference pipeline. This demonstrates that modifying the post-processing algorithm can substantially improve behavior detection performance in dense scenes without significantly impacting the total prediction speed. Therefore, introducing specialized post-processing methods and diversified IoU calculations for box overlap evaluation in model post-processing approaches based on real-world scenarios represents a highly efficient research direction for enhancing model accuracy in dense scenes, offering a favorable trade-off between accuracy and speed.
Furthermore, regarding model performance, even when achieving high accuracy on the validation set, the training and validation sets were randomly partitioned from a single annotated data source and therefore share the same distribution. High validation accuracy consequently reflects the goodness of fit within this distribution rather than generalization to unseen farm environments, and the limited dataset size makes it difficult to rule out bias inherited from the data source itself.
To position DC-YOLO within existing sheep behavior detection research, the technical differentiators were noted: while recent studies achieve high accuracies through attention mechanisms [21, 22] or multi-weather adaptability [23], DC-YOLO specifically prioritizes occlusion handling through specialized architectural and post-processing designs (DCAttention, BS-NMS). Practical deployment gaps were further addressed through the inclusion of minority-class behaviors (licking, drinking) and illumination-aware pre-training. Although PD-YOLO [22] reported higher mAP (96.9%), the emphasis on occlusion-prevalent scenarios and minority-class behavior detection represents complementary technical contributions to the field.
While DC-YOLO demonstrates strong performance on the SheepDB dataset, it is important to acknowledge the limitations regarding the model's applicability and generalization capability. The current validation is confined to a specific farm environment in Tianjin, China, where data was collected under particular infrastructure conditions, including fixed camera positions mounted on ceiling supports and a specific pen layout with nipple drinkers and feeding troughs positioned on one side. Although the dataset encompasses diverse lighting conditions and various degrees of occlusion typical of intensive farming, all samples were acquired from a single facility with consistent physical characteristics such as blue-green partition panels and a uniform flooring type.
The generalizability of DC-YOLO to farms with different scales, structural configurations, camera viewing angles, and environmental characteristics remains to be systematically validated. For instance, farms with different ground materials, pen designs, or camera mounting heights may present visual features that differ from those in the current training data. While the proposed technical components—including DCAttention for handling occlusion, CQFL for addressing class imbalance, and the Light-Encoder for illumination adaptation—were designed based on general principles that should theoretically transfer across different scenarios, their effectiveness in diverse farm environments requires empirical verification.
To sum up, these limitations may have three main solutions. First, the dataset scale will be substantially expanded by collecting data from multiple farms with varying infrastructure configurations, camera specifications, and environmental conditions. This expanded dataset will include farms of different sizes, diverse camera mounting angles and heights, and varied visual backgrounds to ensure comprehensive coverage of real-world deployment scenarios. Second, systematic cross-farm validation experiments will be conducted to rigorously assess the model's generalization capability, including evaluating performance degradation when models trained on one farm are directly applied to another, and investigating domain adaptation techniques to facilitate cross-farm deployment. Third, standardized protocols for camera installation and data collection will be developed, balancing detection performance with deployment flexibility and providing practical guidance for real-world applications. These efforts will comprehensively validate and enhance DC-YOLO's robustness and adaptability across diverse intensive farming environments.
3.2 Tracking extensions and future directions
The technical components of DC-YOLO, designed to address occlusion, illumination variation, and class imbalance, are based on general computer vision principles and are theoretically applicable to other intensive livestock farming scenarios, such as pig and cattle behavior detection. Cross-species application would primarily require retraining on datasets specific to the target species' behavioral patterns and morphological characteristics. Additionally, as a downstream task, multi-object tracking will hold significant importance for the refined supervision of animals in farms. This serves as an exploration and discussion of subsequent tasks.
To evaluate model generalization and investigate tracking performance, a 60-second daily video clip of Hu sheep from the same farm was additionally selected. The clip, which was captured by another camera at 25 frames per second (totaling 1 500 frames), was entirely independent of the dataset used for model construction. The trained DC-YOLO model was applied to this test video to assess its generalization ability and processing speed on video streams. Then, ByteTrack[39] and BoT-SORT [40] were employed to match the inter-frame detection results of DC-YOLO for tracking Hu sheep objects. Fig. 16 illustrates the performance of Hu sheep behavior detection and tracking. The visualizations of ByteTrack and BoT-SORT on video stream frame sequences are shown separately. However, a limitation was identified in tracking performance: when an object reappears after being lost due to severe occlusion, neither algorithm successfully performs re-identification, instead incorrectly assigning it a new ID.
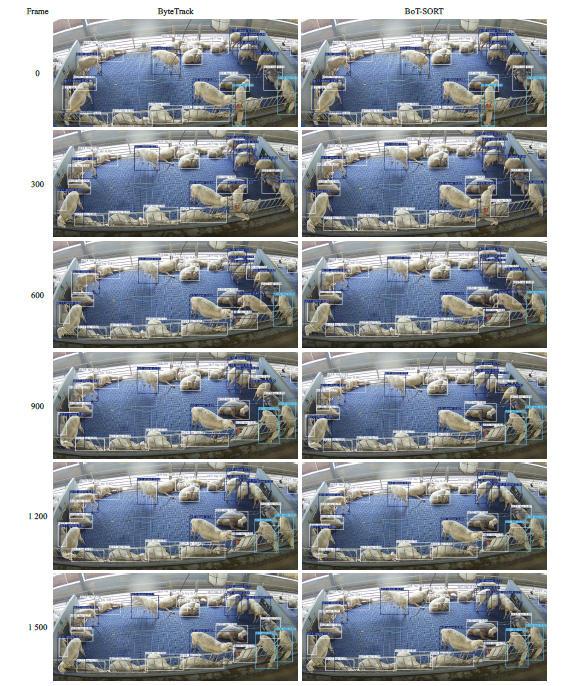
Fig. 16 Visualization of behavior detection and tracking results for Hu sheep |
It should be acknowledged that the current study primarily focuses on robust frame-level detection under challenging conditions such as occlusion, illumination variation, and class imbalance. The systematic evaluation of video-level performance metrics, including temporal stability, inter-frame ID consistency, and trajectory continuity under extreme occlusion, was not conducted in this work. Such comprehensive validation requires specialized mechanisms for ID recovery and re-identification in dense scenarios, which extend beyond the scope of frame-based detection. Therefore, achieving stable tracking with consistent ID assignment for each individual in high-density scenes, particularly addressing the re-identification challenge when objects reappear after occlusion, will be a key focus of future research.
DC-YOLO demonstrates excellent performance in behavior recognition of Hu sheep, achieving satisfactory results even on an independent held-out video from the same farm, indicating that the model has not overfitted the training samples, although its robustness to cross-farm distribution shifts remains to be verified.
4 Conclusion
The application of computer vision for the precise identification of typical behaviors in intensively farmed Hu sheep is significant for studying behavioral changes and improving management practices in intensive livestock husbandry. DC-YOLO, a behavior detection method is introduced for Hu sheep that builds upon and integrates key features from YOLOv11 and YOLOv12.
Designed to enhance the utilization of dataset information, particularly for minority classes, the model effectively leverages image details and contextual information to improve detection performance for occluded objects. A dataset of typical behaviors for Hu sheep in intensive farming was constructed, with five key behaviors (drinking, lying, eating, licking, and standing) annotated under various occlusion and lighting conditions.
Training and validation on this dataset demonstrated that DC-YOLO achieved 91.0% P, 86.6% R, and 91.4% mAP. Compared to YOLOv12, DC-YOLO showed improvements of 9.4 percentage points in P, 8.1 percentage points in R, and 7.8 percentage points in mAP, while simultaneously reducing the parameter size by 8.7%. Moreover, DC-YOLO had 2.29 M parameters, an 8.74% reduction compared to YOLOv12. On CPU, the inference time of DC-YOLO was reduced to 115.5 ms and the frame rate increased to 8.50 f/s, corresponding to improvements of 33.2% and 48.9%, respectively.
In post-processing, the integrated BS-NMS algorithm reduces bounding box overlap, which is crucial when detecting partially occluded objects. DC-YOLO demonstrates robust performance across various lighting conditions, including low-light environments. A key strength of DC-YOLO is its ability to identify information-deficient object boxes, providing a solid detection foundation for subsequent tracking tasks. This approach enables researchers to discern individual behaviors within group patterns, thereby advancing animal behavior studies in intensive farming and helping to optimize husbandry practices.