0 引 言
1 材料与方法
1.1 数据集的构建
表 1 苹果叶病害数据集Table 1 Apple Leaf disease datasets |
| 苹果叶病害类别 | 训练集样本数量/张 | 验证集样本数量/张 | 测试集样本数量/张 | 样本总 数量/张 |
|---|---|---|---|---|
| 褐腐病 | 256 | 36 | 77 | 369 |
| 褐纹病 | 372 | 54 | 106 | 532 |
| 黑星病 | 277 | 40 | 79 | 396 |
| 锈病 | 288 | 42 | 82 | 412 |
表 2 四种苹果叶病害的具体特征Table 2 Specific features of four types of apple leaf diseases |
| 病害类别 | 特征 | 病害表现 |
|---|---|---|
| 褐腐病 | 叶片上形成病斑,通常呈现为不规则褐色或黑色斑点,随着时间推移病斑逐渐扩大,会融合成较大病斑 | 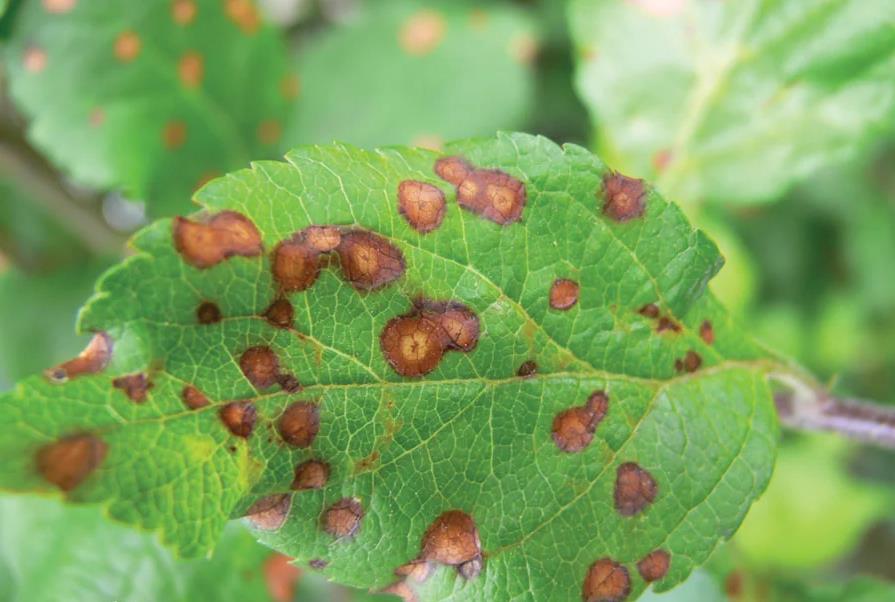 |
| 褐纹病 | 叶片上形成病斑,通常开始作为小的、淡褐色的斑点,随着病害的发展逐渐扩大,颜色逐渐变为深褐色或黑褐色,伴有灰色的霉层 | 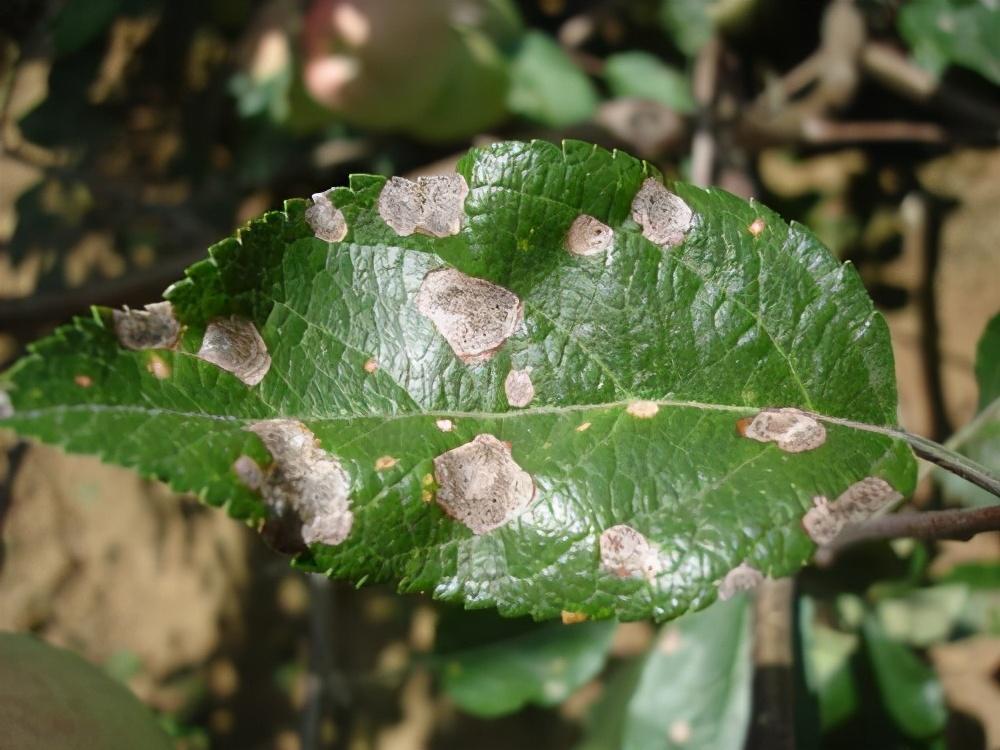 |
| 黑星病 | 病斑呈现为小而圆形的黑褐色斑点,病斑的颜色逐渐变为黑色或暗褐色,边缘通常呈锐利的环状或不规则状 |  |
| 锈病 | 叶片上形成病斑,呈现为黄色或橙色的小斑点,呈圆形或半圆形,并且在叶片上形成突起 | 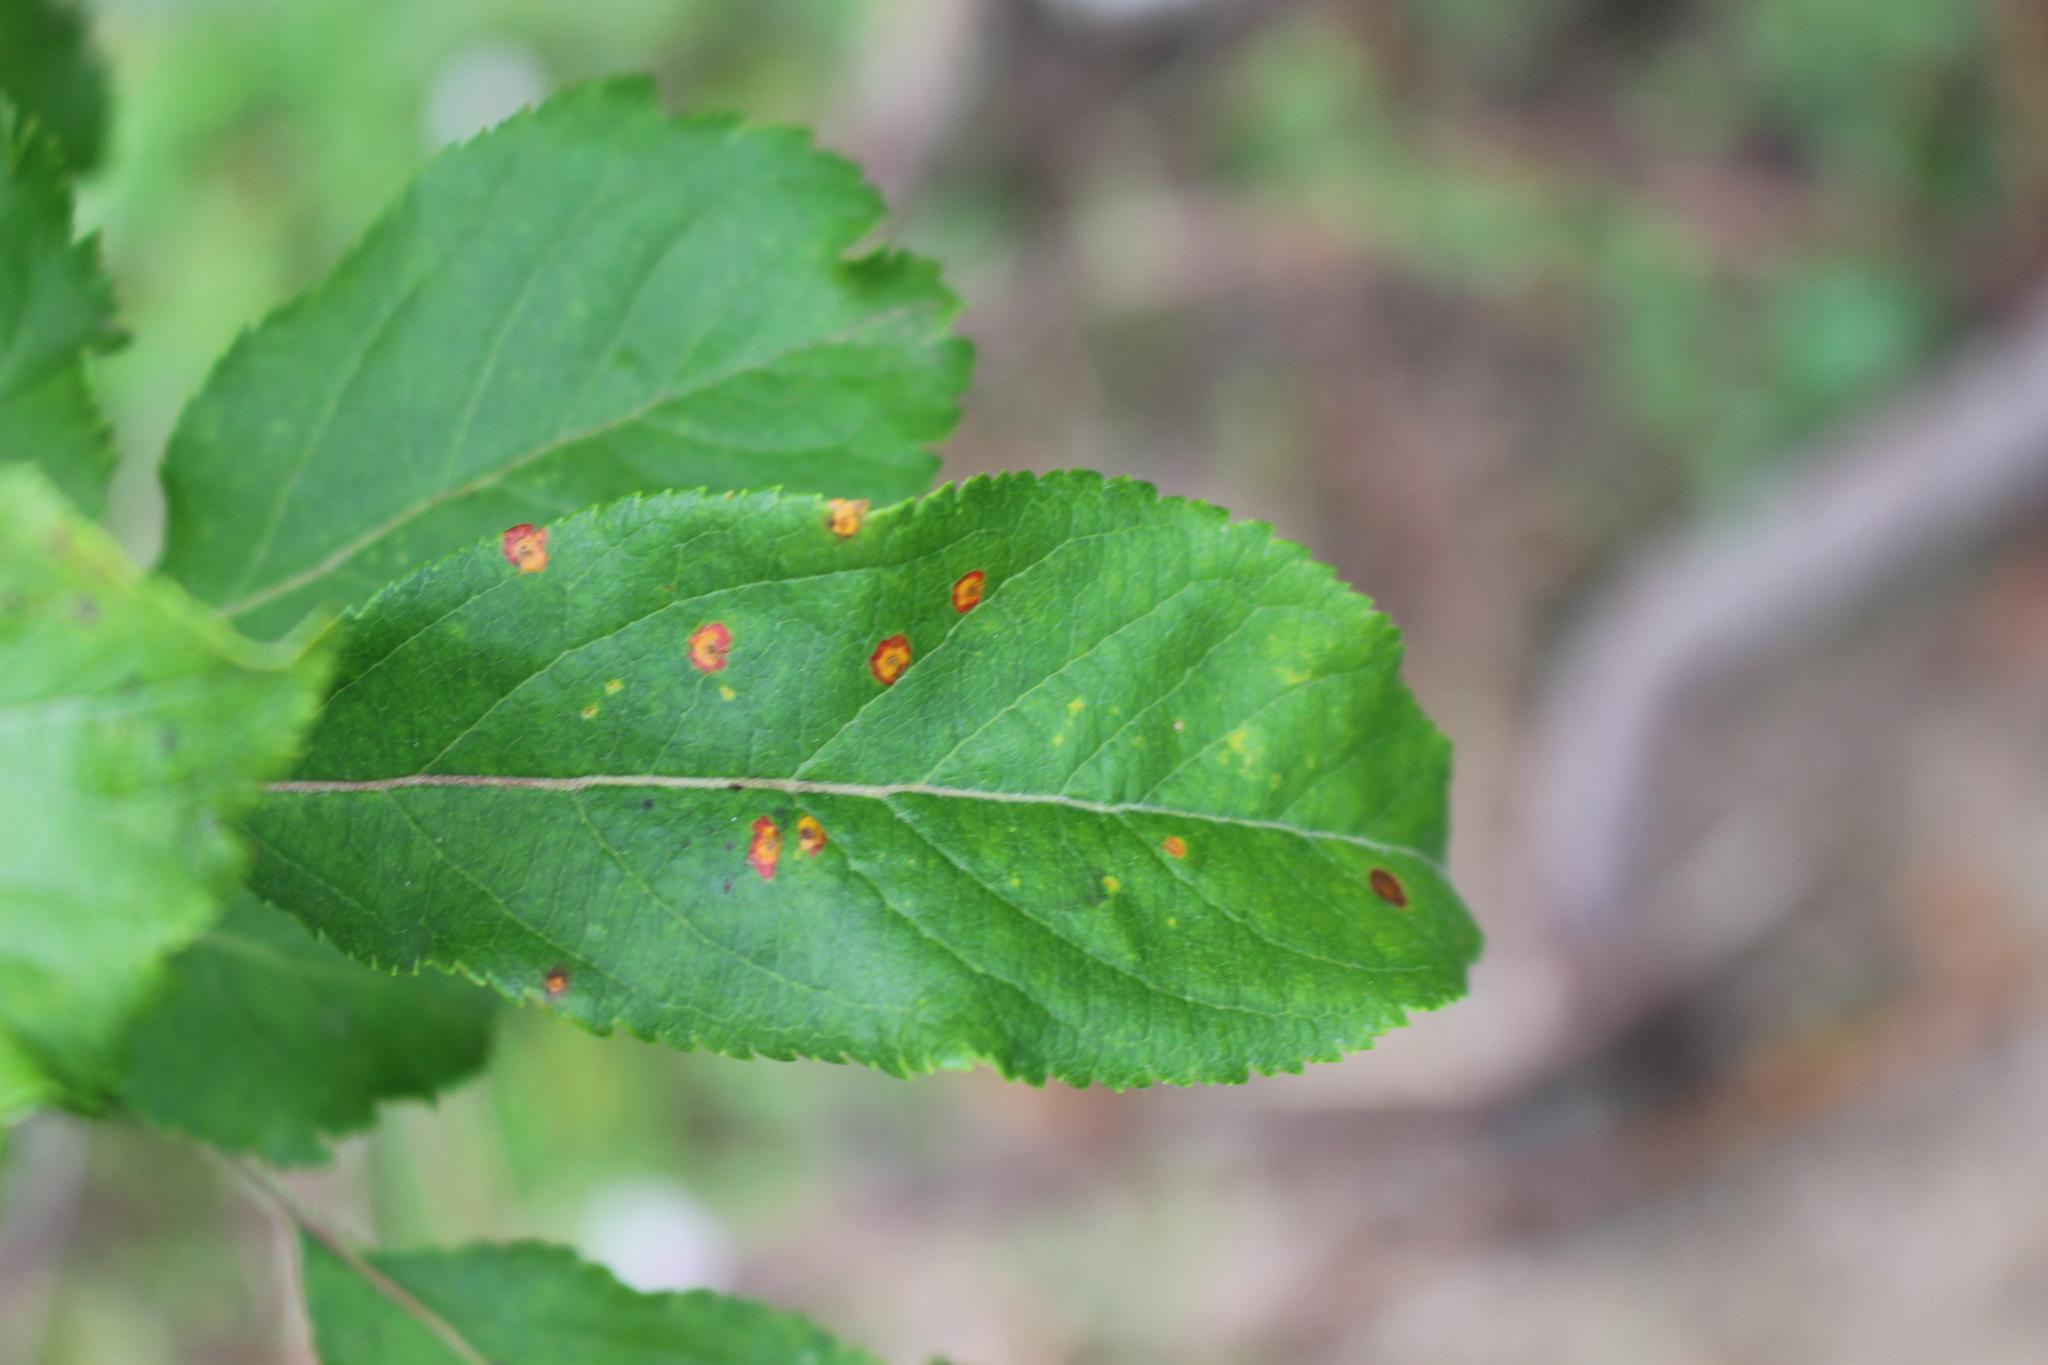 |
1.2 检测模型构建
1.2.1 MSDA模块
1.2.2 SPD-Conv模块
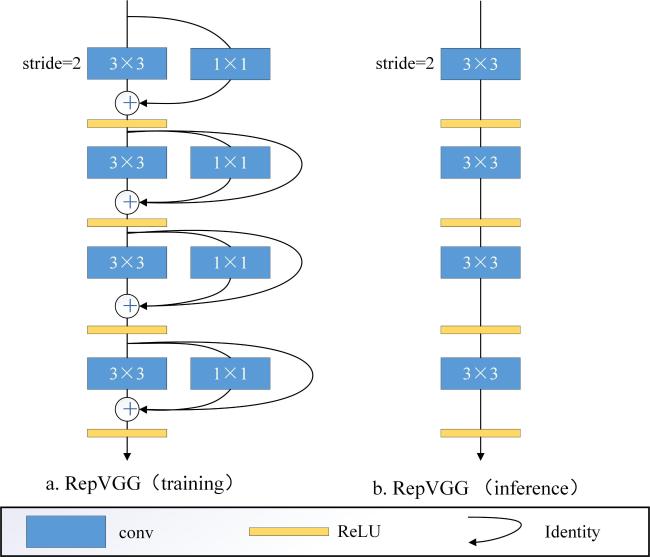
1.2.3 检测头创新
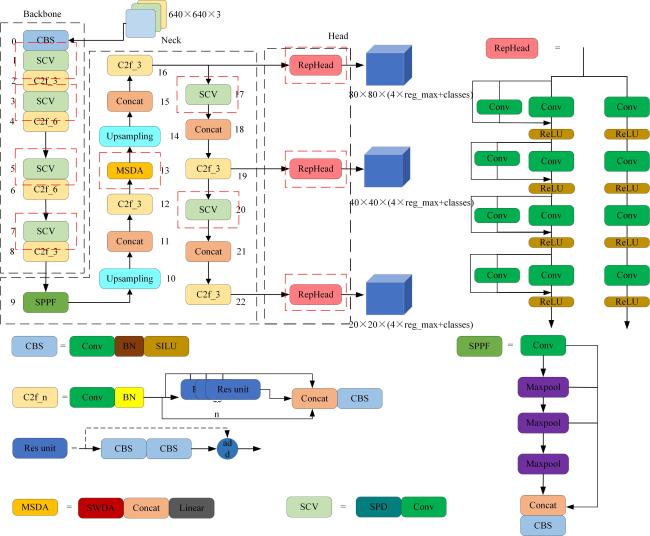
1.2.4 苹果叶病害识别算法模型
1.3 模型训练与测试
1.3.1 试验平台
1.3.2 模型训练
1.3.3 评价指标
2 结果与分析
2.1 验证MSDA在不同位置的效果
表 3 苹果叶病害研究中 MSDA 注意力机制在不同位置添加的效果对比Table 3 Effects of adding MSDA attention mechanism at different positions in apple leaf disease research |
| 试验 | 添加位置 | mAP50/% | mAP50:95/% | 浮点运算次数 FLOPs / G | 模型大小/MB |
|---|---|---|---|---|---|
| 0 | 无添加 | 86.7 | 36.6 | 7.7 | 7.6 |
| 1 | 一号位置 | 88.0 | 37.0 | 8.1 | 8.2 |
| 2 | 二号位置 | 88.2 | 37.0 | 8.0 | 7.8 |
| 3 | 三号位置 | 87.1 | 36.8 | 8.0 | 7.7 |
| 4 | 四号位置 | 86.6 | 36.4 | 8.0 | 7.8 |
|
2.2 消融实验
表 4 苹果叶病害目标检测消融实验Table 4 Ablation experiments on apple leaf disease object detection |
| 试验 | SPD-Conv | MSDA | RepHead | 准确率/% | 召回率/% | mAP50/% | mAP50:95/% | 浮点运算次数FLOPs/ G | 模型大小/MB |
|---|---|---|---|---|---|---|---|---|---|
| 1 | √ | 82.9 | 78.5 | 85.9 | 36.3 | 7.4 | 5.6 | ||
| 2 | √ | 83.6 | 81.7 | 87.3 | 36.6 | 8.4 | 8.3 | ||
| 3 | √ | 84.2 | 78.7 | 86.5 | 35.9 | 8.4 | 8.2 | ||
| 4 | √ | √ | 82.9 | 83.0 | 87.7 | 37.7 | 7.9 | 5.9 | |
| 5 | √ | √ | 81.9 | 80.4 | 86.7 | 36.6 | 7.7 | 7.6 | |
| 6 | √ | √ | 84.0 | 80.1 | 87.5 | 37.0 | 8.8 | 8.6 | |
| 7 | √ | √ | √ | 83.1 | 80.2 | 88.2 | 37.0 | 8.0 | 7.8 |
|
2.3 YOLOv8n-SMR与其他模型的性能对比试验
表 5 不同网络模型的苹果叶病害检测实验结果Table 5 Experimental results of apple leaf disease detection using different network models |
| 模型 | 准确率/% | 召回率/% | mAP50/% | mAP50:95/% | 浮点运算次数FLOPs/G | 模型大小/MB | 参数量/M |
|---|---|---|---|---|---|---|---|
| YOLOv8n-SMR | 83.1 | 80.2 | 88.2 | 37.0 | 8.0 | 7.8 | 3.7 |
| YOLOv9-c | 83.8 | 81.0 | 86.9 | 36.8 | 102.3 | 51.6 | 25.5 |
| YOLOv7-tiny | 82.8 | 81.8 | 86.8 | 34.2 | 13.2 | 12.3 | 6.0 |
| RetinaNet | 78.3 | 78.2 | 80.4 | 33.0 | 191.4 | 139.0 | 36.3 |
| Faster-RCNN | 73.5 | 74.3 | 76.6 | 31.4 | 370.2 | 108.0 | 136.7 |
|
2.4 YOLOv8n模型改进前后的性能对比试验
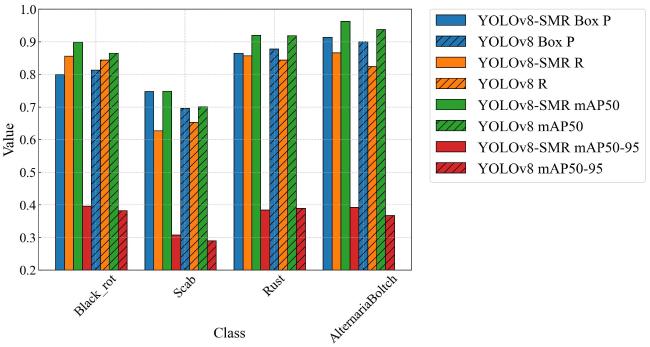
2.4.1 综合评比
表 6 苹果叶病害研究中YOLOv8n模型改进前后的结果对比Table 6 Comparison of YOLOv8n model results before and after improvements for apple leaf disease |
| 模型 | 准确率/% | 召回率/% | mAP50/% | mAP50:95/% | 浮点运算次数FLOPs/ G | 模型大小/MB | 参数量/M |
|---|---|---|---|---|---|---|---|
| YOLOv8n | 82.2 | 79.1 | 85.5 | 35.7 | 8.1 | 6.3 | 3.0 |
| YOLOv8n-SMR | 83.1 | 80.2 | 88.2 | 37.0 | 8.0 | 7.8 | 3.7 |
|
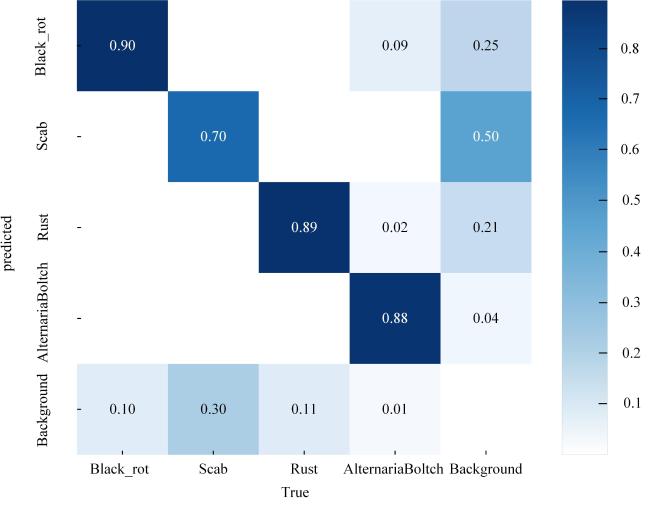
2.4.2 混淆矩阵
2.4.3 泛化测试
表 7 不同模型在测试集上病害检测总体结果对比Table 7 Comparison of different models' results on the apple leaf disease test set |
| 模型 | 准确率/% | 召回率/% | mAP50/% | mAP50:95/% |
|---|---|---|---|---|
| YOLOv8n | 83.9 | 81.7 | 84.6 | 38.2 |
| YOLOv8n-SMR | 84.1 | 82.0 | 86.3 | 39.4 |
| YOLOv9-c | 86.5 | 80.6 | 85.0 | 38.1 |
| YOLOv7-tiny | 84.2 | 80.5 | 85.7 | 36.5 |
|
2.4.4 数据类别不平衡试验
表8 苹果叶病害检测中数据类别平衡前后模型训练结果 (%)Table 8 Model training results before and after data class balancing in apple leaf disease detection |
| 类别 | 准确率 (平衡前) | 准确率 (平衡后) | 召回率 (平衡前) | 召回率 (平衡后) | mAP50 (平衡前) | mAP50 (平衡后) | mAP50:95 (平衡前) | mAP50:95 (平衡后) |
|---|---|---|---|---|---|---|---|---|
| 总体 | 83.1 | 85.8 | 80.2 | 83.6 | 88.2 | 88.9 | 37.0 | 39.4 |
| 褐纹病 | 91.3 | 90.2 | 86.6 | 95.7 | 96.2 | 97.1 | 39.2 | 50.3 |
| 褐腐病 | 79.9 | 92.2 | 85.6 | 82.5 | 89.9 | 93.4 | 39.6 | 39.2 |
| 黑星病 | 74.7 | 77.3 | 62.7 | 69.9 | 74.8 | 76.6 | 30.8 | 32.0 |
| 锈病 | 86.5 | 83.5 | 85.7 | 86.2 | 91.9 | 88.7 | 38.4 | 36.3 |
|


