欢迎您访问《智慧农业(中英文)》官方网站! English
信息处理与决策

基于改进HRNet的高精度鱼类姿态估计方法

  • 彭秋珺 1, 2, 3, 4, 5 ,
  • 李蔚然 1, 2, 3, 4, 5 ,
  • 刘业强 1, 2, 3, 4, 5 ,
  • 李振波 , 1, 2, 3, 4, 5
展开
  • 1. 中国农业大学国家数字渔业创新中心,北京 100083,中国
  • 2. 中国农业大学 信息与电气工程学院,北京 100083,中国
  • 3. 农业农村部智慧养殖技术重点实验室,北京 100083,中国
  • 4. 农业农村部信息化标准化重点实验室,北京 100083,中国
  • 5. 北京市农业物联网工程技术研究中心,北京 100083,中国
李振波,博士,教授,研究方向为计算机视觉。E-mail:

彭秋珺,硕士研究生,研究方向为计算机视觉。E-mail:

收稿日期: 2025-01-25

  网络出版日期: 2025-05-22

基金资助

国家重点研发计划项目(2020YFD0900204)

新一代人工智能国家科技重大专项(2021ZD0113805)

北京市智慧农业创新团队项目(BAIC10-2024)

High-Precision Fish Pose Estimation Method Based on Improved HRNet

  • PENG Qiujun 1, 2, 3, 4, 5 ,
  • LI Weiran 1, 2, 3, 4, 5 ,
  • LIU Yeqiang 1, 2, 3, 4, 5 ,
  • LI Zhenbo , 1, 2, 3, 4, 5
Expand
  • 1. National Innovation Center for Digital Fishery, China Agricultural University, Beijing 100083, China
  • 2. College of Information and Electrical Engineering, China Agricultural University, Beijing 100083, China
  • 3. Key Laboratory of Smart Farming for Aquatic Animal and Livestock, Ministry of Agriculture and Rural Affairs, Beijing 100083, China
  • 4. Key Laboratory of Agricultural Informatization Standardization, Ministry of Agriculture and Rural Affairs, Beijing, 100083, China
  • 5. Beijing Engineering and Technology Research Center for Internet of Things in Agriculture, Beijing 100083, China
LI Zhenbo, E-mail:

PENG Qiujun, E-mail:

Received date: 2025-01-25

  Online published: 2025-05-22

Supported by

National Key Research and Development Program of China(2020YFD0900204)

National Science and Technology Major Project(2021ZD0113805)

Beijing Smart Agriculture Innovation Consortium Project(BAIC10-2024)

Copyright

copyright©2025 by the authors

摘要

【目的/意义】 鱼类姿态估计是获取鱼类生理信息的重要手段,对于水产养殖中的健康监测具有重要意义。鱼类在受到损伤时通常表现出异常行为,并伴随身体部位位置的变化。此外,鱼类游动过程中的姿态和方向具有不确定性,且游速较快,这对鱼类姿态估计研究提出了挑战。因此,本研究提出了一种名为HPFPE(High-Precision Fish Pose Estimation)的鱼类姿态估计模型,旨在精准捕捉鱼类姿态并准确识别其关键点。 【方法】 该模型一方面将注意力机制模块(Convolutional Block Attention Module, CBAM)集成到HRNet(High-Resolution Net)框架中,在不增加计算复杂度的前提下提高模型预测精度。另一方面,模型通过融合空洞卷积来扩大感受野,提取更广泛的空间上下文信息,从而进一步提升姿态估计的准确性。 【结果和讨论】 在斑石鲷数据上,与HRNet方法相比,HPFPE在不同骨干网络和输入尺寸下的平均准确率分别提高了0.62、1.35、1.76和1.28个百分点,平均召回率分别提升了0.85、1.50、1.40和1.00个百分点。此外,HPFPE在性能上也优于DeepPose、CPM(Convolutional Pose Machine)、SCNet(Self-Calibrated Convolutions Net)和Lite-HRNet。在观赏鱼数据上,HPFPE的平均精度和平均召回率分别达到52.96%和59.50%,显著优于其他对比方法。 【结论】 本研究提出的HPFPE模型能够有效估计鱼类姿态,为鱼类行为识别等应用提供重要参考。

本文引用格式

彭秋珺 , 李蔚然 , 刘业强 , 李振波 . 基于改进HRNet的高精度鱼类姿态估计方法[J]. 智慧农业, 2025 , 7(3) : 160 -172 . DOI: 10.12133/j.smartag.SA202502001

Abstract

[Objective] Fish pose estimation (FPE) provides fish physiological information, facilitating health monitoring in aquaculture. It aids decision-making in areas such as fish behavior recognition. When fish are injured or deficient, they often display abnormal behaviors and noticeable changes in the positioning of their body parts. Moreover, the unpredictable posture and orientation of fish during swimming, combined with the rapid swimming speed of fish, restrict the current scope of research in FPE. In this research, a FPE model named HPFPE is presented to capture the swimming posture of fish and accurately detect their key points. [Methods] On the one hand, this model incorporated the CBAM module into the HRNet framework. The attention module enhanced accuracy without adding computational complexity, while effectively capturing a broader range of contextual information. On the other hand, the model incorporated dilated convolution to increase the receptive field, allowing it to capture more spatial context. [Results and Discussions] Experiments showed that compared with the baseline method, the average precision (AP) of HPFPE based on different backbones and input sizes on the oplegnathus punctatus datasets had increased by 0.62, 1.35, 1.76, and 1.28 percent point, respectively, while the average recall (AR) had also increased by 0.85, 1.50, 1.40, and 1.00, respectively. Additionally, HPFPE outperformed other mainstream methods, including DeepPose, CPM, SCNet, and Lite-HRNet. Furthermore, when compared to other methods using the ornamental fish data, HPFPE achieved the highest AP and AR values of 52.96%, and 59.50%, respectively. [Conclusions] The proposed HPFPE can accurately estimate fish posture and assess their swimming patterns, serving as a valuable reference for applications such as fish behavior recognition.

0 Introduction

Fish are highly susceptible to physiological, psychological, and environmental changes during their growth, often exhibiting abnormal behaviors such as swimming near tank walls or floating at the surface[1]. Pose estimation refers to the process of determining an object's position and orientation in space by analyzing images or sensor data using computer vision techniques. By leveraging pose estimation algorithms, the movements of different parts of a fish can be tracked, capturing posture variation and enabling effective monitoring of their behavior and health status. Moreover, observing and analyzing fish posture contributes to the conservation of aquatic ecosystems and helps maintain a healthy ecological environment. This approach promotes an ecologically sustainable aquaculture model, improving fish quality and supporting the sustainable development. Therefore, Fish Pose Estimation (FPE) method is crucial for strengthening disease prevention and health management, which can significantly increase fish survival rates and ornamental value.
Currently, human pose estimation technology has reached a relatively mature stage and has achieved high performance in single-person pose estimation tasks[2]. With advancements in human pose estimation technology[3-5], these methods have been widely adopted by researchers for human behavior recognition and monitoring, establishing a foundation for further studies in behavior recognition[6-8]. Compared to humans, fish exhibit greater motion variability, presenting substantial challenges for fish posture analysis. Building on advancements in human pose estimation, research on FPE has also achieved notable progress. However, traditional methods often rely on manually extracted features and prior knowledge to identify and locate key points on the fish. These approaches are prone to human error, necessitate considerable manual design and debugging efforts, and often fail to meet real-time requirements in practical applications. With the advancement of deep learning technology[9], fish farming has significantly progressed in detection[10], segmentation[11], tracking[12], counting[13], species identification[14] and behavior recognition[15-17]. Moreover, the application of pose estimation methods enables the monitoring of fish behavior and health status. DeepLabCut is a pose estimation algorithm that utilizes transfer learning from deep neural networks. This method has been shown to be effective in tracking various behaviors across different species, including fish[18]. For instance, Wu et al.[19] developed a visual perception system for FPE that analyzes swimming behavior, quantifies fish motion through pose estimation, dynamically visualizes key point motion data, and accurately extracts swimming features. This system also examines the coordinated movement of the fish's body and fins under various swimming conditions. Wang et al.[20] proposed a fish identification method that utilizes a lightweight convolutional neural network model to detect fish body poses. Using Micropterus salmoides as the study object, they updated the target detection frame to a rotating format. Based on the pose estimation, feature vectors were constructed and further processed using the random forest algorithm for feature reduction and fish identity recognition. Additionally, Cui et al.[21] proposed a fish sign recognition method based on a deep learning key feature point detection model combined with binocular vision. A high-resolution network incorporating pyramid segmentation attention was trained on a preprocessed monocular vision dataset to detect key feature points, which were subsequently matched and analyzed to derive real coordinates and corresponding biomechanical parameters using the internal parameters of the binocular vision system. Despite the initial successes of pose estimation in fish farming, the number of applications remains limited compared to those for other animals. Furthermore, as the demand for monitoring fish posture and behavior in aquaculture continues to increase, there is a pressing need to innovate pose estimation methods to establish a solid foundation for future advancements in fish farming.
To enhance the accuracy of FPE and to better monitor the health status of fish, a novel fish pose estimation model is proposed and its effectiveness is validated. In this research, HPFPE employs repeated multi-scale fusion to achieve high-resolution outputs, preserving detailed spatial information and addressing the high-accuracy requirements of fish pose estimation tasks. The integration of the CBAM module enables the model to capture feature correlations through a combination of channel and spatial attention, enhancing feature extraction capabilities without increasing computational complexity and contributing to improve detection accuracy. Moreover, the use of dilated convolution allows the fixed-size convolution kernel to expand the receptive field, effectively capturing a broader range of contextual information while maintaining computational efficiency. Additionally, a fish pose estimation dataset was established, which provided a solid foundation for FPE challenges.

1 Materials and methods

Initially, data collection, annotation, and augmentation were conducted. Subsequently, both the original data and the noise-enhanced datasets were used as inputs for the experiments. Then, the structure of the fish pose estimation model was developed based on HRNet, with the final output comprising the generated heatmaps and the location maps of the key points for each fish.

1.1 Dataset

1.1.1 Data collection

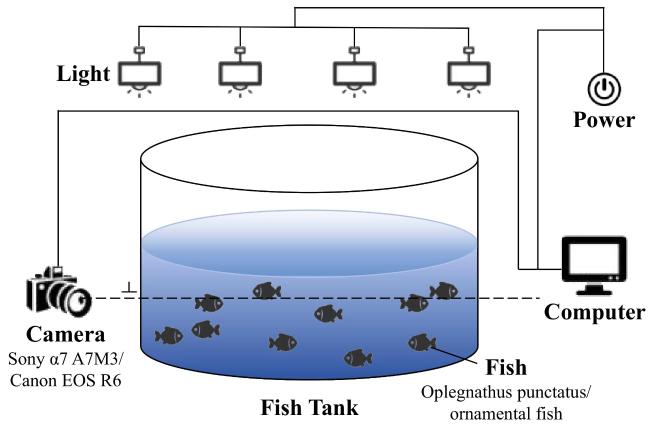
This dataset was divided into two categories: Oplegnathus punctatus data and ornamental fish data. The experimental data were collected from the Fishery Culture Laboratory at Ludong University and the National Innovation Center for Digital Fishery at China Agricultural University. The data acquisition setup is shown in Fig. 1. The data were collected in November of 2023 under daytime indoor lighting conditions. Ultimately, 500 images of oplegnathus punctatus were randomly selected, each containing 2 fish with a resolution of 1 920×1 080 pixels, and 300 images of ornamental fish, each containing 10 fish with a resolution of 3 840×2 160 pixels. Oplegnathus punctatus data have been publicly available at https://github.com/junjun0917/HPFPE.
Fig. 1 Data acquisition devices of FPE study

1.1.2 Data annotation

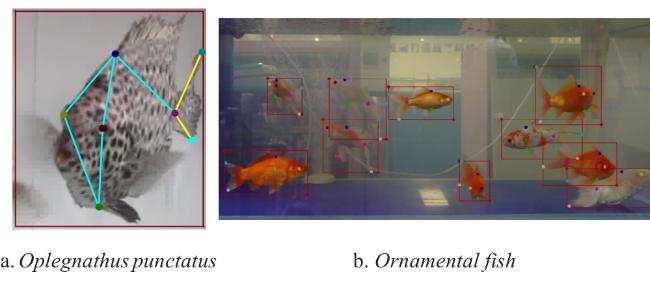
Labelme 5.3.1 was employed to annotate the bounding box of each fish in the images, identifying a total of seven key anatomical points. A detailed description of the key point annotations for the fish body is provided in Table 1, while examples of the annotations from the experimental dataset are shown in Fig. 2.
Table 1 The detailed description of the key point annotation of fish body
Number Name Location
1 belly Anterior end of the pelvic fin
2 eye_left Left eye
3 eye_right Right eye
4 back Anterior end of dorsal fin
5 tail_top Anterior end of tail
6 tail_up Top of tail
7 tail_low Bottom of tail
Fig. 2 The annotation sample of experimental dataset of fish body

1.1.3 Data augmentation

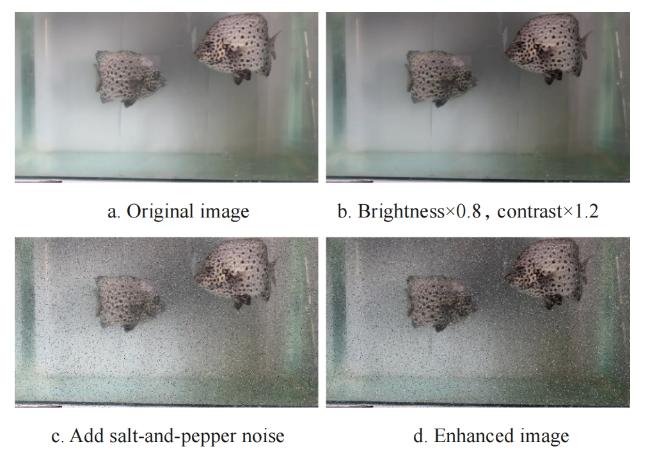
The dataset was split into training and testing sets using stratified sampling in an 8:2 ratio, resulting in 640 training images and 160 test images. To enhance the model's generalization capability, data augmentation techniques were applied to the training set images of Oplegnathus punctatus. Specifically, the image brightness was adjusted to 0.8 times, the contrast was increased to 1.2 times, and salt-and-pepper noise was added. These augmentations expanded the training set from 400 to 800 images, while the testing set remained unchanged. Sample images resulting from the data augmentation process are presented in Fig. 3. Consequently, the final dataset comprised 1 200 images, with 1 040 allocated for training and 160 for testing. The distribution of the dataset is presented in Table 2.
Fig. 3 Sample images of oplegnathus punctatus during data augmentation
Table 2 The amount and distribution of the proposed dataset
Dataset Training set images Test set images Image total Fish total
Oplegnathus punctatus images before augmentation 400 100 500 800
Oplegnathus punctatus images after augmentation 800 100 900 1 800
Ornamental fish images 240 60 300 3 000
Final dataset total 1 040 160 1 200 4 800

1.2 HPFPE

1.2.1 Framework

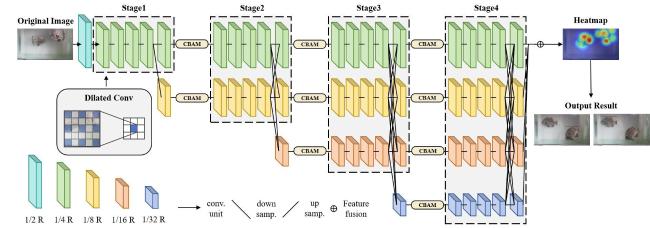
HRNet consistently maintains high-resolution representations while enhancing contextual and semantic understanding through a combination of downsampling and upsampling layers. This architecture has demonstrated state-of-the-art performance in pose estimation tasks. Moreover, leveraging the accuracy advantages of HRNet, the integration of attention mechanisms can further enhance model precision, while the incorporation of dilated convolutions[22] facilitates an expanded receptive field. In this study, HRNet was utilized as the backbone network, integrating dilated convolutions and attention mechanisms to investigate FPE. The overall architecture is illustrated in Fig. 4.
Fig. 4 The structure of HPFPE
The multiple feature fusions at different resolutions in the original HRNet model may introduce noise and result in information redundancy. To address these issues and enhance contextual information, the convolutional block attention module (CBAM)[23] was integrated at the end of each stage. This approach significantly enhances the model's ability to capture key points information in fish, thereby improving overall pose estimation accuracy. Additionally, it enhanced the model's adaptability and robustness.
HPFPE consisted of a total of 4 stages. Starting from Stage 2, parallel branches were sequentially introduced in each stage, where the output of the n-th branch served as the input for the (n+1)-th branch. The model performed dense upsampling and downsampling operations to enable cross-fusion of features between the output of each stage branch and the input of the subsequent stage. Additionally, the number of channels in the newly introduced branch at each stage was doubled, while the resolution was halved compared to the lowest resolution branch in the preceding stage. Consequently, the resolutions of the feature maps from Stage 1 to Stage 4 were 1/4, 1/8, 1/16, and 1/32 of the original data, respectively. The specific configuration of the multi-scale feature maps generated by each stage is detailed in Table 3.
Table 3 Configuration of multi-scale feature maps produced by each stage of HPFPE study
Layer Multi-scale feature map Number of branches Number of blocks in each branch Number of exchange units
Stage 1 1/4 1 4 0
Stage 2 1/4, 1/8 2 4, 4 1
Stage 3 1/4, 1/8, 1/16 3 4, 4, 4 4
Stage 4 1/4, 1/8, 1/16, 1/32 4 4, 4, 4, 4 3

1.2.2 CBAM module

FPE formed the foundation for behavior recognition, meaning that the accuracy of pose estimation directly impacted the precision of behavior recognition outcomes. Currently, research on fish pose estimation methods and their accuracy is limited, with existing methods still exhibiting relatively low precision. Accurate pose estimation relied on precise key point detection, accurate localization, and the correct establishment of logical associations between key points. The introduction of the attention mechanisms aided in capturing fine-grained features of the fish body, enhanced feature extraction, and improved model accuracy. In the context of attention mechanisms, CBAM was distinguished by its combination of channel attention and spatial attention, which enabled it to capture feature correlations across multiple dimensions and enhance recognition performance. Additionally, compared to attention mechanisms such as self-attention and Squeeze-and-Excitation Networks (SENet), CBAM was a lightweight general-purpose module that introduces minimal additional computational cost and does not significantly increase model complexity. Therefore, CBAM modules were embedded after each stage of the model, resulting in a total of 9 sequential CBAM modules. This enabled feature recalibration across both channel and spatial dimensions, thereby enhancing overall detection accuracy.

1.2.3 Dilated convolution

Dilated convolution[22] incorporated a dilation rate parameter, enabling a convolution kernel of fixed size to achieve an expanded receptive field. This method allowed dilated convolution to retain fewer parameters than standard convolutions while still achieving the same receptive field size, thereby minimizing computational overhead. Consequently, dilated convolution was incorporated into HRNet to build this model. By introducing strategically spaced between standard convolution kernels, the model's ability to capture global information was effectively enhanced without increasing the number of parameters or the computational complexity.

1.2.4 Evaluation metrics

In HPFPE, Average Precision(AP) and Average Recall(AR) are employed as key evaluation metrics. AP is a standard metric in pose estimation research quantifies the average precision of the proposed fish pose estimation model. A higher AP score signifies improved performance of the model. Before calculating the AP, it is crucial to assess the similarity between the predicted key points and the ground-truth values using the Object Keypoint Similarity (OKS) metric. The specific calculation formula for OKS is provided in Equation (1).
O K S = i e x p ( - d i 2 2 s 2 k i 2 ) δ ( v i > 0 ) i δ ( v i > 0 )
Where, i represents the subscript of a key point; k is a constant for each key point that controls attenuation; di is the Euclidean distance between the predicted value of the key point and the manually labeled value; s is the scale factor, and its value is the square root of the detection box area; δ means that if the condition is met, it is 1, otherwise it is 0; vi represents the visibility of the ith key point, and its value is 0, 1, or 2, representing unlabeled, invisible and labeled, and visible and labeled, respectively; ki represents the normalization factor of the ith key point. This factor is the standard deviation between the manual annotation and the true positions of the key point in all the sample sets. The larger the k values, the more difficult to label this type of key point.
After calculating the OKS value, a threshold is established. If the Intersection over Union (IoU) of a prediction exceeds this threshold, the prediction is classified as a true positive. Conversely, if the threshold is not met, it is classified as a false positive. The method for calculating AP is detailed in Equation (2).
A P = p δ ( O K S p > T ) p 1
Where, T represents the set threshold, while p denotes the index of the detection box. In the experiments, AP50 corresponds to the IoU threshold of 0.5, and AP75 corresponds to the IoU threshold of 0.75.
AR is a crucial metric to measure the quality of an algorithm in pose estimation. In the experiment, AR50 represents an IoU threshold of 0.5, and AR75 represents an IoU threshold of 0.75

2 Experiment and results

2.1 Experimental configuration

The experimental configuration for HPFPE is presented in Table 4. HRNet-32 and HRNet-48 were created by varying the width of the high-resolution subnet from Stage 2 to Stage 4 within the HRNet architecture. The specific widths for each stage from Stage 2 to Stage 4 are outlined in Table 5. In the training data loader, the batch size was configured to 64 for HRNet-32 and 32 for HRNet-48. The validation data loader was configured with a batch size of 32. The Adam optimizer was utilized with an initial learning rate set at 5e-4. The model achieved convergence after 210 epochs. Additionally, all input data were automatically resized to either 256×192 or 384×288 pixels, leveraging domain knowledge.
Table 4 Experimental configuration of HPFPE study
Configuration Parameter
CPU Intel(R) Xeon(R) Silver 4210R CPU
GPU NVIDIA Tesla V100
Operating system Ubuntu 18.04.6 LTS
Deep learning framework PyTorch 1.8.1
Programming language Python 3.8
Table 5 Width of the Stage 2-Stage 4 in HRNet-32 and HRNet-48
Number of stage HRNet-32 HRNet-48
Stage 2 64 96
Stage 3 128 192
Stage 4 256 384

2.2 Comparison of the pose estimation results with the original HRNet

The CBAM was placed at the end of each stage in the HRNet architecture. Furthermore, to enhance the receptive field, dilated convolutions were integrated into the model. This model was compared with the original HRNet using oplegnathus punctatus data, and the results of the pose estimation experiments are presented in Table 6,which demonstrates that incorporating CBAM and dilated convolutions enhances both the AP and AR scores, even when using the same backbone architecture and input size. Specifically, when employing HRNet-W48 as the backbone with an input size of 384×288, the HPFPE achieves an AP of 74.12%. Furthermore, compared with the HRNet, HPFPE shows improvements in AP by 0.62, 1.35, 1.76, and 1.28 percent point, and in AR by 0.85, 1.50, 1.40, and 1.00 percent point, respectively, across different backbone networks and input sizes. At the same time, HPFPE achieves higher values of AP50, AP75, AR50, and AR75. These findings indicate that the proposed fish pose estimation model surpasses the performance of the original HRNet when applied to oplegnathus punctatus data.
Table 6 Comparison of HPFPE with HRNet on oplegnathus punctatus data
Method Backbone Input size AP/% AP50/% AP75/% AR/% AR50/% AR75/%
HRNet HRNet-W32 256×192 71.50 96.72 76.69 75.45 97.00 79.00
HRNet-W32 384×288 72.70 96.95 78.77 76.35 97.50 81.00
HRNet-W48 256×192 71.15 94.53 77.39 75.25 95.50 80.50
HRNet-W48 384×288 72.84 96.66 80.74 76.60 97.00 82.50
HPFPE (Ours) HRNet-W32 256×192 72.12 97.98 74.87 76.30 98.50 78.50
HRNet-W32 384×288 74.05 99.01 75.82 77.85 99.50 80.00
HRNet-W48 256×192 72.91 96.90 78.13 76.65 97.00 80.50
HRNet-W48 384×288 74.12 97.89 81.99 77.60 98.00 84.00
A comparative analysis was conducted on the heatmaps generated by HPFPE and those produced by the standard HRNet using oplegnathus punctatus data, as shown in Fig. 5, which demonstrates that the integration of CBAM and dilated convolution enables the model to place greater emphasis on the key points of the fish body. When employing HRNet-W32 as the backbone with an input size of 384×288, it is evident that HPFPE can simultaneously focus on both fish and place greater emphasis on their heads compared to the original HRNet model. Thus, the integration of CBAM and dilated convolution enhances the model's capability to concentrate on the key points of the fish body.
Fig. 5 Heatmap comparison of HPFPE and baseline on oplegnathus punctatus data

a. Original image b. HRNet-W32/256×192 c. HRNet-W32/384×288 d. HRNet-W48/256×192 e. HRNet-W48/384×288

2.3 Comparison with other methods

In addition to the original HRNet[5], a comparative analysis of HPFPE was conducted against other prominent pose estimation methods, including DeepPose[3], Convolutional Pose Machines (CPM)[4], SCNet[6], and Lite-HRNet[7]. This evaluation was performed using oplegnathus punctatus data with input sizes of 256×192 and 384×288. As demonstrated in Table 7 and Table 8, HPFPE surpassed all other methods at both input sizes when HRNet-W48 served as the backbone. At the 256×192 input size, HPFPE demonstrated significant enhancements in AP scores, achieving improvements of 30.67, 31.45, and 29.87 percent point over DeepPose, as well as a 10.69 percent point advantage over CPM. Additionally, it outperformed SCNet by 2.76 and 3.46 percent point, and Lite-HRNet by 4.90 and 5.68 percent point. The AR score of HPFPE also surpassed that of the other methods, indicating its superior performance in terms of recall in the pose estimation task. For the 384×288 input size, HPFPE demonstrated an improvement in the AP score by 6.86 points compared to CPM, 2.50 and 2.45 percent point compared to SCNet, and 4.16 and 4.11 percent point compared to Lite-HRNet, while also achieving correspondingly higher AR scores. Additionally, by comparing the AP50 and AP75 scores, it is evident that HPFPE outperforms other methods. These results indicate that HPFPE consistently outperforms other mainstream methods in terms of both AP and AR.
Table 7 Comparison with other methods on oplegnathus punctatus data when input size is 256×192
Method Backbone AP/% AP50/% AP75/% AR/% AR50/% AR75/%
DeepPose ResNet-50 42.24 83.66 36.89 57.30 90.00 58.50
ResNet-101 41.46 85.08 35.71 57.05 91.00 58.00
ResNet-152 43.04 85.46 37.07 58.40 91.00 59.00
CPM CPM 62.22 93.53 67.25 66.45 95.00 71.00
SCNet SCNet-50 70.15 96.86 74.54 73.95 97.00 78.00
SCNet-101 69.45 95.78 74.36 74.10 96.50 78.50
Lite-HRNet Lite-HRNet-18 68.01 92.77 73.10 72.00 94.00 76.00
Lite-HRNet-30 67.23 96.64 73.01 70.55 97.00 75.00
HPFPE(Ours) HRNet-W32 72.12 97.98 74.87 76.30 98.50 78.50
HRNet-W48 72.91 96.90 78.13 76.65 97.00 80.50
Table 8 Comparison with other methods on oplegnathus punctatus data when input size is 384×288
Method Backbone AP/% AP50/% AP75/% AR/% AR50/% AR75/%
CPM CPM 67.26 94.42 71.60 71.85 95.50 76.00
SCNet SCNet-50 71.62 96.82 75.35 75.20 97.50 78.50
SCNet-101 71.67 96.82 77.94 75.60 97.50 81.00
Lite-HRNet Lite-HRNet-18 69.96 97.76 72.71 73.60 98.00 76.50
Lite-HRNet-30 70.01 93.64 75.72 73.75 95.00 78.00
HPFPE(Ours) HRNet-W32 74.05 99.01 75.82 77.85 99.50 80.00
HRNet-W48 74.12 97.89 81.99 77.60 98.00 84.00
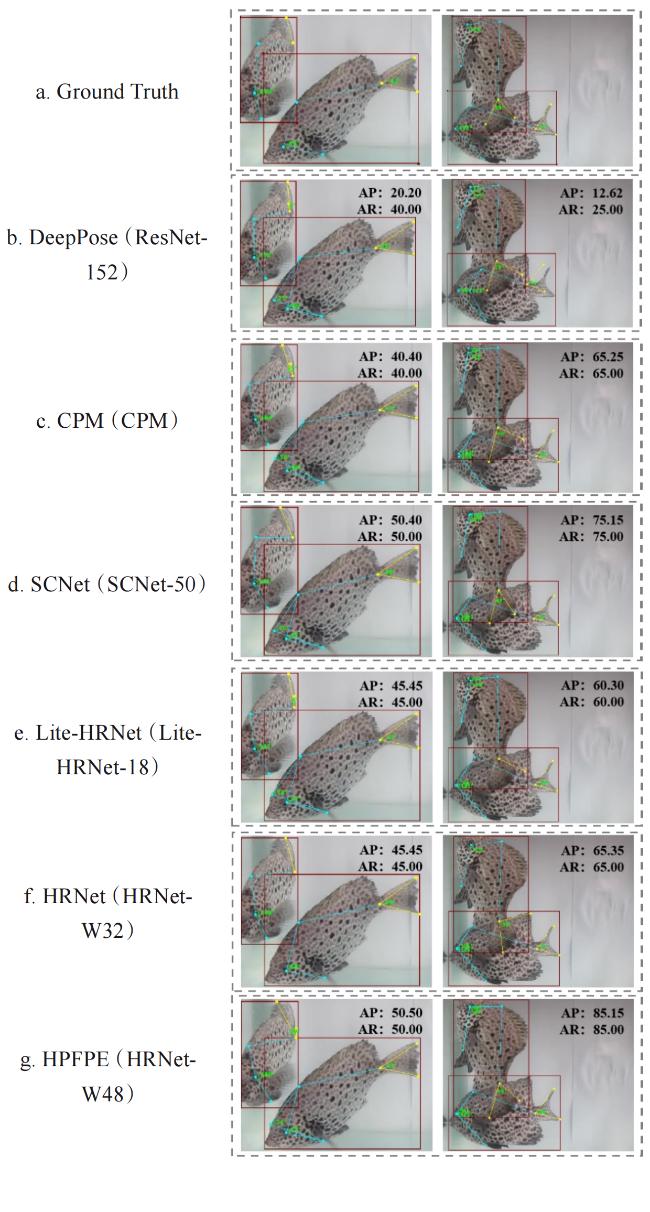
Fig. 6 Visualization results of different methods on oplegnathus punctatus data
An input size of 256×192 was selected along with the backbone that produced the highest AP for each method. The pose estimation results obtained through various methods on the oplegnathus punctatus data were visualized and compared with the ground truth annotations. Additionally, the relevant angles were calculated to illustrate the swinging motion of the fish's head and tail, as shown in Fig. 6. It was evident that when the fish swim sideways, not only can the visible key points be accurately predicted, but also the key points of the invisible eye. Compared to other methods, the keypoints and angles predicted by the model exhibit smaller deviations from the ground truth, leading to more accurate FPE.

2.4 Comparison of CBAM pose estimation results at different locations

CBAM enables the model to capture pose-related information more effectively, thereby enhancing the accuracy of feature representation. However, the incorporation of CBAM at various positions within the model influences performance differently. The effects of positioning CBAM modules was investigated at different locations within HRNet on the pose estimation results for oplegnathus punctatus data, as presented in Table 9. The CBAM module was placed in three locations: the feature extraction part of HRNet (CBAMfront), after the fusion layer (CBAMfuse), and after the stage (CBAMstage). As shown in the Table 9, CBAMstage achieves the best AP and AR under the same backbone and input size compared to the other two positions. Specifically, when using HRNet-W32 with an input size of 384×288, CBAMstage attains the highest AP and AR, at 74.02% and 77.40%, respectively. Compared to CBAMfuse, the AP increases by 3.79 percent point when using HRNet-W48 with an input size of 384×288. The highest values of AP50, AP75, AR50, and AR75 achieved by CBAMstage surpass those of both CBAMfront and CBAMfuse. The results indicate that positioning the CBAM after the stage achieves optimal performance, followed by placement in the fusion layer, whereas its integration within the feature extraction component demonstrates the least effectiveness. Consequently, positioning the CBAM after the stage enhances the refinement of stage features, leading to improved final pose estimation accuracy for oplegnathus punctatus data.
Table 9 The oplegnathus punctatus data pose estimation results obtained by adding CBAM modules at different positions of HRNet
Method Backbone Input size AP/% AP50/% AP75/% AR/% AR50/% AR75/%
HRNet+CBAMfront HRNet-W32 256×192 71.85 95.90 78.60 75.80 96.50 81.50
HRNet-W32 384×288 73.46 96.88 79.33 76.75 97.50 82.00
HRNet-W48 256×192 71.37 96.93 76.45 75.15 97.50 80.50
HRNet-W48 384×288 73.23 96.66 77.90 76.45 97.00 80.50
HRNet+CBAMfuse HRNet-W32 256×192 70.95 95.94 77.42 74.85 96.50 80.50
HRNet-W32 384×288 71.93 95.78 75.41 76.10 96.50 78.50
HRNet-W48 256×192 71.09 96.81 77.20 75.75 97.00 81.00
HRNet-W48 384×288 69.61 96.96 73.95 73.05 97.00 76.50
HRNet+CBAMstage HRNet-W32 256×192 71.94 93.83 80.43 75.90 95.00 82.50
HRNet-W32 384×288 74.02 95.94 80.49 77.40 96.50 82.50
HRNet-W48 256×192 71.86 95.79 81.60 76.00 96.00 84.00
HRNet-W48 384×288 73.40 97.85 78.87 76.75 98.00 81.00

2.5 Comparison with other attention mechanisms

To evaluate the effectiveness of CBAM, CBAM was replaced with SE, ECA, CA, and LSKblock attention mechanisms, respectively, and was compared the pose estimation performance of HRNet when integrated with different attention mechanisms. The experimental results are presented in Table 10, which CBAM achieved the highest AP and AR of 74.02% and 77.40%, respectively, when the backbone network is HRNet-W32 and the input size is 384×288. Furthermore, under the same backbone network and input size, CBAM achieved the highest AP and AR values. Overall, CBAM shows minimal differences compared to other attention mechanisms in terms of AP50 and AR50, but demonstrates superior performance in AP75 and AR75. Therefore, compared to other attention mechanisms, the incorporation of CBAM more effectively enhanced the accuracy of the HPFPE model.
Table 10 Comparison with other attention mechanisms for pose estimation of CBAM
Attention mechanism Backbone Input size AP/% AP50/% AP75/% AR/% AR50/% AR75/%
SE24 HRNet-W32 256×192 71.53 97.89 77.95 76.30 98.00 81.00
HRNet-W32 384×288 73.23 96.88 78.60 77.20 97.50 81.00
HRNet-W48 256×192 71.55 97.95 81.97 74.95 98.50 84.00
HRNet-W48 384×288 72.79 96.81 78.37 76.25 97.00 81.00
ECA25 HRNet-W32 256×192 71.59 96.95 76.18 75.30 97.50 79.50
HRNet-W32 384×288 72.49 97.89 79.66 77.35 98.00 83.00
HRNet-W48 256×192 71.82 94.56 76.64 75.70 95.50 79.00
HRNet-W48 384×288 72.79 96.81 78.37 76.25 97.00 81.00
CA26 HRNet-W32 256×192 71.02 94.94 77.60 74.50 95.50 80.00
HRNet-W32 384×288 73.03 97.95 77.97 75.75 98.00 80.00
HRNet-W48 256×192 70.55 94.97 77.74 74.40 95.50 80.50
HRNet-W48 384×288 72.82 97.86 77.39 76.75 98.00 80.00
LSKblock[27] HRNet-W32 256×192 71.71 97.89 77.40 75.35 98.00 80.00
HRNet-W32 384×288 72.26 96.93 77.37 75.55 97.50 79.00
HRNet-W48 256×192 71.83 95.85 78.14 75.75 96.50 81.50
HRNet-W48 384×288 71.89 95.95 76.91 75.00 96.00 79.00
CBAM23 HRNet-W32 256×192 71.94 93.83 80.43 75.90 95.00 82.50
HRNet-W32 384×288 74.02 95.94 80.49 77.40 96.50 82.50
HRNet-W48 256×192 71.86 95.79 81.60 76.00 96.00 84.00
HRNet-W48 384×288 73.40 97.85 78.87 76.75 98.00 81.00

2.6 Ablation experiment

To evaluate the effectiveness of incorporating both dilated convolution and CBAM, ablation experiments on HPFPE were conducted using oplegnathus punctatus data. The ablation studies were performed on the original HRNet, a model incorporating only dilated convolutions, a model with only CBAM, and a model combining both dilated convolutions and CBAM. The experimental results are summarized in Table 11. As demonstrated, the inclusion of either dilated convolution or CBAM alone results in modest enhancements in the AP and AR scores across different backbones and input sizes. However, when both components are combined, the model exhibits a more substantial improvement in performance. In addition, after the introduction of CBAM and dilated convolution, AP50 and AR50 are generally improved, while the differences in AP75 and AR75 remain relatively small. These results confirm that the integration of dilated convolution and CBAM modules significantly enhances the performance of this fish pose estimation model.
Table 11 Ablation experiments of HPFPE on oplegnathus punctatus data
Backbone Input size Dilated convolution CBAM AP/% AP50/% AP75/% AR/% AR50/% AR75/%
HRNet-W32 256×192 71.50 96.72 76.69 75.45 97.00 79.00
71.68 95.87 79.83 75.50 96.50 82.00
71.94 93.83 80.43 75.90 95.00 82.50
72.12 97.98 74.87 76.30 98.50 78.50
HRNet-W32 384×288 72.70 96.95 78.77 76.35 97.50 81.00
73.09 96.95 78.29 76.95 97.50 80.50
74.02 95.94 80.49 77.40 96.50 82.50
74.05 99.01 75.82 77.85 99.50 80.00
HRNet-W48 256×192 71.15 94.53 77.39 75.25 95.50 80.50
72.11 96.83 77.80 75.95 97.50 80.50
71.86 95.79 81.60 76.00 96.00 84.00
72.91 96.90 78.13 76.65 97.00 80.50
HRNet-W48 384×288 72.84 96.66 80.74 76.60 97.00 82.50
73.49 96.89 79.16 77.15 97.00 82.00
73.40 97.85 78.87 76.75 98.00 81.00
74.12 97.89 81.99 77.60 98.00 84.00

2.7 Comparison on ornamental fish data

To evaluate the generalization capability of HPFPE, its performance was compared against DeepPose, CPM, HRNet, SCNet, and Lite-HRNet using ornamental fish data. The experimental results are shown in Table 12. When employing HRNet-W48 as the backbone with an input size of 384×288, HPFPE achieves an AP of 52.96% and an AR of 59.50%, surpassing the performance of other pose estimation methods. In comparison to the results obtained with oplegnathus punctatus data, both AP and AR decrease by approximately 20 percent points, a decline that may be attributed to the increased number of fish present in the images. In addition, on the ornamental fish dataset, HPFPE better than most other algorithms in terms of AP, AR, AP50, AR50, AP75, and AR75, further demonstrating its effectiveness and generalization capability. Nonetheless, further improvements are feasible in scenarios involving large numbers of fish.
Table 12 Comparison with five methods on ornamental fish data
Method Backbone Input size AP/% AP50/% AP75/% AR/% AR50/% AR75/%
DeepPose ResNet-50 256×192 4.05 21.50 0.20 11.25 40.00 2.50
ResNet-101 256×192 7.66 30.80 0.00 13.75 50.00 0.00
ResNet-152 256×192 8.48 32.07 0.08 16.00 50.00 2.50
CPM CPM 256×192 27.25 84.78 6.01 34.50 85.00 17.50
CPM 384×288 33.76 89.88 18.92 42.50 90.00 37.50
SCNet SCNet-50 256×192 44.04 89.89 40.68 51.25 90.00 55.00
SCNet-50 384×288 49.00 85.20 50.85 55.50 87.50 62.50
SCNet-101 256×192 47.20 94.06 44.68 54.25 95.00 55.00
SCNet-101 384×288 50.37 93.88 56.17 58.50 95.00 65.00
Lite-HRNet Lite-HRNet-18 256×192 39.67 89.97 30.35 47.00 90.00 45.00
Lite-HRNet-18 384×288 45.72 94.06 35.12 52.50 95.00 50.00
Lite-HRNet-30 256×192 39.82 80.55 41.12 46.75 82.50 55.00
Lite-HRNet-30 384×288 43.02 90.10 37.32 50.75 90.00 52.50
HRNet HRNet-W32 256×192 47.63 92.03 40.77 55.50 92.50 55.00
HRNet-W32 384×288 48.11 89.25 41.87 56.00 90.00 57.50
HRNet-W48 256×192 47.25 87.13 42.85 52.50 87.50 55.00
HRNet-W48 384×288 50.76 94.06 40.92 58.25 95.00 57.50
HPFPE(Ours) HRNet-W32 256×192 47.88 92.03 33.28 54.25 92.50 50.00
HRNet-W32 384×288 49.50 90.46 38.23 56.25 92.50 55.00
HRNet-W48 256×192 48.54 84.91 44.25 55.50 87.50 57.50
HRNet-W48 384×288 52.96 91.18 52.67 59.50 92.50 62.50
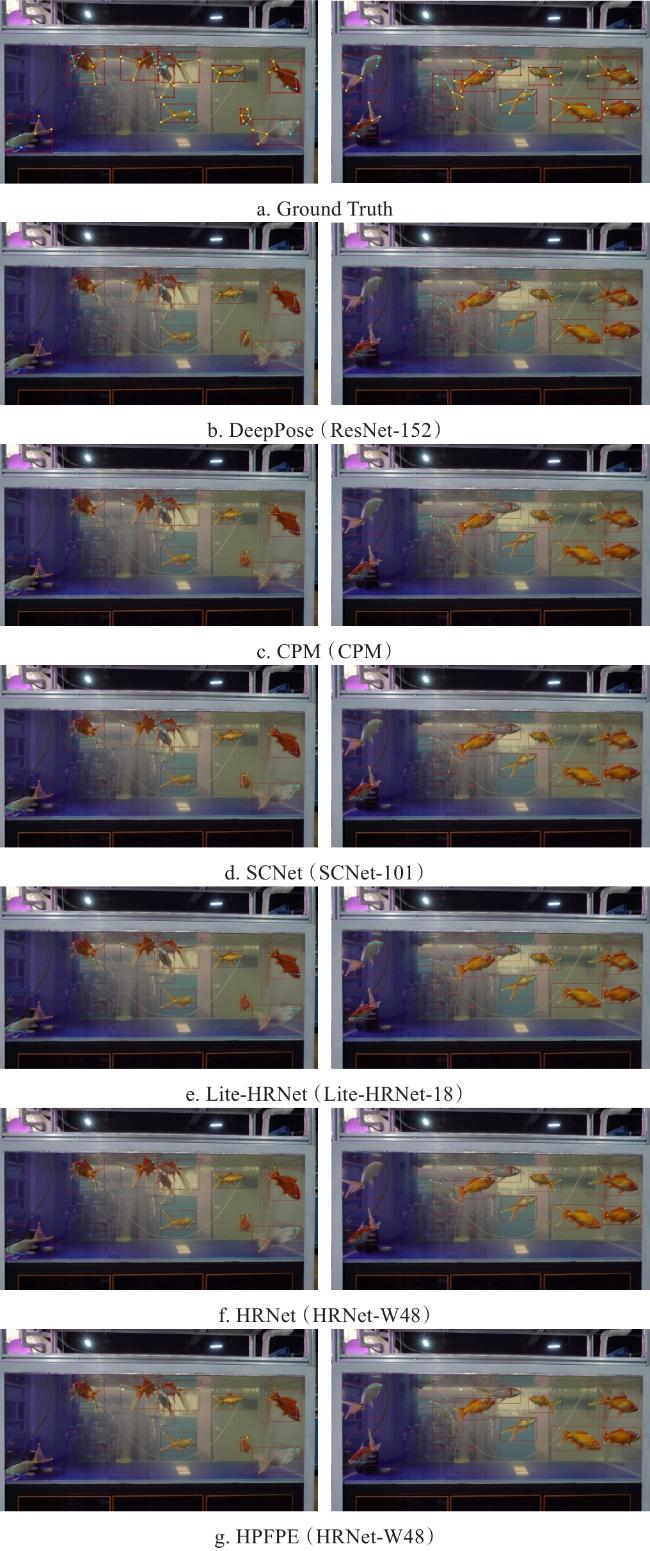
An input size of 256×192 was selected along with the backbone that achieved the highest AP for HPFPE. The pose estimation results from various approaches on ornamental fish data were visualized and compared against the ground truth. The results are shown in Fig. 7. Clearly, HPFPE demonstrates superior prediction accuracy for the key points of fish compared to other methods, exhibiting a smaller deviation specifically for the eyes and tail. This improvement reflects the model's strong generalization capability. However, when portions of the fish body are occluded or when the background color closely resembles that of the fish, the predicted key points may become inaccurate or indiscernible. This limitation presents an opportunity for future research and enhancement.
Fig. 7 Visualization results of different methods on ornamental fish data

3 Discussion and conclusion

3.1 Discussion

The task defined in this study presents several unique challenges compared to standard human pose estimation. Fish exhibit greater variability in morphology across species, higher deformability, and more frequent self-occlusion, particularly in unconstrained aquatic environments. In contrast to terrestrial subjects, underwater imaging is affected by factors such as water turbidity, light refraction, and motion blur, increasing the difficulty of reliable keypoint detection and pose estimation. Furthermore, fish often appear in dense formations or exhibit fast, irregular movements, making the task of pose estimation inherently more complex and less studied.
In terms of performance, the HPFPE model was compared not only with baseline variants but also by referencing leading methods in human pose estimation, as aquatic pose estimation remains underexplored. Recent studies such as Kan et al.[24], Huang et al.[25], and Wang et al.[26] have demonstrated high accuracy in general human pose estimation tasks, achieving AR above 70% and AP surpassing 65% on standard benchmarks like COCO. However, direct application of such methods to aquatic environments, especially for fish with non-rigid, highly deformable bodies, leads to significant performance degradation due to environmental noise and inter-species variance. On the fish pose estimation dataset, HPFPE achieves higher AR and AP compared to baseline variants adapted from human pose estimation networks. However, for ornamental fish in scenes with dense occlusion and visually intricate features, the model exhibits a noticeable drop in detection accuracy, reflecting the inherent challenge of directly transferring pose estimation paradigms from terrestrial to aquatic domains. This highlights the necessity of domain-specific architectural and data-level adaptations in future work.
It is important to emphasize that although the absolute improvement in metric values such as AR and AP are not dramatic, this study makes a meaningful methodological contribution by integrating hierarchical feature perception and deformable sampling into a unified network architecture, which offers a new perspective for tackling aquatic pose tasks. More significantly, it introduces a benchmark and evaluation framework tailored to aquaculture application scenarios, helping to bridge the methodological gap between general pose estimation and domain-specific deployment. This provides a foundation for future research and technology transfer.
Further study will devote to the following three aspects. First, the dataset used in this study lacks diversity in environmental conditions, whereas real-world aquaculture environments often present challenges such as water turbidity and fish occlusion, which may affect model performance. Expanding the dataset to encompass a wider range of environmental variations and more complex conditions could enhance the model's robustness and generalizability. Second, computational efficiency remains a critical concern, particularly for real-time monitoring in large-scale aquaculture systems. Future research could explore model optimization strategies to enhance its feasibility for real-time applications. Third, integrating pose estimation with fish tracking algorithms is essential for long-term behavioral analysis. Future studies could incorporate multi-frame temporal information to improve tracking accuracy, mitigate occlusion effects, and provide deeper insights into fish behavior, thereby contributing to more effective aquaculture management.

3.2 Conclusions

This paper introduced HPFPE, a fish pose estimation model based on HRNet, designed specifically to estimate the poses of underwater fish. To enhance model performance, CBAM were incorporated after each stage of HRNet and dilated convolution was applied to expand the receptive field. Experimental results demonstrate that HPFPE achieves an AP of 74.12% on oplegnathus punctatus data with an input size of 384×288 using HRNet-W48 as the backbone, representing an improvement of 1.28% over the original HRNet. Additionally, the model performs well on ornamental fish data, demonstrating its adaptability across different fish species. Therefore, this study advances the accuracy of FPE, offering valuable scientific insights that can support further research and serve as a foundational basis for fish behavior recognition.

All authors declare no competing interests.

[1]
PENG Q, LI W, LI Z. Review of fish behavior recognition methods based on artificial intelligence[J]. Transactions of the Chinese society for agricultural machinery, 2023, 54(S1): 283-295.

[2]
ZHENG C, WU W H, CHEN C, et al. Deep learning-based human pose estimation: A survey[J]. ACM computing surveys, 2024, 56(1): 1-37.

[3]
SUN K, XIAO B, LIU D, et al. Deep high-resolution representation learning for human pose estimation[C]// 2019 IEEE/CVF Conference on Computer Vision and Pattern Recognition (CVPR). Piscataway, New Jersey, USA: IEEE, 2019: 5686-5696.

[4]
LIU J J, HOU Q B, CHENG M M, et al. Improving convolutional networks with self-calibrated convolutions[C]// 2020 IEEE/CVF Conference on Computer Vision and Pattern Recognition (CVPR). Piscataway, New Jersey, USA: IEEE, 2020: 10093-10102.

[5]
YU C Q, XIAO B, GAO C X, et al. Lite-HRNet: A lightweight high-resolution network[C]// 2021 IEEE/CVF Conference on Computer Vision and Pattern Recognition (CVPR). Piscataway, New Jersey, USA: IEEE, 2021: 10435-10445.

[6]
YAN S J, XIONG Y J, LIN D H. Spatial temporal graph convolutional networks for skeleton-based action recognition[C]// Proceedings of the AAAI conference on artificial intelligence. Palo Alto, California USA: AAAI Press. 2018, 32(1): 7444-7452.

[7]
MARKOVITZ A, SHARIR G, FRIEDMAN I, et al. Graph embedded pose clustering for anomaly detection[C]// 2020 IEEE/CVF Conference on Computer Vision and Pattern Recognition (CVPR). Piscataway, New Jersey, USA: IEEE, 2020: 10536-10544.

[8]
DAS S, SHARMA S, DAI R, et al. VPN: Learning video-pose embedding for activities of daily living[C]// Computer Vision – ECCV 2020. Cham, Germany: Springer International Publishing, 2020: 72-90.

[9]
YANG X T, ZHANG S, LIU J T, et al. Deep learning for smart fish farming: Applications, opportunities and challenges[J]. Reviews in aquaculture, 2021, 13(1): 66-90.

[10]
YUE J, YANG H H, JIA S X, et al. A multi-scale features-based method to detect Oplegnathus [J]. Information processing in agriculture, 2021, 8(3): 437-445.

[11]
WANG H R, CHEN Y Y, CHAI Y Q, et al. Image segmentation method combined with VoVNetv2 and shuffle attention mechanism for fish feeding in aquaculture[J]. Smart agriculture, 2023, 5(4): 137-149.

[12]
LI W R, LI F, LI Z B. CMFTNet: Multiple fish tracking based on counterpoised JointNet[J]. Computers and electronics in agriculture, 2022, 198: ID 107018.

[13]
ZHAO Y Y, LI W R, LI Y M, et al. LFCNet: A lightweight fish counting model based on density map regression[J]. Computers and electronics in agriculture, 2022, 203: ID 107496.

[14]
BANAN A, NASIRI A, TAHERI-GARAVAND A. Deep learning-based appearance features extraction for automated carp species identification[J]. Aquacultural engineering, 2020, 89: ID 102053.

[15]
DU Z Z, XU X B, BAI Z Z, et al. Feature fusion strategy and improved GhostNet for accurate recognition of fish feeding behavior[J]. Computers and electronics in agriculture, 2023, 214: ID 108310.

[16]
LI B B, YUE J, JIA S X, et al. Recognition of abnormal body surface characteristics of Oplegnathus punctatus [J]. Information processing in agriculture, 2022, 9(4): 575-585.

[17]
HU W C, YANG X T, MA P C, et al. DCA-MVIT: Fused DSGated convolution and CA attention for fish feeding behavior recognition in recirculating aquaculture systems[J]. Aquaculture, 2025, 598: ID 742008.

[18]
MATHIS A, MAMIDANNA P, CURY K M, et al. DeepLabCut: Markerless pose estimation of user-defined body parts with deep learning[J]. Nature neuroscience, 2018, 21(9): 1281-1289.

[19]
WU X, HUANG J P, WANG L M. Pose estimation-based visual perception system for analyzing fish swimming[J]. IEEE sensors journal, 2024, 24(8): 13293-13303.

[20]
WANG L, ZOU H Q, CHEN S H. Fish identification and tracking based on pose estimation[C]// 2024 IEEE 19th Conference on Industrial Electronics and Applications (ICIEA). Piscataway, New Jersey, USA: IEEE, 2024.

[21]
CUI H P, QIN C X, MA Z Y. Fish key feature point detection and sign identification based on deep learning[J]. Journal of Chinese agricultural mechanization, 2024, 45(6): 201-207.

[22]
YU F, KOLTUN V. Multi-scale context aggregation by dilated convolutions[EB/OL]. arXiv: 1511.07122, 2015.

[23]
WOO S, PARK J, LEE J Y, et al. CBAM: Convolutional Block attention module[C]// Computer Vision – ECCV 2018. Cham, Germany: Springer International Publishing, 2018: 3-19.

[24]
KAN Z H, CHEN S S, ZHANG C, et al. Self-correctable and adaptable inference for generalizable human pose estimation[C]// 2023 IEEE/CVF Conference on Computer Vision and Pattern Recognition (CVPR). Piscataway, New Jersey, USA: IEEE, 2023: 5537-5546.

[25]
HUANG L Z, LI Y L, TIAN H B, et al. Semi-supervised 2D human pose estimation driven by position inconsistency pseudo label correction module[C]// 2023 IEEE/CVF Conference on Computer Vision and Pattern Recognition (CVPR). Piscataway, New Jersey, USA: IEEE, 2023: 693-703.

[26]
WANG H X, ZHOU L, CHEN Y Y, et al. Regularizing vector embedding inBottom-up human pose estimation[C]// Computer Vision – ECCV 2022. Cham, Germany: Springer, 2022: 107-122.

文章导航

/