


0 Introduction
Maize, as one of the three major global food crops, plays a pivotal role in maintaining stable food supplies, which is critical for global food security[1]. High-quality seeds are central to improving maize productivity and ensuring grain quality. As a typical monoecious crop, maize exhibits genetic phenomena such as self-incompatibility and heterosis, which are pivotal in plant genetics[2]. To preserve superior parental traits, hybrid breeding is widely adopted in maize seed production, where maternal detasseling serves as a key step. Traditional detasseling relied heavily on labor-intensive manual methods, which were subjective and environmentally sensitive. Current practices combine mechanical and manual detasseling, yet challenges persist due to varietal differences among parental lines and environmental factors such as temperature, light, and nutrient availability. These variables lead to variations in plant height and tasseling timing, while existing tassel detection methods suffer from insufficient feature extraction capability and suboptimal performance. Even when deployed on detasseling UAVs, these methods often fail to achieve desired outcomes, necessitating repeated manual interventions. Consequently, developing a rapid and accurate maize tassel detection method is essential for advancing precision and automation in UAV-based detasseling systems.
In recent years, with the continuous development of smart agriculture, UAV remote sensing technology and computer vision methods have been widely applied in crop growth monitoring[3], pest and disease identification[4], and yield prediction[5]. Domestic and international researchers have conducted extensive research on maize tassel detection. Traditional machine vision methods mainly utilize feature extraction algorithms based on color, texture, and geometric shapes to extract maize tassel features. For example, Lu et al.[6] developed a color-based joint segmentation method that achieves joint segmentation of maize and tassels through the biological characteristics of maize tassels changing over time, reaching an average accuracy of 74.3%. However, excessive reliance on color features easily leads to performance bottlenecks. Kurtulmuş and Kavdir[7] used support vector machines (SVM) classifiers and morphological operations to determine the final position of maize tassels. However, due to the diversity of backgrounds, differences in lighting, occlusion, shadow areas, and color similarities, the model's correct detection rate was only 81.6%. Although the above research has made certain progress, traditional machine vision methods often require profound domain knowledge to manually design feature extraction methods. Additionally, the relatively high planting density of maize, occlusion between tassels and between tassels and leaves, and complex field environments further increase the difficulty of maize tassel feature extraction. Therefore, many researchers have combined deep learning algorithms with computer vision techniques to achieve higher accuracy than traditional machine vision by automatically learning features from large amounts of data. Currently, this technology has been applied to maize tassel detection work.
There are mainly two categories of methods using deep learning algorithms for maize phenotype detection: segmentation[8] and detection[9]. Segmentation methods distinguish the target from the background at the pixel level. For example, Yu et al.[10] used a U-Net model to segment maize tassels from ground-level RGB images and UAV images, resulting in clearer segmentation boundaries and more complete preservation of tassel morphology, and the intersection over union (IoU) reached 71%. Wan et al.[11] proposed an improved U-Net model that optimizing encoder feature extraction through cascaded convolutional networks and constructed expansion paths through multi-scale dilated convolution fusion to preserve spatial details, ultimately achieving accurate recognition of maize field growth stages. Liu et al.[12] implemented efficient image segmentation based on the DeepLabv3+ model and adopted distance transform skeletonization technology to extract stem and leaf morphological features, achieving a segmentation mIoU of 79.91%.
The above-mentioned maize phenotype detection method based on semantic segmentation has a more precise segmentation effect, but the model is more complex and requires more computing resources. Moreover, maize tasseling is a critical stage in maize growth and development, and detasseling is a task that demands high real-time performance, making this method unsuitable for deployment on detasseling UAVs. Unlike segmentation methods, YOLO (You Only Look Once), one of the representative object detection algorithms, is widely applied in real-time detection tasks due to its outstanding performance. For instance, Li et al. [13] proposed a real-time pattern recognition framework for ground-penetrating radar (GPR) images using YOLOv3 implemented with TensorFlow. Their approach employs the visual intersection over union (V-IoU) method to address electromagnetic signal vacillation, significantly enhancing bounding box localization accuracy. Therefore, YOLO is particularly suitable for maize tassel detection tasks. Pu et al.[14] proposed Tassel-YOLO, an improved maize tassel detection and counting model based on YOLOv7, enhancing the network's nonlinear expression capability through the vision-oriented variant grouped spatial convolution cross-stage partial (VoVGSCSP) module. Niu et al.[15] proposed a method based on RGB images and the YOLOv8 model to identify and count maize tassels, evaluating the model's accuracy under different height conditions and determining that the highest accuracy of 97.59% was achieved at a height of 5 m, providing valuable reference for our subsequent data collection and research direction. Jia et al.[16] designed a maize tassel detection model based on YOLOv5 embedded with coordinate attention mechanism, effectively suppressing irrelevant features in field environments, indicating that the introduction of attention mechanisms can dynamically focus on key information and reduce redundant data, providing new insights for visual detection of maize tassels in complex field environments. Liu et al.[17] used an improved Faster R-CNN (Fast region-based convolutional neural network) model combined with ResNet network to detect maize tassels with high precision from images collected by UAVs and mobile phones, and optimized small target detection capability by adjusting anchor box sizes, achieving an accuracy of 95.95%. Falahat and Karami[18] proposed a lightweight maize tassel detection model which is based on improved YOLOv5 and compared with Faster R-CNN, SSD (Single Shot MultiBox Detector), RetinaNet, and TasselNetv2+. In terms of speed and performance quality, results showed that this model outperformed other advanced detection methods in overall performance. The above research further validates the broad potential of object detection models in maize tassel detection applications.
Despite the progress made by previous researchers in maize tassel detection, there are still some deficiencies in existing research. First, data collection time is concentrated and data samples are single, which lack multiple growth stages and diverse environmental conditions, remain a bottleneck constraining the development of maize tassel detection technology. Second, maize tasseling is a continuous biological process, and tassel phenotypes vary significantly across different varieties. Traditional architectures exhibit a limited capacity to capture subtle tassel features, resulting in poor detection performance and restricting their effectiveness in complex scenarios. Finally, existing models demand high computational resource, which is unfavorable to deployment on hardware devices like UAVs, thereby making it challenging to meet real-time field detection needs. In order to solve the above problems, a field maize tassel identification method based on improved YOLOv11n was proposed, named LightTassel-YOLO.
1 Materials and methods
The experimental design of this research is presented in Fig.1. The experimental design of this study is in Fig. 1. Detailed explanations of the maize planting situation, data acquisition scheme, model architecture design, experimental setup, and evaluation are provided in the following four sections.
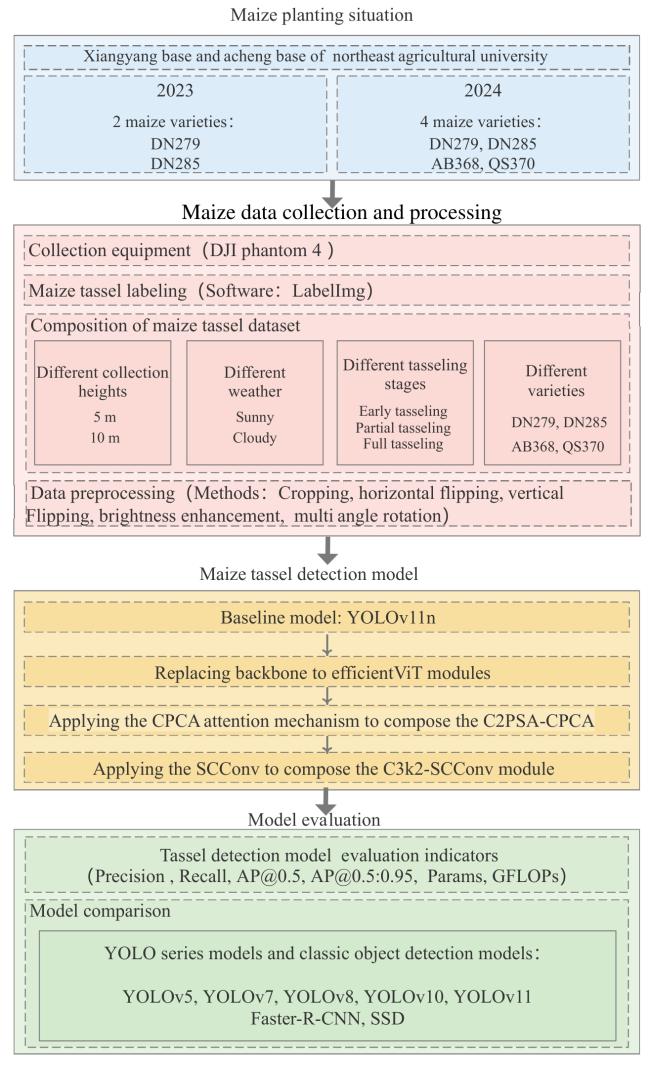
Fig. 1 Flowchart of the LightTassel-YOLO |
1.1 Dataset construction
1.1.1 Data collection
The research area was situated at the Xiangyang base (126°55′39″E, 45°45′48″N) and Acheng base (127°2′58″E, 45°31′18″N) of Northeast Agricultural University in Harbin city, Heilongjiang province, China. The experimental base cultivated four varieties, DN279, DN285, AB368, and QS370. This study employed a DJI Phantom 4 Pro unmanned aerial vehicle (UAV), which was equipped with a high-resolution digital camera, the DJI FC6310 (DJI Innovations, Shenzhen, Guangdong, China), having a resolution of 5 472 × 3 648 pixels. Maize tassel data were collected in July of both 2023 and 2024. To ensure the diversity of the dataset and robustness, data acquisition was conducted under various weather conditions, including clear skies and overcast days. During the early tasseling stage, the exposed part of the tassel was minimal and visually similar to the surrounding leaves, making it susceptible to occlusion. As such, a relatively low flight altitude of 5 m was selected to enhance image acquisition accuracy. During the mid to late tasseling stages, as the tassels became more prominent and distinguishable, the flight altitude was adjusted to 10 m to better capture their structural features.
Representative images of maize tassels captured are shown in Fig. 2. The maize tassels at the early, partial, and full tasseling stages are illustrated in Fig. 2a~Fig. 2c, respectively. At the early tasseling stage, the tassels have just emerged and exhibited weak textural features while sharing a similar coloration with the leaf veins, which makes them difficult to distinguish and increasing the complexity of tassel detection. From partial to full tasseling, the tassels gradually unfold and become visually prominent due to their golden-yellow pollen. The maize tassels captured under sunny and cloudy conditions are illustrated in Fig. 2d~Fig. 2e, respectively. As seen from the comparison, under strong sunlight, images tend to be overexposed, resulting in blurred boundaries between tassels and leaves, which complicates their differentiation. Conversely, under overcast conditions, although the overall image appears darker, the difference in reflectivity between tassels and leaves becomes more distinct, thereby facilitating their separation from the complex background. The images captured at 5 m and 10 m flight altitudes are shown in Fig. 2f and Fig. 2g. Due to variations in maize cultivars within the experimental field, tasseling times also varied slightly. Based on these circumstances, the model was trained using a combination of data collected at different altitudes, tasseling stages, weather conditions, and from different maize varieties, to further enhance its generalization capability. During the early to mid-tasseling stages, tassels are frequently occluded by surrounding leaves, as illustrated in Fig. 2h. In addition, high planting density often leads to mutual occlusion between adjacent tassels, as shown in Fig. 2i. These diverse tassel samples collectively constitute the dataset used in this study.
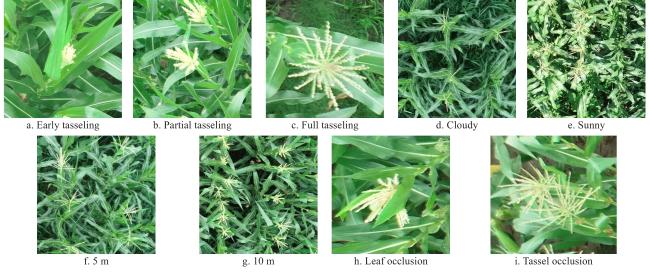
Fig. 2 Maize tassel dataset |
1.1.2 Data pre-processing
A total of 684 UAV images of maize tassels were collected in 2023. The boundaries of the tassels were manually annotated using the LabelImg software tool. Given the original image resolution of 5 472×3 648 pixels, directly inputting these high-resolution images into a deep learning network would substantially increased memory consumption during model training and inference, potentially causing memory overflow. Therefore, prior to being fed into the network, the images were cropped to a size of 640×640 pixels. Through a series of data augmentation techniques, including rotation, vertical and horizontal flipping, brightness adjustment, contrast adjustment, hue adjustment, and sharpening, a total of 3 423 images were generated. The data collected in 2023 was used for training and validation, and the training set and validation set were divided into 7∶3 ratio for the above enhanced data. In order to reduce the imbalance between the training samples and the validation samples that may be caused by the differences in lighting conditions, weather (such as wind influence) and other variables, the images were randomly shuffled to form the training set and the validation set. In order to verify the robustness of the model, 300 images were selected from 728 UAV corn ear images obtained in 2024 as the test set, and the images were cropped to 640 × 640 pixels, and a total of 944 images were obtained in the test set. Four sets of UAV image datasets were constructed according to the maize tasseling period, maize varieties, collection height and collection weather, as shown in Table 1. According to the different tasseling periods of maize, the test set was divided into early tasseling, partial tasseling, and complete tasseling. According to the different maize varieties, it was divided into DN279, DN285, AB368 and QS370. According to the different heights, it was divided into 5 and 10 m. Depending on the weather, it was divided into sunny and cloudy days.
Table1 Description of the maize dataset (a. Composition of the training and validation sets) |
| Year | Number of images | ||
|---|---|---|---|
| Train | Validation | Total | |
| 2023 | 2 397 | 1 026 | 3 423 |
b. Composition of the test sets |
| Year | Dataset | Dimensions | Number of images | |
|---|---|---|---|---|
| Test | Total | |||
| 2024 | Maize tasseling stage | Early tasseling | 288 | 944 |
| Partical tasseling | 303 | |||
| Full tasseling | 353 | |||
| Variety | DN279 | 223 | ||
| DN285 | 261 | |||
| AB368 | 212 | |||
| QS370 | 248 | |||
| Height | 5 m | 478 | ||
| 10 m | 466 | |||
| Weather | Sunny | 465 | ||
| Cloudy | 479 | |||
1.2 Construction of the LightTassel-YOLO model
The YOLO series of algorithms was first introduced by Redmon et al.[19] in 2016. Compared to two-stage object detection algorithms (such as the R-CNN series), YOLO performs single-stage object detection based on regression by simultaneously determining object bounding boxes and their classes through an end-to-end network. This approach improves both detection speed and accuracy. With ongoing development and technological iterations, the YOLO series had evolved to its eleventh generation by October 2024, YOLOv11[20] Considering a balance between accuracy and model complexity, YOLOv11n was selected as the baseline model for this study. Based on this, a field maize tassel detection method named LightTassel-YOLO was proposed, as illustrated in Fig.3. The improvements introduced are as follows.
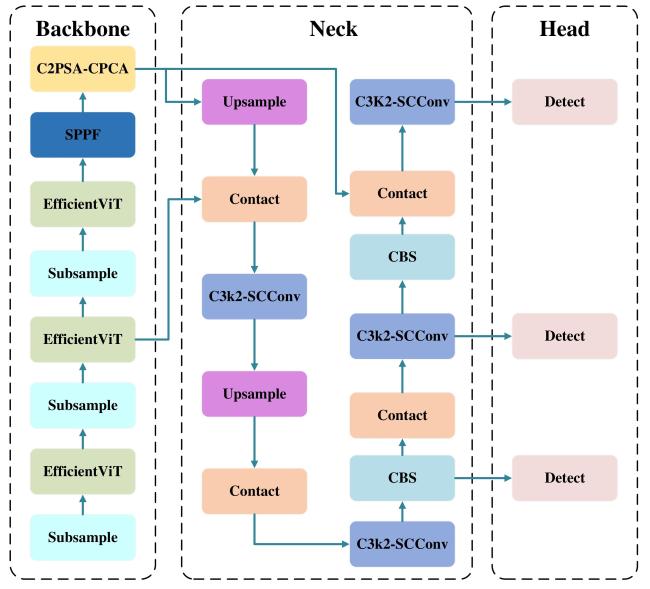
Fig. 3 Architecture of LightTassel-YOLO model |
The Transformer-based EfficientViT module was applied to the backbone network to enhance the model's ability to perceive information from multi-scale features. While maintaining efficient real-time inference, the innovative architectural design enables improved detection accuracy even with a moderately reduced feature extraction depth. A channel-prioritized convolutional attention module, C2PSA-CPCA (Convolutional block with Parallel Spatial Attention and Channel prior convolutional attention), was designed to enhance the representation of small objects with subtle early-stage tassel features. By employing depthwise convolutions to capture spatial relationships among features, the module dynamically allocates attention weights across both channel and spatial dimensions. The C3k2-SCConv module was constructed based on SCConv to optimize feature representation by capturing channel relationships and semantic information across feature maps. This approach reduced the spatial and channel redundancy commonly present in standard convolutions, achieved improved performance while lowering computational load, and further enhanced the model's lightweight design.
1.2.1 EfficientViT feature extraction network
The traditional backbone network structure has limitations in processing cross-scale information and struggles to accurately capture the global features of maize tassels. To address these issues, Cai et al.[21] proposed an efficient vision transformer (EfficientViT) network, as shown in Fig. 4a. The core building block of this network is shown in Fig.4b, consisting of the mobile inverted bottleneck convolution (MBConv) module and the Lightweight multi-scale attention (MSA)[22] module, as depicted in Fig. 4c.
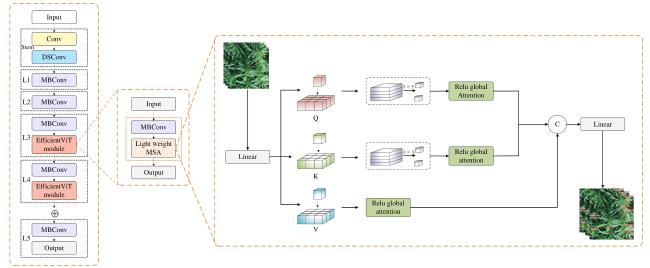
Fig. 4 EfficientViT model architecturea. EfficientViT network b. Core building block c. Light weight MSA module |
In this model, the feature maps progressively decreased in size while the number of channels increased. The MSA module was used to capture contextual information, while the MBConv module enhanced gradient propagation characteristics to better capture local features[23]. Additionally, the network was designed with six versions of varying sizes (M0~M5) to meet different efficiency constraints. Given that this study required real-time maize tassel detection and considering the potential future deployment on edge devices, the backbone of YOLOv11 was replaced with the smallest EfficientViT_M0.
1.2.2 Channel prioritized convolutional attention
In field maize tassel images, due to the uncontrollable lighting conditions during data collection, maize tassels may exhibit varying degrees of reflection in RGB images, making feature extraction relatively challenging. Although embedding attention mechanisms could help the model focusing more on regions of interest, common attention mechanisms typically measure and extract effective information from feature maps only from either the channel or spatial dimension, often neglecting the positional information within the feature maps. The CPCA mechanism achieved a dynamic distribution of attention weights across both channel and spatial dimensions, allowing more selective focus on regions with luminance features. This improved the accuracy and robustness of tassel detection[24]. The structure of the CPCA module is shown in Fig. 5.
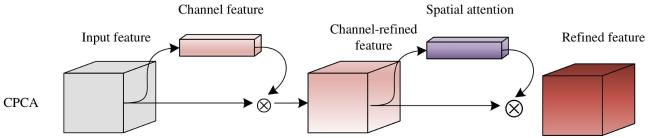
Fig. 5 Structure of CPCA |
The CPCA module mainly consists of two parts, the channel attention (CA) module and the spatial attention (SA) module. represents the input intermediate feature map. The channel attention module was first applied to generate a one-dimensional channel attention map . The channel attention map was element-wise multiplied with the input feature map , and then the channel attention values were propagated along the spatial dimension to obtain the channel attention feature map , as shown in Equation (1) . The SA processed to generate a three-dimensional spatial attention map .The final output feature map is obtained by element-wise multiplying and as shown in Equation (2) , and represents element-wise multiplication.
The CPCA uses the method proposed in the convolutional block attention module (CBAM)[25] module, where spatial information of the feature map was aggregated through average pooling and max pooling operations. The two independent spatial context descriptors generated during the aggregation process were then sent into a shared multi-layer perceptron (MLP). After element-wise summation, the shared MLP was combined to generate the channel attention map. The computation of CPCA can be summarized in Equation (3) , where sigmoid represents the sigmoid activation function.
The generation of the spatial attention map was achieved by extracting spatial relationships between features, using a multi-scale structure to enhance the convolution operation's ability to discern spatial relationships. In particular, a 1×1 convolution operation was used at the end of the spatial attention module to integrate the channels, thereby generating a more refined attention map. The computation of CPCA spatial attention is shown in Equation (4) , where DwConv represents depthwise convolution, , where ,represents the i-th branch, while represents the identity connection.
1.2.3 SCConv convolutional module
The ScConv[26] structure is shown in Fig. 6. This convolution introduces two core components, the spatial reconstruction unit (SRU) and the channel reconstruction unit (CRU). The SRU uses a block-based heterogeneous convolution kernel strategy, decomposing the feature map into multiple spatial blocks and extracting local features in a differentiated manner, which significantly reduced spatial dimension redundancy. The CRU, on the other hand, alleviates channel dimension redundancy by channel splitting and lightweight convolution operations, combined with a feature reuse mechanism to select high-response channels.
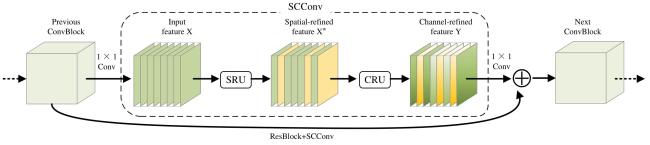
Fig. 6 Structure of SCConv |
Inspired by SCConv's channel rearrangement and mixed feature design that reduces redundant features, an improved structure called C3k2-SCConv based on the SCConv module was proposed. The heterogeneous convolution kernels in SRU enhanced fine-grained texture perception, while the channel rearrangement in CRU suppressed background interference. This structure could accurately focus on target regions in complex farmland scenarios while balancing feature representation capability and computational efficiency.
1.3 Evaluation indexes
To comprehensively evaluate the performance of the LightTassel-YOLO model, the following evaluation metrics were selected: Precision (P), Recall (R), AP@0.5, AP@0.5:0.95, Params (Model Parameters), Giga Floating Point Operations per Second (GFLOPs), and Frames Per Second (FPS). The calculation formulas for P, R, and AP are as Equation (5)~ Equation (7) :
Where, TP (True Positive) represents the number of maize tassels that are actually maize tassels and are predicted as maize tassels by the model; FP (False Positive) represents the number of negative samples that are predicted as maize tassels by the model, false detections. FN (False Negative) represents the number of maize tassels that are actually maize tassels but are predicted as negative samples by the model, missed detections. Since maize tassels have only one class (there are no actual negative samples), there is no case where both the actual sample is negative and the prediction is negative; P represents the proportion of actual maize tassels among the maize tassels predicted by the model. R represents the proportion of actual maize tassels that are predicted as maize tassels by the model. When the intersection over union between the model's predicted box and the ground truth label reaches a set threshold, the sample is considered correctly predicted; AP@0.5 referred to the AP calculated when the intersection over Union threshold was set to 0.5. AP@0.5∶0.95 referred to the average AP calculated over IoU thresholds ranging from 0.5 to 0.95 in steps from 0.05. AP can be directly used to evaluate the model. Higher values indicated better performance. Params represents the size of the model. GFLOPs indicated the number of floating-point operations required during execution. Lower GFLOPs generally imply less computational complexity. FPS, which indicates how many images the model can process per second, was used to evaluate its processing speed. These metrics were collectively used to assess the overall performance of the model.
1.4 Experimental platform and configuration
The experimental platform of this study was the AutoDL online GPU processing platform, with the model being RTX A4000. The processor model was Intel(R) Xeon(R) Silver 4310, the video memory size was 16 GB, and the memory size was 30 GB. The operating system was Ubuntu 20.04, the deep learning framework was PyTorch 2.0.0, the Python version was 3.8, and Cuda 11.8 was used to accelerate training. When training different models, the batch size of each parameter variable was controlled to 16, the images were scaled to 640×640 and then input into the model, and 100 epochs of training were performed uniformly. The initial learning rate, optimizer and other parameters are shown in Table 2.
Table 2 Key parameters settings of maize tassel detection research |
| Parameters | Setup |
|---|---|
| Epochs | 100 |
| Batch size | 16 |
| Learning rate | 0.01 |
| Optimizer | AdamW |
| Number of workers | 8 |
| Image size | 640 × 640 |
2 Results and discussion
Compared with existing object detection architectures, the three modules integrated in this study exhibited remarkable structural advantages and practical application values. Firstly, the EfficientViT module introduced a multi-scale lightweight attention mechanism, which effectively improved the model's perception accuracy while significantly compressing the parameter scale, adapting to agricultural scenarios with high requirements for real-time performance and model size. Secondly, the C2PSA-CPCA module integrated attention allocation strategies in channel and spatial dimensions, significantly enhancing the model's perception ability for early tiny targets of maize tassels and maintaining good stability and generalization ability under complex lighting and background interference conditions. Finally, the C3k2-SCConv module suppressed feature redundancy through spatial reconstruction and channel rearrangement mechanisms, significantly reducing the model's computational load, which was one of the key designs to promote efficient deployment of the model on edge devices. This chapter will be unfolded from the following six sections to systematically demonstrate the design of the above modules between model performance and resource efficiency, and conduct a detailed analysis combined with experimental results.
2.1 Comparison with different feature extraction networks
This study compared the effects of improving YOLOv11n using different feature extraction networks, including StarNet[27], VanillaNet[28], MobileNetV4[29], ShuffleNetv2[30], RepViT[31], and EfficientViT. The comparison results are shown in Table 3. The experimental results demonstrated that the EfficientViT architecture exhibited a significant overall advantage, achieving P, R, AP@0.5, and AP@0.5:0.95 scores of 91.5%, 87.9%, 93.8%, and 56.2%, respectively, ranking first among the evaluated models in detection accuracy. It was worth noting that although RepViT outperforms StarNet (54.3%), MobileNet V4 (53.2%), and ShuffleNetv2 (54.6%) in the AP@0.5:0.95 metric (55.5%), this improvement came with a substantial increase in parameter size and computational cost, resulting in a 19.9% decrease in FPS compared to EfficientViT. In contrast, the model integrated with EfficientViT maintains higher detection accuracy while reducing parameters by 42.2% and computational load by 61.0% compared to RepViT, along with a 24.9% increase in inference speed. Additionally, the lightweight ShuffleNetv2 network stands out in efficiency, reaching an FPS of 123.3, but its AP@0.5:0.95 was 1.6 percentage points lower than that of EfficientViT. Overall, the analysis indicated that EfficientViT, as the feature extraction backbone for YOLOv11n, achieved an optimal balance among detection accuracy, model complexity, and real-time performance, effectively reconciling detection performance with lightweight requirements.
Table 3 Comparison of experimental results for YOLOv11n models improved with different feature extraction networks |
| Model | P/% | R/% | AP@0.5/% | AP@0.5:0.95/% | Params/M | FPS | GFLOPs |
|---|---|---|---|---|---|---|---|
| YOLOv11n+ StarNet | 91.1 | 86.8 | 93.5 | 54.3 | 2.64 | 179.5 | 5.2 |
| YOLOv11n+ VanillaNet | 90.9 | 85.7 | 93.1 | 53.3 | 3.69 | 101.2 | 6.2 |
| YOLOv11n+MoblieNetV4 | 91.2 | 85.2 | 92.7 | 53.2 | 3.84 | 112.4 | 7.2 |
| YOLOv11n+ ShuffleNetv2 | 91.3 | 85.8 | 93.4 | 54.6 | 2.48 | 123.3 | 5.9 |
| YOLOv11n+ RepViT | 91.1 | 87.6 | 93.9 | 55.5 | 6.16 | 131.2 | 17.7 |
| YOLOv11n+ EfficientViT | 91.5 | 87.9 | 93.8 | 56.2 | 3.56 | 163.9 | 6.9 |
2.2 Comparison with different EfficientViT variants
In this experiment, the YOLOv11n backbone was replaced with six variants of EfficientViT (M0-M5) to systematically evaluate the model's performance in maize tassel detection. As shown in Table 4, with the increase in model size from M0 to M5, both the number of parameters and computational complexity surged significantly, while the FPS exhibited a clear downward trend, and the improvement in P showed diminishing returns. In terms of P, M4 achieved the highest precision at 92.3%, but its AP@0.5:0.95 was only 56%, slightly lower than M0's 56.2%. Although M5 achieved the best AP@0.5:0.95 at 56.5%, this was only a 0.3 percentage point improvement over M0, while incurring substantially higher parameters and GFLOPs. Overall, M0 demonstrated significant advantages, requiring only 3.56 M parameters and 6.9 GFLOPs, while achieving the highest inference speed of 163.9 FPS. These results indicated that M0 striked the best balance among accuracy, efficiency, and computational cost. Its lightweight characteristics made it more suitable for real-time detection on UAV platforms, validating the rationale for adopting EfficientViT_M0 as the backbone network.
Table 4 Comparison of YOLOv11n models with different EfficientViT varians |
| Model | P/% | AP@0.5/% | AP@0.5:0.95/% | Params/M | FPS | GFLOPs |
|---|---|---|---|---|---|---|
| YOLOv11n+ EfficientViT_M0 | 91.5 | 93.8 | 56.2 | 3.56 | 163.9 | 6.9 |
| YOLOv11n+ EfficientViT_M1 | 92.0 | 94.3 | 55.8 | 4.37 | 152.8 | 12.6 |
| YOLOv11n+ EfficientViT_M2 | 91.8 | 94.1 | 55.5 | 5.58 | 143.2 | 14.7 |
| YOLOv11n+ EfficientViT_M3 | 90.8 | 94.2 | 55.7 | 8.27 | 139.8 | 18.4 |
| YOLOv11n+ EfficientViT_M4 | 92.3 | 94.2 | 56.0 | 10.17 | 137.6 | 20.5 |
| YOLOv11n+ EfficientViT_M5 | 91.4 | 94.3 | 56.5 | 13.85 | 122.4 | 33.0 |
2.3 Ablation experiments
To validate the effectiveness of each improvement in LightTassel-YOLO, ablation experiments was conducted using YOLOv11n as the baseline model, with all training processes following the same parameter settings. The experiments were carried out on a self-constructed maize tassel dataset, and the performance metrics of each module were evaluated on the test set. The experimental results are shown in Table 5.
Table 5 Ablation experiment results of LightTassel-YOLO model |
| Baseline model | Models | EfficientViT | C2PSA-CPCA | C3k2-SCConv | P/% | R/% | AP@0.5/% | Params/M | GFLOPs | FPS |
|---|---|---|---|---|---|---|---|---|---|---|
| YOLOv11n | Model 1 | × | × | × | 90.1 | 85.3 | 90.7 | 2.43 | 6.3 | 124.9 |
| Model 2 | √ | × | × | 91.5 | 87.9 | 93.8 | 3.56 | 6.9 | 163.9 | |
| Model 3 | × | √ | × | 90.8 | 86.7 | 93.3 | 2.43 | 6.3 | 239.2 | |
| Model 4 | × | × | √ | 90.7 | 86.8 | 93.2 | 2.11 | 5.4 | 226.3 | |
| Model 5 | √ | √ | × | 92.2 | 87.9 | 94.1 | 3.56 | 6.9 | 238.5 | |
| Model 6 | √ | × | √ | 92.1 | 88.4 | 94.4 | 3.15 | 6.7 | 190.8 | |
| Model 7 | × | √ | √ | 91.8 | 87.6 | 93.9 | 2.26 | 5.4 | 285.6 | |
| LightTassel-YOLO | √ | √ | √ | 92.6 | 89.1 | 94.7 | 3.23 | 6.7 | 226.9 |
|
The experimental results showed that using EfficientViT alone to optimize the backbone, compared to the baseline model, increased the number of parameters and computational cost by 1.13 M and 0.6 GFLOPs, respectively. However, P, R, and AP@0.5 improved by 1.4, 2.6, and 3.1 percentage points. Because of the EfficientViT module, based on the Transformer architecture, extracted multi-scale global features by concatenating features from different scales along the head dimension, which were then fused through a linear projection layer, leading to a slight increase in parameters and computation. With EfficientViT applied to the YOLOv11 model, the FPS increased from the baseline model's 124.9 to 163.9, demonstrating that EfficientViT as a feature extractor could maintain efficient real-time inference while improving detection accuracy. Adding only the CPCA attention mechanism to the baseline model, while keeping the number of parameters and computational cost unchanged, resulted in an increase of 0.7, 1.4, and 2.6 percentage points in P, R, and AP@0.5, respectively. This validated the enhancement effect of the channel-prioritized strategy on the model's ability to perceive critical regions. Further analysis of the C3k2-SCConv module showed that this structure reduced parameters by 0.32 M and computational cost by 0.9 GFLOPs, while improving P, R, and AP@0.5 by 0.6, 1.5, and 2.5 percentage points, respectively, with a significant increase in the number of images processed per second. This improvement was attributed to its cross-channel semantic interaction mechanism, which significantly enhanced feature representation while reducing computational load. Notably, the modules exhibited nonlinear synergistic gains. When EfficientViT and C2PSA-CPCA were applied together, AP@0.5 reached 94.1%, with 3.4 percentage point improvement over the baseline. The fully integrated LightTassel-YOLO model, combining all three improvements, achieved 3.23 M parameters and 6.7 GFLOPs computation, with P, R, and AP@0.5 improved by 2.5, 3.8, and 4.0 percentage points over the baseline, while the FPS increased to 226.9. These results indicated that the deep coupling of EfficientViT's global feature extraction, C2PSA-CPCA's attention focus, and C3k2-SCConv's lightweight optimization achieved an optimal balance of detection accuracy and inference speed under limited computational resources. This provided a high-performance and lightweight solution for real-time maize tassel detection in complex field scenarios.
2.4 Analysis of the LightTassel-YOLO training process
During the training process of the LightTassel-YOLO model, dynamic response curves were plotted based on performance metrics on the validation set, including P, R, AP@0.5, and AP@0.5:0.95, as shown in Fig. 7. The experimental data indicated that all evaluation metrics exhibited a rapid upward trend during the initial training phase, with a smooth convergence process and no significant fluctuations. After approximately 40 epochs, all metrics had reached a stable convergence state. The final model achieved a P of 92.6%, R of 89.1%, AP@0.5 of 94.7%, and AP@0.5:0.95 of 56.7%.
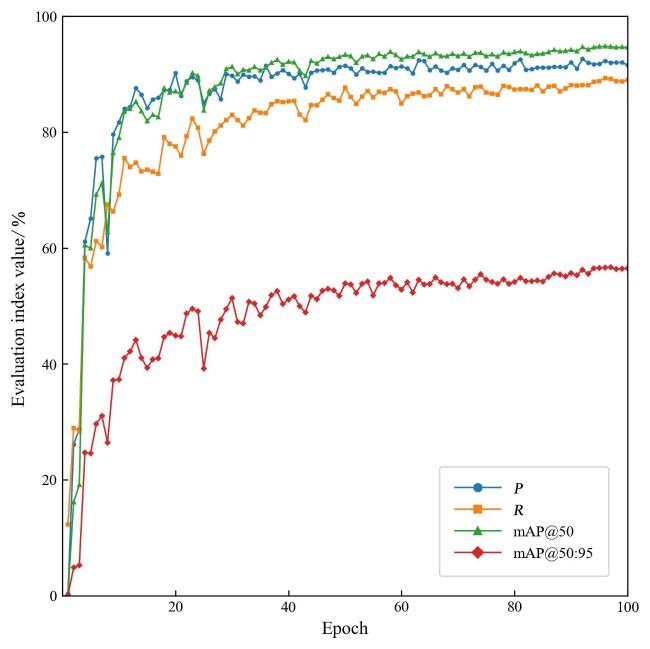
Fig. 7 Model training performance of LightTassel-YOLO |
2.5 Comparison with mainstream object detection models
To further evaluate the overall performance of LightTassel-YOLO, a comparative study was conducted against several mainstream models, including the two-stage detection framework Faster R-CNN, the single-stage detector SSD, and various versions of the YOLO series (YOLOv5, YOLOv7, YOLOv8, YOLOv10, and YOLOv11). The experimental results are presented in Table 6.
Table 6 Comparison between LightTassel-YOLO and mainstream object detection models |
| Models | P/% | R/% | AP@0.5/% | Params/M | GFLOPs |
|---|---|---|---|---|---|
| Faster R-CNN+ResNet50 | 85.4 | 83.7 | 86.5 | 41.35 | 93.6 |
| SSD+ResNet50 | 79.1 | 75.3 | 82.3 | 27.39 | 30.6 |
| YOLOv5s | 90.0 | 86.3 | 90.5 | 7.03 | 15.8 |
| YOLOv7-tiny | 88.4 | 84.3 | 90.0 | 6.40 | 13.2 |
| YOLOv8n | 89.9 | 86.7 | 92.5 | 3.01 | 8.1 |
| YOLOv10n | 89.0 | 84.6 | 91.1 | 2.76 | 8.2 |
| YOLOv11n | 90.1 | 85.3 | 90.7 | 2.43 | 6.3 |
| LightTassel-YOLO | 92.6 | 89.1 | 94.7 | 3.23 | 6.7 |
The results showed that the proposed field maize tassel detection model, LightTassel-YOLO, performs excellently in terms of P, R, and AP@0.5, achieving 92.6%, 89.1%, and 94.7%, respectively. Compared with traditional two-stage network Faster R-CNN and one-stage network SSD, LightTassel-YOLO demonstrates significant improvements across all evaluation metrics. Specifically, compared to YOLOv5s, LightTassel-YOLO achieved 2.6, 2.8, and 4.2 percentage points higher in P, R, and AP@0.5, respectively, while reducing parameter count and computation by 3.8 M and 9.1 GFLOPs. In comparison with previous YOLO models, LightTassel-YOLO outperforms YOLOv7-tiny, YOLOv8n, YOLOv10n, and YOLOv11n in P by 4.2, 2.7, 3.6, and 2.5 percentage points, respectively, in R by 4.8, 2.4, 4.5, and 3.8 percentage points, and in AP@0.5 by 4.7, 2.2, 3.6, and 4.0 percentage points, respectively. Overall, these results highlighted the superior performance of LightTassel-YOLO in maize tassel detection tasks, especially under resource-constrained scenarios.
Fig. 8 illustrates the visualization of detection results from various models, where red boxes indicate correctly detected maize tassels and yellow boxes represent missed detections. As shown in Fig. 8a, the Faster R-CNN model achieved relatively comprehensive detection and can identify most tassels. However, it still exhibited missed detections and duplicate detections, especially around the edges of images, indicating insufficient edge feature extraction capability. The SSD model showed a particularly severe issue with missed detections, with a notably higher number of yellow boxes, especially struggling to detect tassels in edge regions, as seen in Fig. 8b. This reflected its poorer adaptability to complex background environments. In contrast, the YOLO series models (YOLOv5s, YOLOv7-tiny, YOLOv8n, YOLOv10n, YOLOv11n) demonstrated generally better detection performance, accurately recognizing most tassel targets. The red boxes were dense and mostly complete, though a few missed detections remained, particularly in areas with occlusion or strong light reflections. This declin in detection accuracy was likely due to environmental factors such as lighting reflections, occlusions, and resolution limitations in field conditions, which made feature extraction challenging and affected the precision of individual tassel bounding boxes. Among all, the LightTassel-YOLO model performed the best. As shown in Fig. 8h, it detected the highest number of tassel targets, effectively reducing missed detections in complex environments and showcasing stronger feature extraction and detection capabilities.
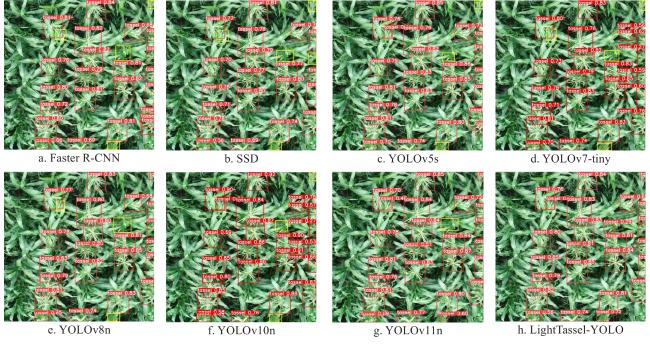
Fig. 8 Performance of different target detection models in the detection of maize tassel study |
2.6 Robustness analysis of the model
In this section, the robustness of the LightTassel-YOLO model was evaluated in the task of maize tassel detection.To further analyze the model's performance, Table 7 presents the test results of LightTassel-YOLO on datasets collected under varying tasseling stages, maize varieties, image acquisition height, and weather conditions.
Table 7 LightTassel-YOLO test results of different maize tassel test sets |
| Dataset | Dataset dimensions | P/% | R/% | AP@0.5/% | AP@0.5:0.95/% |
|---|---|---|---|---|---|
| Period | Early tasseling | 88.4 | 79.1 | 89.0 | 50.4 |
| Partial tasseling | 90.8 | 84.0 | 91.0 | 52.7 | |
| Full tasseling | 91.9 | 88.9 | 93.5 | 57.2 | |
| Height | 5 m | 91.4 | 87.7 | 93.6 | 53.3 |
| 10 m | 90.4 | 86.0 | 91.6 | 52.7 | |
| Weather | Sunny | 89.6 | 86.7 | 91.2 | 53.9 |
| Cloudy | 91.9 | 90.8 | 94.5 | 57.2 | |
| Variety | DN279 | 91.9 | 88.0 | 93.6 | 56.5 |
| DN285 | 90.3 | 84.3 | 91.4 | 54.9 | |
| AB368 | 84.8 | 82.1 | 86.6 | 52.7 | |
| QS370 | 85.3 | 83.0 | 87.9 | 53.4 |
The results showed that detection performed best at the full flowering stage (P = 91.9%, R = 88.9%, AP@0.5 = 93.5%, AP@0.5:0.95 = 57.2%), followed by the partial tasseling stage, while the early tasseling stage achieved the lowest accuracy (P = 88.4%, R = 79.1%, AP@0.5 = 89.0%, AP@0.5:0.95 = 50.4%). The phenotypic differences of maize tassels at various growth stages led to these detection disparities, as shown in Fig. 9a. Because during early tasseling, the tassels were relatively small, and after processing the UAV images, the model's feature extraction ability was limited, resulting in poorer detection performance. As the tassels develop and fully flower, their color and phenotypic features became more prominent, which facilitated better detection by the model. The detection performance on the 5 m altitude test set was better than that on the 10 m test set, with P, R, AP@0.5, and AP@0.5:0.95 higher by 1.0, 1.7, 2.0, and 0.6 percentage points, respectively. Fig. 9b suggests that this may be due to image resolution decreasing as the UAV collection height increases, causing tassel features to be less distinct and thereby reducing detection accuracy. Detection under cloudy conditions outperformed sunny conditions. As shown in Fig. 9c, strong natural sunlight on sunny days caused severe reflections on maize leaves, resulting in overexposed images and blurred boundaries between tassels and leaves, making it difficult to distinguish tassels. Under cloudy conditions, the overall image was darker, and the tassels and leaves reflected light differently, making it easier for the model to distinguish tassels from the complex background. Thus, cloudy weather was more conducive to detection. Among different varieties, DN279 achieved the best detection results (P = 91.9%, R = 88.0%, AP@0.5 = 93.6%, AP@0.5:0.95 = 56.5%), followed by DN285, while AB368 performed relatively worse (P = 84.8%, R = 82.1%, AP@0.5 = 86.6%, AP@0.5:0.95 = 52.7%). This likely stemmed from DN279 and DN285 being part of the training dataset of the LightTassel-YOLO model, enabling stronger feature extraction capabilities for these varieties. In contrast, AB368 and QS370 were not included in training and were only used for testing, thus showing more significant phenotypic differences and lower detection performance. Additionally, Fig. 9d illustrated that DN279 tassels were more concentrated, morphologically clear, and had deeper coloration that contrasts distinctly with surrounding leaves, allowing the model to more accurately identify tassel locations and boundaries. This variety demonstrated strong robustness and precision during detection. DN285's tassels had a more branched and slender morphology, with denser leaved causing some occlusions between tassels and between tassels and leaves; however, the model still accurately detected most occluded tassels. AB368 showed relatively weaker detection results due to its slender tassel branches and low color contrast with leaves, which reduced the model's discrimination capability. Some tassels had complex shapes that increased detection difficulty, resulting in generally lower accuracy. QS370's detection results fall between DN285 and AB368. Its tassels were more scattered with weaker features, leading to lower confidence scores for some targets. Furthermore, the thin branches were more easily occluded by the complex background, affecting detection completeness. Overall, these findings indicated that the morphological traits of maize tassels and background complexity both impact the detection performance of LightTassel-YOLO. Nonetheless, the model still achieved favorable results across diverse test conditions, demonstrating strong robustness and adaptability.
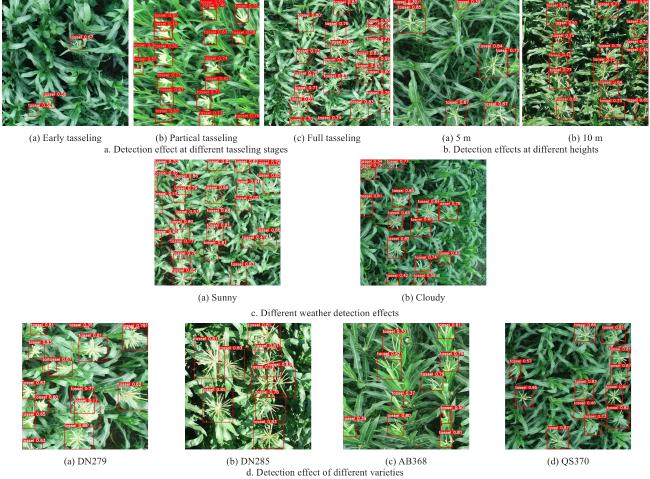
Fig. 9 Detection effect of LightTassel-YOLO on different test sets |
3 Conclusions
Among the growth stages of maize, the tasseling stage is crucial. Accurate tassel detection is essential for detasseling operations. However, existing methods lack sufficient feature extraction capabilities, resulting in unsatisfactory detection performance. Even when deployed on detasseling UAVs, manual intervention is often required. To address this, the LightTassel-YOLO, a maize tassel detection algorithm based on YOLOv11n was proposed in this research. Using UAV-acquired aerial images from 2023 and 2024, a large, high-quality dataset was built, covering various tasseling stages, maize varieties, flight altitudes, and weather conditions. Key improvements include integrating EfficientViT into the backbone for enhanced multi-scale feature perception while maintaining real-time efficiency, designing the channel-priority convolutional attention module C2PSA-CPCA to capture spatial relations and reduce computation, and employing the C3k2-SCConv module with channel reordering to reduce redundant features and meet low-cost embedded device requirements. Experiments show that LightTassel-YOLO achieves P of 92.6%, R of 89.1%, and AP@0.5 of 94.7%, outperforming classic models such as YOLO series, Faster R-CNN, and SSD. It effectively detects tassels under various conditions, while ensuring high-precision identification of maize tassels, the model effectively reduces parameter count and computational load with strong robustness, making it suitable for deployment on edge devices.
Although this study has achieved promising results and could provide strong support for addressing the contradiction between real-time detection and resource limitations in agricultural production. However, the model still has certain limitations. First, the training data are primarily based on RGB images and do not incorporate multimodal information. This limits the stability of feature extraction for tassels, particularly during early tasseling stages or under complex lighting conditions. In summary, LightTassel-YOLO is not only effective for maize tassel detection but also provides a perceptual foundation for precision detasseling operations. It offers new insights and paradigms for the research and application of agricultural target detection models, with strong potential for broader application and further study. Future work includes expanding the dataset to improve generalization and integrating multispectral data to enhance early maize tassel detection accuracy.


