欢迎您访问《智慧农业(中英文)》官方网站! English

基于Stacking集成学习的地块尺度农作物分布制图

  • 谢文豪 1, 2 ,
  • 张新 , 1, 2 ,
  • 董文 2 ,
  • 郑逸榛 2, 3 ,
  • 程博 1, 2 ,
  • 涂文丽 4 ,
  • 孙凤青 4
展开
  • 1. 兰州交通大学 测绘与地理信息学院,甘肃 兰州 730070,中国
  • 2. 遥感与数字地球全国重点实验室,中国科学院空天信息创新研究院,北京 100101,中国
  • 3. 中国科学院大学,北京 100094,中国
  • 4. 重庆市农业信息中心,重庆 401121,中国
张 新,博士,研究员,研究方向为高分遥感集成及智能分析。E-mail:

谢文豪,硕士研究生,研究方向为遥感数据处理与应用。E-mail:

收稿日期: 2025-08-30

  网络出版日期: 2025-11-03

基金资助

国家重点研发计划项目(2021YFB3901300)

Parcel-Scale Crop Distribution Mapping Based on Stacking Ensemble Learning

  • XIE Wenhao 1, 2 ,
  • ZHANG Xin , 1, 2 ,
  • DONG Wen 2 ,
  • ZHENG Yizhen 2, 3 ,
  • CHENG Bo 1, 2 ,
  • TU Wenli 4 ,
  • SUN Fengqing 4
Expand
  • 1. Faculty of Geomatics, Lanzhou Jiaotong University, Lanzhou 730070, China
  • 2. State Key Laboratory of Remote Sensing and Digital Earth, Aerospace Information Research Institute, Chinese Academy of Sciences, Beijing 100101, China
  • 3. University of Chinese Academy of Sciences, Beijing 100049, China
  • 4. The Center of Agriculture Information of Chongqing, Chongqing 401121, China
ZHANG Xin, E-mail:

XIE Wenhao, E-mail:

Received date: 2025-08-30

  Online published: 2025-11-03

Supported by

National Key R&D Program Project(2021YFB3901300)

Copyright

copyright©2025 by the authors

摘要

【目的/意义】 开展地块尺度的农作物分布制图旨在获取基于农业生产管理单元的作物类型、种植模式及利用状态,为农业生产监测、作物估产、耕地保护及农业资源优化配置提供精准的信息支持。 【方法】 提出了一种融合地块尺度特征提取、特征优选与Stacking集成学习的作物分类方法。首先,根据地块与影像特点进行地块空间约束下的特征提取,构建包含光谱、纹理、植被指数等多维度的地块特征属性数据集;其次,采用轻量级梯度提升机(Light Gradient Boosting Machine, LightGBM)结合递归特征消除(Recursive Feature Elimination, RFE)对于地块级特征集进行特征优选,剔除冗余信息以降低维度并增强特征代表性;最后,用Stacking集成学习框架,以多个子模型的输出作为特征,通过元模型进行最终的预测,从而更充分地利用不同模型对光谱、空间与时间特征的互补表征能力。 【结果和讨论】 融合方法总体精度达到95.66%(Kappa=0.900 6),较单一模型或像素级分类方法提升2~3个百分点;通过地块级特征提取和优选,分类精度得到提升,计算时间也大幅度缩减。 【结论】 该方法能充分挖掘地块特征信息,显著提升预测精度,为精细尺度的资源评估、作物监测等应用提供了可靠的技术支持,推进精准农业的发展。

本文引用格式

谢文豪 , 张新 , 董文 , 郑逸榛 , 程博 , 涂文丽 , 孙凤青 . 基于Stacking集成学习的地块尺度农作物分布制图[J]. 智慧农业, 2025 : 1 -14 . DOI: 10.12133/j.smartag.SA202509003

Abstract

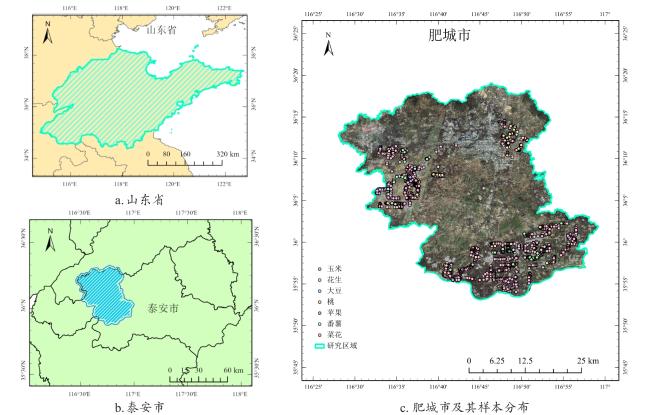
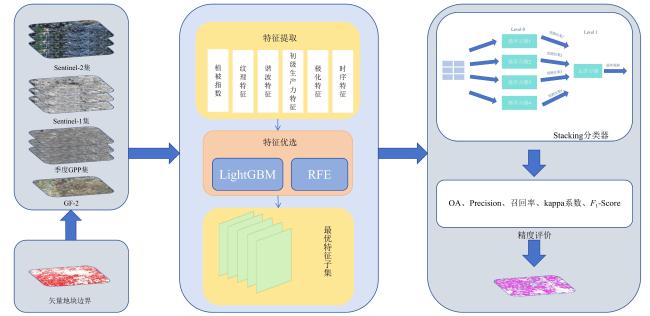
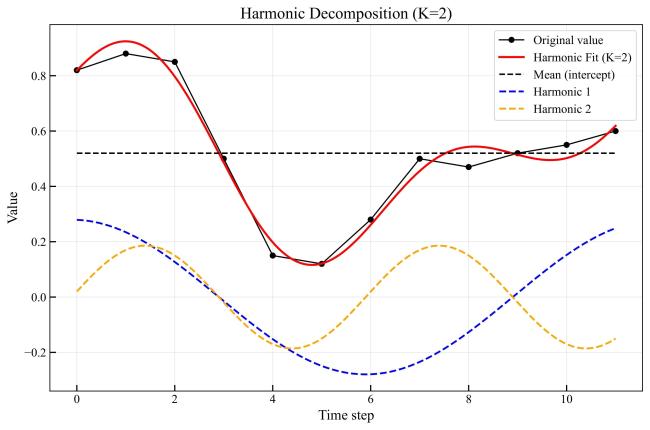
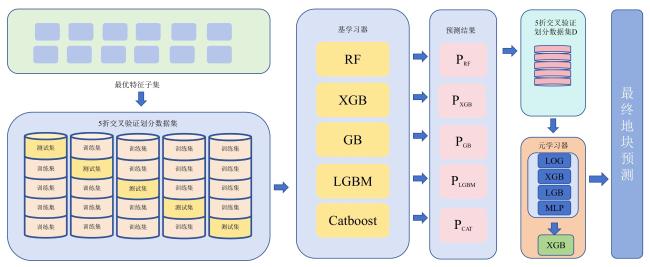
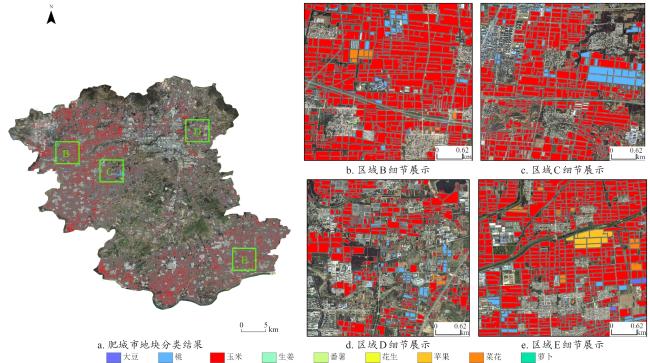
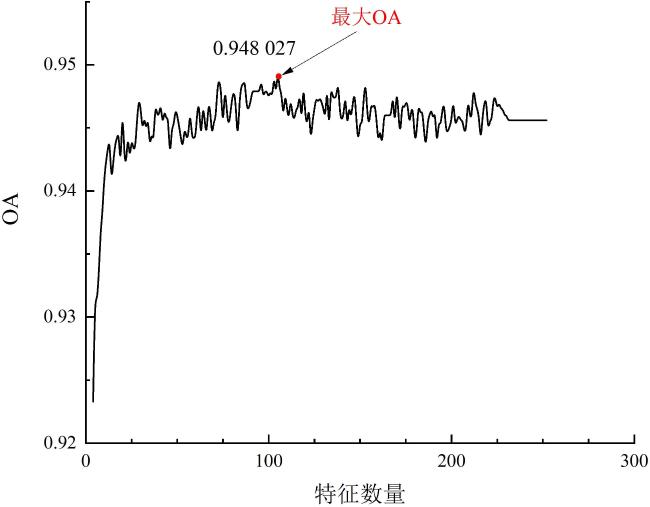
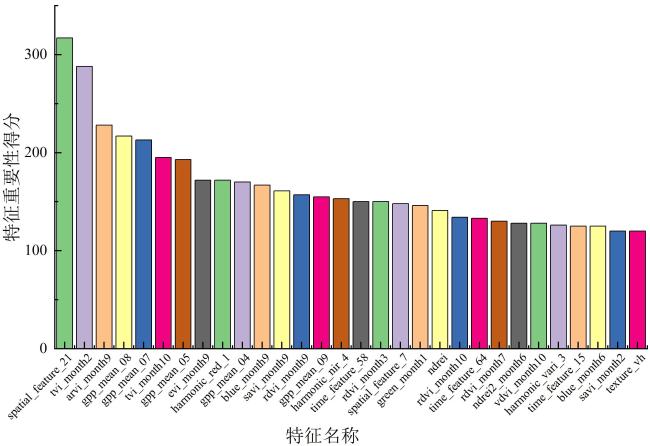
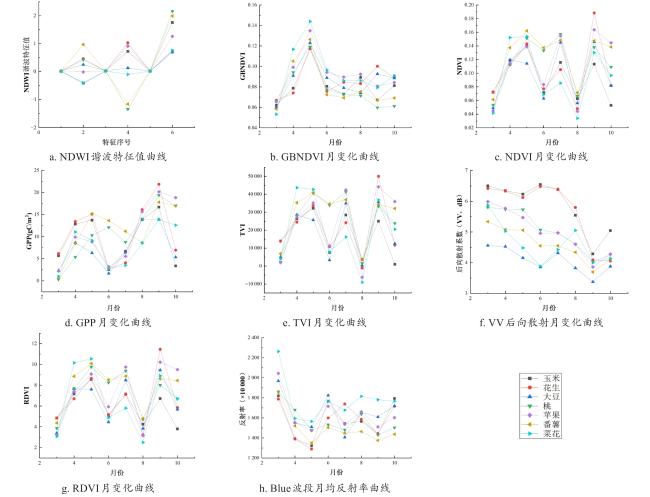
[Objective] With the widespread availability of high-resolution and multi-source remote sensing data, remote sensing-based crop classification has played an increasingly vital role in agricultural monitoring, yield estimation, and land use management. However, traditional pixel-level classification methods often struggle to achieve stable, high-precision classification under conditions of intra-plot heterogeneity, spectral confusion, and noise interference.Therefore, this study aimed to improve parcel-level crop classification accuracy and spatial consistency by constructing a multi-source feature fusion and ensemble learning framework, which exploits complementary spectral, spatial, temporal, and productivity characteristics to enhance robustness and generalization in multi-crop classification tasks. [Methods] To enhance field-level classification accuracy and spatial consistency, this study proposed and validated a crop classification method integrating field-scale feature extraction, feature selection, and Stacking ensemble learning. This approach aimed to fully leverage the complementarity of spectral, spatial, and temporal information through feature engineering and model fusion. The study area was located in Feicheng city, Shandong province. The data included multi-temporal Sentinel-2 optical imagery, Sentinel-1 SAR data, Gaofen remote sensing imagery, and parcel vector samples with crop_type attributes. All imagery underwent radiometric and atmospheric correction, projection registration, and cropping during preprocessing to ensure spatial consistency and temporal correspondence across sensors. The dataset was constructed at the field level, comprising 3 200 fields for model training and independent validation. This study systematically constructed four types of meta-features on the plot scale: First, raw bands and vegetation indices; second, spatial meta-features, including texture, morphology, and structural indicators calculated from high-resolution imagery to reflect internal spatial heterogeneity; third, temporal sequence meta-features, extracting vegetation indices, backscatter, and harmonic/temporal statistics from multi-temporal optical and SAR imagery to characterize crop growth cycles; fourth, crop primary productivity features to highlight differences in carbon fixation and biomass accumulation among crops. Subsequently, for the high-dimensional, multi-source feature set, a combined strategy of LightGBM and recursive feature elimination (RFE) was employed for feature importance assessment and selection. This retained a subset of features most critical to classification, enhancing model generalization and computational efficiency. Within the classification framework, a Stacking-based ensemble learning model was constructed. Base learners included random forest (RF), eXtreme gradient boosting (XGB), support vector machine (SVM), gradient boosting (GB), categorical boosting (CatBoost), adaptive boosting (ADA), back propagation (BP), K-nearest neighbors (KNN), and light gradient boosting machine (LightGBM). These base models learn and represent plot features from distinct perspectives, fully exploring nonlinear relationships among spectral, spatial, and temporal characteristics. During the meta-learner selection phase, to compare the impact of different feature fusion strategies on classification performance, XGBClassifier, LGBMClassifier, MLPClassifier, and LogisticRegression were selected as meta-learners for experimental comparison. By contrasting the classification outcomes of different meta-models under the same base model outputs, their contributions to improving feature fusion accuracy and stability differences were analyzed. During model training, hierarchical cross-validation was employed to mitigate bias caused by class imbalance. Overall accuracy (OA), Kappa coefficient, and F1-Score served as primary evaluation metrics, while recall and precision rates for each crop category underwent systematic analysis. [Results and Discussions] The findings indicated that feature selection significantly impacted classification performance. By integrating LightGBM with feature selection strategies, a subset of 102 optimal features was identified. This subset included gross primary production (GPP), spectral features, vegetation indices, textural features, temporal features, and harmonic features. This approach effectively mitigated feature redundancy and multicollinearity issues, enhancing model stability and generalization capability. Among these, GPP-related features and vegetation indices from key growth stages (e.g., TVI, RDVI, GNDVI) demonstrated high discriminative power in distinguishing crop categories, fully reflecting the close coupling between remote sensing features and crop phenological information. The Stacking ensemble strategy demonstrated outstanding classification performance. Among various meta-learners, the Stacking model with XGBClassifier as the final learner achieved the highest classification accuracy (OA = 95.66%, Kappa = 0.900 6), showcasing exceptional ensemble generalization capability. It performed particularly well in identifying major crops like maize while maintaining good adaptability for less common crops. The method's advantage extended beyond accuracy gains to its comprehensive integration of complementary spectral, temporal, and spatial feature processing capabilities across base learners. The meta-learner adaptively synthesized multi-model outputs, enhancing classification stability and spatial consistency. Compared to traditional pixel-level classification followed by parcel reclassification, direct feature extraction and classification based on vector parcels effectively avoided edge blending and noise interference inherent in pixel-level methods, significantly improving parcel recognition stability and accuracy. Experimental results demonstrated that parcel-level classification outperformed pixel-level strategies in overall accuracy and Kappa coefficient, with superior spatial consistency and robustness in classification outcomes. [Conclusions] The "optimal feature subset + Stacking ensemble learning + parcel-level classification" method developed in this study demonstrates outstanding accuracy and stability in multi-source remote sensing crop identification, providing an efficient and feasible technical pathway for parcel-level classification in complex agricultural landscapes. Future work will integrate high-resolution time-series data with deep learning models to further enhance the method's cross-regional adaptability and crop monitoring capabilities.

0 引 言

农业是国家经济的基础,不仅为其他产业提供原材料促进各行业的发展,还对于社会稳定和经济结构优化起到重要作用1-3。农作物分布数据作为农业应用中的基础信息,是实现精准农业的关键步骤,同时对于优化种植结构、保障粮食安全和辅助农业决策都至关重要4-6。传统的作物种植情况调查主要依赖人工走访,获取作物类型、位置以及耕地属性等信息。这种方法费时费力,且有一定的滞后性,已无法满足现代农业管理对生产信息的需求。自21世纪以来,遥感技术凭借其监测范围广、重访周期短、信息获取快、成本低等优势7, 8,成为获取作物种植信息的重要手段。
随着成像技术的进步,遥感数据的空间、时间和光谱分辨率不断提高,为更精确的作物分类提供了可能。随着遥感技术的快速发展和农业应用需求的不断提升,农作物制图方法也从像元、亚像元9、对象分类方法10发展到地块级分类11,这使得基于管理单元的精细化分类显著推进12, 13。早期研究主要采用基于像元的分类方法,如最大似然分类14、支持向量机15和随机森林16等算法,这些方法具有实现简单、计算量小等优势,但在实际应用中逐渐暴露出诸多局限性。像元分类方法仅依赖单一像元的光谱特征,难以有效利用高分辨率影像中的空间信息,导致分类结果常出现明显的“椒盐噪声”现象17,且对混合像元的处理能力有限18,在复杂种植结构区域容易产生严重的误分类问题。为了解决混合像元问题,亚像元方法利用混合像元分解技术可分析确定遥感图像地物覆盖类型(端元)及其在像元中所占的组分丰度,却无法确定地物类型在混合像元内部的空间分布,实际应用中精度和稳定性都有限。面向对象方法是通过影像分割将同质像元聚合为对象19,并综合光谱、形状、纹理和空间关系等特征。尽管显著改善了“椒盐噪声”,但其分割结果对参数敏感,且对象边界与实际农田边界并不完全一致,存在一定的不确定性。而地块级分类以地块为基本单元20,不仅继承了对象化方法的优势,更能综合利用形状、纹理、大小和空间关系等多维特征21,实现贴合农业生产的精细化分类,因而在作物制图中表现出更高的准确性与应用价值22
在过往的研究中,已有学者对于地块级分类进行了诸多实验取得了不小的进展。杨颖频等23重建归一化植被指数(Normalized Difference Vegetation Index, NDVI)时序提取物候特征,组合多时相光谱特征,构建了基于时空协同的地块尺度作物分类模型。寇雯齐等24提出了一种适用于复杂场景下小农经营区的地块级苹果园模块化制图方法框架。秦肖伟等25提出利用作物物候基于时序数据进行西南山区的地块尺度作物类型识别。Jiao等26利用Google影像与Sentinel-2时序影像,采用长短记忆网络(Long Short-term Memory, LSTM)算法对复杂山区地块尺度的果树进行分类,分类精度可达93%。这些研究表明,地块尺度方法较像元和对象分类在作物识别上具有更强的适用性和更高的精度。但仍然存在一定局限性:一是现有的研究主要是针对NDVI等植被指数构建时序结合作物的物候进行分类,特征维度和信息都很有限;二是对于时序特征的利用多集中在物候阶段,缺乏对于完整时序规律的深度挖掘;三是分类模型单一,难以发挥不同模型的优势互补。所以,在分类精度和模型泛化上仍然有大的提升空间。
综上所述,本研究旨在突破地块尺度时空特征挖掘的技术瓶颈,发展多源遥感协同的地块尺度作物分类方法:1)时序特征构建:以地块为单元,以利用Sentinel-1和Sentinel-2多源遥感影像构建地块尺度的指数特征集,基于谐波与LSTM来提取时序数据中的特征,找到具有区分度的特征,充分捕捉地块的时空变化信息,缓解像素级方法存在的混合像元问题。2)采用Stacking集成模型进行作物分类,利用多模型互补性提升多类别作物识别精度,对小类别和边界像元更加稳定。最终实现地块级作物分布制图,以期为农业监测、作物估产和耕地管理提供精细化信息支持。

1 研究区域与数据

1.1 研究区域

本研究选择了山东省肥城市作为研究区域,其地理位置如图1所示。肥城市位于山东省中部、泰山西麓,北纬35°53′~36°19′,东经116°28′~116°59′,面积1 277.3 km2。北部形成以肥城盆地为特征的康汇平原,南部形成以汶河为特征的汶阳平原,地势相对平坦,地形起伏比较小,有利于农业的发展。肥城市属温暖带大陆性季风气候区,四季分明。春季干旱少雨,夏季炎热多雨,秋季凉爽干燥,冬季寒冷少雪。年平均气温为12~14 ℃,年平均降水量646.9 mm,降水主要集中在夏季。光照资源丰富,降水丰沛,为农作物提供了有利条件。肥城市是传统的农业大县,农业发展历史悠久,区域内主要种植玉米、大豆、番薯等粮食作物,此外还种植苹果、桃等经济作物。
图1 研究区域位置及样本分布图

Fig. 1 Location of the study area and sample distribution map

1.2 光学影像与处理

本研究使用的光学影像数据包括从谷歌地球引擎(Google Earth Engine, GEE)上获取的经过辐射校正和大气校正的Sentinel-2 2A级遥感影像数据产品和从北斗精准可信定位与高分辨率遥感综合集成平台获取高分2影像数据产品。Sentinel-2是欧空局发射的一组二星网络的对地观测卫星,其搭载光谱成像仪(MultiSpectral Instrument, MSI),考虑数据用于农作物分类任务,在进行波段选择时,将作物贡献低的波段B1(主要用于大气校正和水体监测)、B9(主要用于大气校正)和B10(主要用于云检测,不包含植被信息)舍去,保留剩余的波段通过重采样制作成10 m分辨率数据集。考虑到作物的物候和研究区域位置,选取了2023年3月—2023年10月的8景符合条件的影像。
本实验使用预处理和辐射定标的Sentinel-2 2A级数据,通过光能利用率模型进行总初级生产力估算,生成了3—10月逐月总初级生产力的数据集。
高分二号(GF-2)是中国“高分专项”系列卫星之一,主要用于高分辨率遥感成像,广泛应用于农业、林业、国土资源调查和环境监测等领域。GF-2号包含空间分辨率为4 m的蓝、红、绿和近红外多光谱波段和空间分辨率为1 m的全色波段。实验数据选取2023年8月覆盖研究区域的影像,经过辐射定标、大气校正和正射校正、全色和多光谱融合等处理。

1.3 SAR影像与预处理

本研究的合成孔径雷达(Synthetic Aperture Radar, SAR)影像数据是在GEE平台中,按工作模式为干涉宽幅模式(Interferometric Wide Swath, IW),筛选具有垂直发射垂直接收极化(Vertical transmit-Vertical receive,VV)和垂直发射水平接收极化(Vertical Transmit-Horizontal Receive, VH)双极化方式的,经过地形校正和辐射校正的Sentinel-1地面投影检测产品(Ground Range Detected, GRD)数据。Sentinel-1由Sentienl-1A和Sentienl-1B两颗卫星组成,其携带了C波段合成孔径雷达,能提供全天候,全天时对地观测,其分辨率为10 m,重访周期为12 d。结合研究区域实际情况,选取3—10月的影像进行中值合成,得到月中值SAR影像集。

1.4 地块边界与样本数据

本研究的地块边界由深度学习语义分割模型自动提取而得,基于高分辨率遥感影像训练并应用了U-Net++,并结合RCF(Richer Convolutional Features)边缘检测模型提升边界精度,获得覆盖研究区的地块矢量边界,并与哨兵影像在坐标系和投影上保持一致,用于后续地块尺度的特征提取与分类。
本研究的样本点数据结合了野外实地调查和北斗精准可信定位与高分辨率遥感综合集成平台提供的历史作物类型样本点数据。野外调查主要集中在2023年7—9月,通过记录坐标和拍照调查地块种植结构。本研究一共有3 200个样本地块,其详细样本数量分布见表1,70%的样本用作训练分类器,剩下的30%数据作为测试集,用于评估精度。
表1 各作物类型地块样本数量统计

Table 1 Statistics of plot sample numbers for each crop type

样本类型 地块样本数量
玉米 2 198
花生 100
大豆 299
113
苹果 150
番薯 77
菜花 135

2 研究方法

本研究使用了一种基于多尺度特征融合的集成农作物分类模型(图2)。首先,构建了Sentinel-1、Sentinel-2和总初级生产力(Gross Primary Productivity, GPP)27的时间序列数据集;其次,采用Python库的mask进行影像裁剪保留地块内有效像素,进行地块尺度的特征计算,保留贡献度较高的特征作为最优特征子集;再次,将其作为Stacking分类器中基学习器输入得到每个子模型的预测结果,将多个子模型的预测结果再输入元学习器中;最后,对于地块种植结构进行预测。
图2 多尺度特征融合集成农作物分类模型流程图

Fig. 2 Workflow of multi-scale feature fusion ensemble crop classification model

2.1 地块尺度特征提取

由于遥感影像中普遍存在同物异谱和同谱异物的问题,单一的光谱特征往往不足以支撑高精度分类,因此本研究在特征提取环节引入了多源、多维度的特征,以增强作物分类的判别能力。具体而言,利用Sentinel-1数据提取VV和VH极化特征,捕捉不同作物在雷达散射特性上的差异;基于Sentinel-2计算多种植被指数(NDVI、土壤调节植被指数(Soil Adjusted Vegetation Index, SAVI)、绿光归一化植被指数(Green Normalized Difference Vegetation Index, GNDVI)、归一化水体指数(Normalized Difference Water Index, NDWI)、绿蓝归一化植被指数(Green Blue Normalized Difference Vegetation Index, GBNDVI)、可见光抗大气干扰指数(Visible Atmospherically Resistant Index, VARI)、增强型植被指数(Enhanced Vegetation Index, EVI)、变换植被指数(Transformed Vegetation Index, TVI)、大气修正植被指数(Atmospherically Resistant Vegetation Index, ARVI)、可见光波段差异植被指数(Visible-band Difference Vegetation Index, VDVI)、再归一化差值植被指数(Renormalized Difference Vegetation Index, RDVI)等),提取时序特征以体现作物在红光与绿光波段上的显著差异;利用高分二号数据提取纹理特征和空间特征,采用灰度共生矩阵(Gray Level CO-occurrence Matrix, GLCM)计算对比度、相关性、同质性、熵和二阶矩等指标,以量化作物在地块尺度上的结构与空间分布,引入改进深度可分离非对称瓶颈网络(Depthwise Asymmetric Bottleneck Network, DABNet)进行空间特征提取;引入初级生产力(GPP)均值作为生产力特征,其计算基于光能利用率模型,综合考虑光合有效辐射(Photosynthetically Active Radiation, PAR)、植被吸收比例(Fraction of Photosynthetically Active Radiation, FPAR)与光合能效因子(ε),能够反映作物在碳固定与生物量累积方面的差异。不同作物因光合作用能力与物候差异,在季度尺度上呈现显著的GPP差异,平均GPP可有效表征地块的生产力水平。此外,植被指数的时序特征能够系统反映作物在整个生长季节中的动态变化,本研究采用两种方法进行提取:一是基于深度学习的LSTM模型28,从时序曲线中自动学习特征模式;二是基于谐波分析的统计方法29,将时序曲线分解为正弦与余弦分量,谐波特征提取中基频设为8个月,以对应研究区作物3—10月的完整生长季,并采用1~3阶谐波刻画物候变化,如图3所示,从中提取振幅、相位等特征,以刻画作物在返青、抽穗、开花和成熟等关键生育期的差异性。通过上述多源特征的融合,可以有效提升作物分类的区分度和整体精度。
图3 基于时间序列分解的谐波特征提取示意图(K=2)

Fig. 3 Schematic of harmonic feature extraction based on time-series decomposition (K = 2)

基于上述基础,本研究将所有特征计算都投影到地块尺度内。先依据矢量边界进行影像裁剪,提取出各地块内的有效像素,然后在地块范围内分布计算光谱、指数、雷达、纹理等特征,形成最终的地块级特征集(表2)。
表2 地块尺度作物分类中多源遥感特征类型及计算方法

Table 2 Types and calculation methods of multi-source remote sensing features for field-scale crop classification

类别 计算方法
光谱特征 统计地块内各波段均值,标准差等,用波段值计算各植被指数(NDVI、SAVI、GNDVI、NDWI、GBNDVI、VARI、EVI、TVI、ARVI、VDVI、RDVI)
雷达特征 VV、VH极化在地块内的均值、标准差
纹理特征 在地块内计算GLCM的对比度、同质性、相关性、熵和二阶矩,并取均值作为整体表征
生产力特征 地块内的GPP值取月均值,反映作物生物量积累水平
时序特征 基于地块时序曲线进行谐波分解,提取基频、振幅、相位等谐波特征;将地块的多时相曲线输入LSTM,输出学习到的深层时序特征

2.2 特征优选

为提升高维数据建模的效率与泛化能力,本研究采用轻量级梯度提升机(Light Gradient Boosting Machine, LightGBM)30结合递归特征消除(Recursive Feature Elimination, REF)的特征筛选策略31:以LightGBM作为基模型,利用其高效训练能力与基于分裂增益/次数的可靠特征重要性评估,在REF框架中通过“训练模型-评估特征重要性-移除最不重要特征”的递归迭代,该方法一方面利用LightGBM的高效训练与稳定的重要性度量提升了RFE的可操作性与可靠性,另一方面通过迭代式特征筛选有效降低了冗余特征的干扰,从而在保证分类精度的同时优化了模型的计算效率。实验中,LightGBM的主要参数设置为num_leaves=30,num_leaves=30,learning_rate=0.05,n_estimators=500,subsample=0.8;RFE采用5折交叉验证,迭代过程中每轮剔除约5%的低重要性特征,实现了动态筛选出与模型适配的最优特征子集,最终实现模型性能与计算效率的双重优化。

2.3 集成分类模型

集成学习是一种通过结合多个弱学习器来提升整体预测性能的机器学习范式,其核心思想在于利用不同学习器的偏置与方差互补,从而构建出一个更为强大的学习模型。在集成学习框架中,Stacking属于典型的异源集成方法32,它首先利用多个基学习器对原始数据进行训练与预测,然后将各基学习器的输出结果按列堆叠形成新的特征矩阵[若有m个样本和p个基学习器,则矩阵维度为(mp)],再将该矩阵作为输入交由元学习器进一步建模与预测,从而实现性能提升,其框架如图4所示。在本研究中,我们选取了9种具有代表性的模型作为候选基学习器:随机森林(Random Forest, RF)、极端梯度提升(eXtreme Gradient Boosting, XGB)33、支持向量机(Support Vector Machine, SVM)、梯度提升树(Gradient Boosting, GB)34、梯度提升决策树(Categorical boosting, CatBoost)、自适应提升(Adaptive Boosting, ADA)、误差反向传播(Back Propagation, BP)、K近邻(K-nearest Neighbors, KNN)35以及轻量级梯度提升机(LightGBM),这些学习器涵盖了树模型、线性模型与距离度量模型等不同类型,有助于全面捕捉数据特征与模式。为充分发挥各模型的优势,我们采用贝叶斯优化对其超参数进行高效搜索,以获得最优的参数组合并提升预测能力,在后续实验中,我们根据各模型的F 1-macro得分筛选出表现最优的六种模型作为最终基学习器组合。在此基础上,元学习器作为“模型的模型”,通过学习基学习器预测输出之间的关系,能够自适应地融合多模型信息,进一步减少错误,提升整体分类性能。实验过程中,我们对多种常见元学习器进行了对比与验证,并最终选择预测效果最佳的模型作为元学习器,对已有地块样本进行分类预测,并将预测结果赋值为地块的属性字段。
图4 Stacking分类器框架图

Fig. 4 Stacking classifier framework diagram

2.4 精度评价指标

本研究采用基于混淆矩阵的准确性评价指标对作物分类结果进行定量评价,具体的准确性评价指标包括总体精度(Overall Accuracy, OA)、Precision、召回率(Recall)、Kappa系数和F 1-Score。具体计算如公式(1)~公式(5)所示,见表3
表3 精度评价指标与计算方法

Table 3 Precision evaluation indicators and calculation methods

指标名称 计算公式
Overall accuracy(OA) O A = i P i , i i P i + (1)
Precision P r e = P i , i P + i (2)
Recall R e c a l l = P i , i P + i (3)
Kappa系数 K a p p a = N i P - i , i i ( P i + P + i ) N 2 - i ( P i + P + i ) (4)
F 1-Score F 1 = 2 × P r e c i s i o n × R e c a l l P r e c i s i o n + R e c a l l (5)

注:N表示分类类别数;Pii表示真实类别i且被预测为类别i的地块数量;Pi+表示真实类别i的地块总数;P+i表示预测类别i的地块总数。

3 结果与分析

3.1 制图结果分析

通过最优特征子集和Stacking集成分类方法,得到了肥城市地块级分类结果,分类结果整体精度表现较为优异,OA到达了95.66%,Kappa系数达到0.900 6,各类作物均表现出较高的识别精度和分类稳定性。与一些传统的单一模型相比,Stacking在分类精度上更为均衡,有更强的泛化能力和鲁棒性。从分类结果(图5a)能够清晰刻画主要作物的空间分布格局,玉米大豆等大宗作物主要分布在平原,而桃和苹果等经济作物则主要分布在地势较高或者地块较为零碎的区域。在大宗作物种植区(图5b)可以直观地看出大面积连成片的特征,在果树种植区(图5c)集中分布在丘陵,具有典型的斑块特征,使得条状和小片状的地块其种植结构被准确识别,而在村镇周围等地块零碎种植格局复杂的区域(图5d),虽然存在部分地块判别不确定,但整体趋势与实际混合作物种植情况一致。综上所述,本研究提出的方法在整体和局部都表现出高精度和稳定性,能够准确地得到研究区域的作物分布特征,对于大范围农业管理与作物精细化制图有较强的应用价值。
图5 Stacking方法结果细节图

Fig. 5 Detailed view of stacking method results

3.2 最优特征组合分析

本研究一共构建了344个维度的地块尺度特征,然而,由于特征数量较多,盲目叠加特征,容易造成信息冗余甚至引发过拟合,使得分类精度非但不能提升,反而有所下降。通常造成这个现象的原因主要有3方面:其一,部分特征间存在较强相关性,如NDVI与SAVI,二者均源自植被指数且信息高度重叠;其二,某些特征在地块间表现出低差异性,即取值相同或接近,从而难以提供额外区分度。在基学习器训练中,这类特征不仅不能提高模型性能,反而可能成为负相关特征,对最终分类结果产生抑制作用;其三,鉴于高维度特征会大幅提高模型的计算复杂度并显著增加训练成本,对所构建的特征进行优选就显得尤为必要。实验通过分析不同特征数量对模型OA的影响,旨在确定最优特征子集,平衡模型性能与计算复杂度。
通过RFE结合LightGBM算法进行特征筛选,实验结果显示OA随特征数增加呈现“先升后降”的趋势(图6):OA从92.28%上升至94.80%后又下降至93.75%。这一结果说明合理控制特征数量对于提升分类精度和模型效率具有重要意义。最终,本研究构建了包含102个特征的最优子集,涵盖作物初级生产力指标、原始光谱特征、植被指数、谐波特征、时间特征,以及纹理特征等多个维度。
图6 最佳特征子集对分类精度的影响

Fig. 6 Effect of optimal feature subset on classification accuracy

在贡献度排序中,权重较高的特征主要集中在作物初级生产力、谐波特征及部分植被指数上(图7)。例如深度学习特征、8月GPP均值、9月蓝光波段,以及生长关键期的TVI、RDVI、GNDVI等。初级生产总值特征能够反映作物在生长高峰期的碳固定能力,而不同作物的固碳水平存在显著差异,从而为分类提供了较强的区分度。纹理特征则对地块边界及种植结构信息的恢复起到重要作用,能有效区分种植方式差异明显的地块。谐波特征通过傅里叶分解反映作物的周期性生长变化,而基于时序建模的特征则刻画了作物在不同生育阶段的独特时序规律如图8所示。
图7 最佳特征子集各特征的重要特征得分

Fig. 7 Importance scores for features in the optimal feature subset

图8 不同作物多源时序特征变化对比图

Fig. 8 Comparison of multisource temporal features among different crops

综上所述,基于LightGBM的特征重要性分析与RFE的最优特征筛选结果表明,合理的特征组合能够在减少冗余的同时提升可分离性。优化后的102个特征不仅有效刻画了不同作物的光谱、生理和时序特性,还在模型泛化与大尺度映射中表现出较高的鲁棒性和解释性,为后续分类提供了坚实的特征基础。

3.3 最佳基模型组合

在实验中,采用贝叶斯优化对各分类模型的超参数进行高效搜索。具体而言,以交叉验证的OA作为目标函数,通过迭代更新先验分布逐步逼近最优解,从而在较少的搜索次数下获得接近全局最优的参数配置。该方法能够有效避免传统网格搜索和随机搜索在高维参数空间中效率低下的问题,各模型的具体参数如表4所示。
表4 基模型(base learner)各自的参数设置

Table 4 Parameter settings for each base learner

模型 最优参数设置
RF n_estimators=325, max_depth=15, min_samples_split=3, min_samples_leaf=1, random_state=42
XGB n_estimators=254, max_depth=9,learning_rate=0.186, gamma=0.013, min_child_weight=3, subsample=0.95, colsample_bytree=0.645, random_state=10
AdaBoost estimator=DecisionTreeClassifier(max_depth=9), n_estimators=417,learning_rate=0.056 5, algorithm='SAMME', random_state=50
LGBM n_estimators=491, learning_rate=0.060 4, num_leaves=68, max_bin=111, random_state=42
GB n_estimators=252, learning_rate=0.193, max_depth=9, min_samples_split=5, min_samples_leaf=2, subsample=0.8, random_state=42
CatBoost iterations=963, depth=7, learning_rate=0.226, l2_leaf_reg=1.56, random_seed=42, verbose=False
SVM kernel='rbf', C=8.5, gamma=0.064, probability=True, random_state=42
BP hidden_layer_sizes=(294 251), activation='relu', solver='adam', alpha=0.000 42, max_iter=1 000, learning_rate='adaptive', learning_rate_init=0.036, random_state=42
KNN n_neighbors=6, weights='distance'
为构建少而精的基模型组合,在提升模型预测精度的同时有效降低冗余性与过拟合风险,本研究首先对于备选的单个模型展开独立训练,并依据其独立性能进行评估筛选。实验中选取9种主流分类器作为候选模型,采用F 1-macro均值与标准差作为模型性能评估指标,其中F 1-macro均值用于衡量模型在多类别任务中的综合性能,标准差则用于反映模型性能的稳定性,各子模型的结果如表5所示。实验结果显示,不同分类器在该任务中的性能差异显著。CatBoost性能表现最优,F 1-macro均值达0.90以上,稳定性也较好。XGB和随机森林模型表现同样出色,F 1-macro均值接近0.90。相比之下,KNN、AdaBoost,以及传统梯度提升模型性能一般,F 1-macro均值为0.55~0.87。而SVM和BP神经网络在该任务中表现不佳,F 1-macro均值均远低于0.2,说明这两种模型对于多类别数据的判别能力弱,适用性有限。综合以上结果,本研究将优先选择CatBoost、LightGBM、GB、ADA、XGB和RF模型构建基模型组合。
表5 基模型子分类器性能比较表

Table 5 Comparison of base classifier performance

模型名称 F 1-macro均值 标准差
RF 0.890 5 0.018 7
XGB 0.896 6 0.017 3
SVM 0.141 5 0.033 4
GB 0.824 3 0.046 1
KNN 0.556 5 0.036 0
LightGBM 0.906 9 0.009 3
Catboost 0.918 3 0.006 1
BP 0.103 9 0.000 1
ADA 0.866 2 0.029 3

3.4 不同元模型对比

根据REF特征选取进行训练,再结合Stacking算法进行农作物分类,取得了优异的分类性能。为了客观地评估研究中所使用方法的稳定性和性能,以构建的最优特征子集为输入,再引入LGBMClassifier、XGBClassifier、MLPClassifier和LogisticRegression模型,通过优化得到元模型的最佳参数如表6所示,最后来比较它们之间的性能与差异。LGBMClassifier和XGBClassifier为梯度提升树模型,适用于处理高维度、多特征数据;MLPClassifier为多层感知机神经网络,能够捕捉非线性关系;LogisticRegression用于提供基准对比。表7展示了不同元学习器在优选特征下的各农作物的分类准确率。实验结果中,4个不同的元学习器的OA都在90%以上,其中XGBClassifier的OA最大为95.66%,比第二的LGBMClassifier高0.43个百分点;且Kappa系数都在0.8以上。同样,XGBClassifier的Kappa最高为0.900 6。由此可见,XGBClassifier在各个方面表现都优异,其在融合各基学习器特征时具备较强的泛化能力与稳定性,是当前实验中最推荐的元学习器。与之相比较的像素的结果与地块的分类结果存在不小的差异,地块级的OA基本处于95%的水平,而像素则不到94%,相比之下地块级要提升2~3个百分点。由此可见地块级相比于像素级在整体分类精度上占优,但在分类器差异上,4种分类器之间的差别较小。
表6 Stacking集成学习中各元模型的主要超参数设置

Table 6 Key hyperparameter settings of meta-models in the stacking ensemble

元模型 最优参数设置
LGBMClassifier n_estimators=50,learning_rate=0.05,random_state=42
XGBClassifier n_estimators=50,learning_rate=0.05,num_leaves=68,max_bin=111,random_state=42
MLPClassifier hidden_layer_sizes=(100,),activation='relu',solver='adam',learning_rate='adaptive',learning_rate_init=0.036,max_iter=500,random_state=42
LogisticRegression solver='lbfgs',max_iter=1 000,C=1.0,random_state=42
表7 不同分类器在地块级与像素级作物分类任务中的性能比较

Table 7 Performance comparison of different classifiers for parcel-level and pixel-level crop classification

地块分类结果
元学习器 OA/% Kappa
XGBClassifier 95.66 0.900 6
LGBMClassifier 95.23 0.896 6
MLPClassifier 94.90 0.889 3
LogisticRegression 95.12 0.894 4
像素分类结果
XGBClassifier 93.96 0.914 3
LGBMClassifier 93.56 0.911 3
MLPClassifier 93.37 0.906 1
LogisticRegression 92.89 0.901 1
4个实验的混淆矩阵如图9所示,而表8进一步给出了XGBClassifier结果下的各作物类别精度指标(Precision、Recall、F 1-score)用于代表性地分析类别不平衡对分类性能地影响。总体来看,玉米等大类作物在所有实验中均保持较高精度,而花生、大豆等小类作物由于样本数量有限,且与玉米存在光谱相似性,表现出较明显的混淆。例如,花生类别在4个实验中均有11~14个样本被误分为玉米;大豆类别也存在少量误分。这说明小类别的识别精度受到样本不平衡与同谱异物问题的共同影响。尽管地块尺度的特征聚合在一定程度上缓解了这一问题,但提升小类别精度仍是后续工作的重点,可通过增加小类别样本量、数据增强或采用类别加权策略加以改进。
图9 不同元学习器地块尺度作物分类混淆矩阵对比

Fig. 9 Comparison of confusion matrices of different meta-learners for field-scale crop classification

表8 基于XGBClassifier的各作物类别精度指标

Table 8 Class-wise accuracy metrics of XGBClassifier

作物类型 Precision Recall F 1
玉米 0.962 5 0.977 1 0.969 7
大豆 0.942 5 0.872 3 0.906 1
花生 0.906 2 0.966 7 0.935 5
0.903 2 0.933 3 0.918 0
番薯 0.958 3 1.000 0 0.978 7
苹果 0.956 5 0.956 5 0.956 5
菜花 0.888 9 0.744 2 0.810 1

3.5 制图效果分析

为评估模型在像素层面的识别力,并对比像素级与地块级效果,实验用相同特征提取、选取及Stacking集成方法,将分类对象从地块换成像素点,保证其他条件一致,得出像素级分类结果,分类结果细节如图10所示。其中,XGBClassifier表现最佳,OA系数最高,从侧面可以说明XGBClassifier在多类别像素级分类中识别率高、性能良好。
图10 不同方法像素级分类细节图

Fig. 10 Pixel-level classification details for different methods

LGB LOG MLP XGB
将像素分类结果落实到地块上,目前常用的方法是使用众数来判断地块的作物类型,也有使用元特征方法36进行,其本质上都是通过矢量地块的边界约束下,通过预先设置的判别条件,来确定地块的作物结构。使用像素分类结果得到的地块分类结果和地块级分类结果进行比较,本研究面向地块级的方法比像素级的方法高,相同分类方法直接用地块对象的方法最佳,地块级分类细节如图11所示。
图11 不同方法地块级分类细节图

Fig. 11 Detailed map of plot-level classification by different methods

XGB LOG MLP LGB

3.6 地块级与像素级边界分析

为验证地块尺度特征提取的有效性,实验对比了地块级分类方法与基于像素分类结果的聚合方法(众数法、元特征法)在整体及边界区域的性能(表9)。结果显示,地块级方法在OA上明显高于像素聚合方法,例如,XGBClassifier在地块级方法下的OA达到0.956 6,而像素级方法仅为0.936 9。分析表明,像素级方法在边界存在“混合像元”和“同谱异物”问题,而地块级方法通过空间约束和特征聚合,有效缓解了边界像素的不确定性。此外,地块级方法在不同分类器中均表现稳定,但其精度依赖于地块边界提取的准确性,在小地块或高异质区域可能下降。
表9 地块边界区域像素级与地块级分类整体精度比较

Table 9 Comparison of classification overall accuracy at pixel level and plot level in boundary areas

模型 方法
众数法 元特征法 地块对象法
XGBClassifier 0.936 9 0.938 5 0.956 6
LGBMClassifier 0.933 2 0.936 9 0.952 3
MLPClassifier 0.934 7 0.943 5 0.949 0
LogisticRegression 0.932 5 0.944 3 0.951 2

4 结 论

本研究针对遥感多源信息融合背景下的地块级农作物分类问题,系统构建并验证了一套基于最优特征子集与Stacking集成学习的分类方法。实验结果表明:
1)特征选择对分类性能具有显著影响。通过LGBM模型结合特征选择策略,筛选出包含作物初级生产总值、光谱特征、植被指数、纹理特征、时序特征及谐波特征在内的102个最优特征子集,有效抑制了特征间的冗余和多重共线性问题,提升了模型的稳定性与泛化能力。其中,GPP相关特征与关键生长期的植被指数如TVI、RDVI、GNDVI等在区分作物类别中表现出极高的区分能力,充分体现了遥感特征与作物物候信息的紧密耦合。
2)Stacking集成策略展现出优异的分类性能。在多种元学习器对比中,以XGBClassifier为最终学习器的Stacking模型取得了最高的分类精度(OA达95.66%、Kappa达0.900 6),表现出卓越的集成泛化能力,尤其对主栽作物如玉米表现出极强的识别能力,且对数量较少的作物也具备良好的适应性。需要指出的是,Stacking的优势不仅体现在精度提升上,更在于其在实际任务中的必要性:不同基学习器能够在光谱、时序和空间特征的处理上具有互补性,元学习器能够自适应地融合多模型信息,从而有效提升分类结果的稳定性与空间一致性。在地块尺度分类中,Stacking集成方法相较于单一模型具有更高的实用价值与意义。
3)地块级特征提取与分类策略优于像素级路径。相比传统像素级分类后再进行地块重分类的做法,直接基于矢量地块进行特征提取与分类,避免了像素分类过程中的边缘混合与噪声干扰问题,有效提升了地块识别的稳定性与精度。实验证明,地块级路径在OA和Kappa值上均显著优于像素级策略,分类结果更具一致性与鲁棒性。
尽管所提方法在总体上取得了较高精度,但小类别作物(如花生、大豆)仍易受样本数量不均衡与主栽作物光谱相似性影响而出现误分。得益于地块级特征聚合与Stacking集成策略,本方法在一定程度上缓解了类别不均衡带来的偏差:前者通过聚合地块内像素信息,减少了噪声对小类别样本的干扰;后者通过融合多基模型的互补优势,降低了单一模型对大类作物的过拟合倾向,使整体分类结果更稳定。然而,不平衡分布仍导致模型在小类别作物上的召回率偏低,表明在类别不平衡场景下存在改进空间。本研究依赖完整的地块矢量数据且仅在单一区域开展实验,模型跨区域泛化能力仍需进一步验证。未来研究将从小类别样本扩充、类别重加权、数据增强及领域自适应等方向加强对复杂农业景观的适应能力,并引入高分辨率时序遥感与深度学习模型,以进一步提升分类精度与推广价值。
综上所述,本研究提出的“最优特征子集+Stacking集成学习+地块级特征提取”的方法不仅具备较强的分类性能和稳定性,同时兼具较高的计算效率与泛化能力,适用于大尺度农作物分类与种植结构监测任务。未来研究中,可进一步结合高分时序数据与深度学习方法,以提升对复杂农业景观的表征能力和跨区域适应能力。

本研究不存在研究者以及与公开研究成果有关的利益冲突。

[1]
吴志峰, 骆剑承, 孙营伟, 等. 时空协同的精准农业遥感研究[J]. 地球信息科学学报, 2020, 22(4): 731-742.

WU Z F, LUO J C, SUN Y W, et al. Research on precision agricultural based on the spatial-temporal remote sensing collaboration[J]. Journal of geo-information science, 2020, 22(4): 731-742.

[2]
胡琼, 吴文斌, 宋茜, 等. 农作物种植结构遥感提取研究进展[J]. 中国农业科学, 2015, 48(10): 1900-1914.

HU Q, WU W B, SONG Q, et al. Recent progresses in research of crop patterns mapping by using remote sensing[J]. Scientia agricultura sinica, 2015, 48(10): 1900-1914.

[3]
SALMON J M, FRIEDL M A, FROLKING S, et al. Global rain-fed, irrigated, and paddy croplands: A new high resolution map derived from remote sensing, crop inventories and climate data[J]. International journal of applied earth observation and geoinformation, 2015, 38: 321-334.

[4]
YANG C H. Remote sensing and precision agriculture technologies for crop disease detection and management with a practical application example[J]. Engineering, 2020, 6(5): 102-112.

[5]
张冬韵, 吴田军, 李曼嘉, 等. 地块尺度农作物遥感分类及其不确定性分析[J]. 自然资源遥感, 2024, 36(4): 124-134.

ZHANG D Y, WU T J, LI M J, et al. Remote sensing-based classification of crops on a farmland parcel scale and uncertainty analysis[J]. Remote sensing for natural resources, 2024, 36(4): 124-134.

[6]
吴炳方, 张淼, 曾红伟, 等. 大数据时代的农情监测与预警[J]. 遥感学报, 2016, 20(5): 1027-1037.

WU B F, ZHANG M, ZENG H W, et al. Agricultural monitoring and early warning in the era of big data[J]. Journal of remote sensing, 2016, 20(5): 1027-1037.

[7]
WEISS M, JACOB F, DUVEILLER G. Remote sensing for agricultural applications: A meta-review[J]. Remote sensing of environment, 2020, 236: 111402.

[8]
宋茜, 胡琼, 陆苗, 等. 农作物空间分布遥感制图发展方向探讨[J]. 中国农业资源与区划, 2020, 41(6): 57-65.

SONG Q, HU Q, LU M, et al. Prospect of crop mapping[J]. Chinese journal of agricultural resources and regional planning, 2020, 41(6): 57-65.

[9]
冯如意, 王力哲, 曾铁勇. 高光谱遥感图像亚像元信息提取方法综述[J]. 测绘学报, 2023, 52(7): 1187-1201.

FENG R Y, WANG L Z, ZENG T Y. Review of hyperspectral remote sensing image subpixel information extraction[J]. Acta geodaetica et cartographica sinica, 2023, 52(7): 1187-1201.

[10]
BUI C V, VO Q T, VUONG N L. GAN vs. traditional methods: A multi-scale performance evaluation in satellite image classification[C]// 2024 IEEE International Conference on Consumer Electronics-Asia (ICCE-Asia). Piscataway, New Jersey, USA: IEEE, 2024: 1-4.

[11]
GARCÍA REYES R A. Geographic information system and remote sensing for the evaluation of the aptitude of rice lands in the mayarí agroecosystem, holguín[J]. Modern concepts & developments in agronomy, 2022, 11(2). DOI: 10.31031/MCDA.2022.11.000758 .

[12]
LI H, ZHANG C, ZHANG Y, et al. A scale sequence objectbased convolutional neural network(SS-OCNN)for crop classification from fine spatial resolution remotely sensed imagery[J]. International journal of digital earth, 2021, 14(11): 1528-1546.

[13]
ZHANG P, HU S G, LI W D, et al. Improving parcel-level mapping of smallholder crops from VHSR imagery: An ensemble machine-learning-based framework[J]. Remote sensing, 2021, 13(11): ID 2146.

[14]
ERDANAEV E, KAPPAS M, WYSS D. The identification of irrigated crop types using support vector machine, random forest and maximum likelihood classification methods with Sentinel-2 data in 2018: Tashkent province, Uzbekistan[J/OL]. International journal of geoinformatics, 2022, 18(2). [2025-08-20].

[15]
YILMAZ C, GUNGOR O. Improving SVM classification accuracy with image fusion-based gabor texture features[J/OL]. 2020. [2025-08-20].

[16]
RATANOPAD SUWANLEE S, KEAWSOMSEE S, IZQUIERDO-VERDIGUIER E, et al. Mapping sugarcan08e plantations in Northeast Thailand using multi-temporal data from multi-sensors and machine-learning algorithms[J]. Big earth data, 2025, 9(2): 187-216.

[17]
邓刘洋, 沈占锋, 柯映明, 等. 基于地块尺度多时相遥感影像的冬小麦种植面积提取[J]. 农业工程学报, 2018, 34(21): 157-164.

DENG L Y, SHEN Z F, KE Y M, et al. Extraction of winter wheat planting area based on multi-temporal remote sensing images at plot scale[J]. Transactions of the Chinese society of agricultural engineering, 2018, 34(21): 157-164.

[18]
NARIN O G, ABDIKAN S, BAYIK C, et al. Coherence and backscatter based cropland mapping using multi-temporal sentinel-1 with dynamic time warping[J]. The international archives of the photogrammetry, remote sensing and spatial information sciences, 2021, XLIII-B5-2021: 37-41.

[19]
王志华, 杨晓梅, 刘岳明, 等. 遥感影像地学分析的地理学原理及等级斑块建模框架[J]. 遥感学报, 2024, 28(6): 1412-1424.

WANG Z H, YANG X M, LIU Y M, et al. Geographical principle and hierarchical patch modeling framework for geo-analysis of remote sensing images[J]. National remote sensing bulletin, 2024, 28(6): 1412-1424.

[20]
刘巍, 吴志峰, 骆剑承, 等. 深度学习支持下的丘陵山区耕地高分辨率遥感信息分区分层提取方法[J]. 测绘学报, 2021, 50(1): 105-116.

LIU W, WU Z F, LUO J C, et al. High-resolution remote sensing information partition and hierarchical extraction method of cultivated land in hilly and mountainous areas supported by deep learning[J]. Acta geodaetica et cartographica sinica, 2021, 50(1): 105-116.

[21]
骆剑承, 吴田军,吴志峰, 等. 遥感大数据智能计算[M]. 北京: 科学出版社, 2020.

[22]
FENG T, ZHU Y H, CHAI N, et al. Increased grain yield in modern genotypes of spring wheat for dryland cultivation in northwest China is associated with the decreased allocation of carbon to roots[J]. Field crops research, 2023, 303: ID 109114.

[23]
杨颖频, 吴志峰, 骆剑承, 等. 时空协同的地块尺度作物分布遥感提取[J]. 农业工程学报, 2021, 37(7): 166-174.

YANG Y P, WU Z F, LUO J C, et al. Remote sensing extraction of crop distribution at plot scale based on spatio-temporal collaboration[J]. Transactions of the Chinese society of agricultural engineering, 2021, 37(7): 166-174.

[24]
寇雯齐, 沈占锋, 王浩宇, 等. 复杂场景下小农经营区地块级苹果园模块化制图方法框架[J]. 地球信息科学学报, 2024, 26(1): 197-211.

KOU W Q, SHEN Z F, WANG H Y, et al. Modular mapping method framework of plot-level apple orchards in small-scale peasant management areas under complex scenes[J]. Journal of geo-information science, 2024, 26(1): 197-211.

[25]
秦肖伟, 程博, 杨志平, 等. 基于时序遥感影像的西南山区地块尺度作物类型识别[J]. 地球信息科学学报, 2023, 25(3): 654-668.

QIN X W, CHENG B, YANG Z P, et al. Identification of crop types at plot scale in southwest mountainous areas based on time series remote sensing images[J]. Journal of geo-information science, 2023, 25(3): 654-668.

[26]
JIAO S H, HU D X, SHEN Z F, et al. Parcel-level mapping of horticultural crop orchards in complex mountain areas using VHR and time-series images[J]. Remote sensing, 2022, 14(9): ID 2015.

[27]
QU T F, WANG H, LI X B, et al. A fine crop classification model based on multitemporal Sentinel-2 images[J]. International journal of applied earth observation and geoinformation, 2024, 134: ID 104172.

[28]
RUßWURM M, KÖRNER M. Multi-temporal land cover classification with long short-term memory neural networks[J]. The international archives of the photogrammetry, remote sensing and spatial information sciences, 2017, XLII-1/W1: 551-558.

[29]
刘灵, 张加龙, 韩雪莲, 等. 基于GEE和Sentinel时序影像的优势树种识别研究[J]. 森林工程, 2023, 39(1): 63-72, 81.

LIU L, ZHANG J L, HAN X L, et al. Study on identification of dominant tree species based on GEE and sentinel time series images[J]. Forest engineering, 2023, 39(1): 63-72, 81.

[30]
MUSTAFA STÜNER, ABDIKAN S, BILGIN G, et al. Crop classification using light gradient boosting machines[J/OL]. 2020. [2025-08-20].

[31]
冯蕴雯, 崔宇航, 贺谦, 等. 基于ISMA-Stacking集成建模和贝叶斯融合的全机结构试验可靠性评估[J/OL]. 航空学报. (2025-07-28)[2025-08-29].

Feng Y W, Cui Y H, He Q, et al. Reliability assessment of full-scale structural tests based on ISMA-stacking ensemble modeling and bayesian fusion[J/OL]. Acta Aeronautica et Astronautica Sinica. (2025-07-28)[2025-08-29].

[32]
CHEN T Q, GUESTRIN C. XGBoost: A scalable tree boosting system[C]//Proceedings of the 22nd ACM SIGKDD International Conference on Knowledge Discovery and Data Mining. August 13 - 17, 2016, San Francisco, California, USA. ACM, 2016: 785-794.

[33]
HARIYANI G, SINGH A, PATIL P, et al. Analysis on crop yield prediction using various ensemble methods[C]// 2024 8th International Conference on Computing, Communication, Control and Automation (ICCUBEA). Piscataway, New Jersey, USA: IEEE, 2024: 1-6.

[34]
REDDY N V V, MANIMEGALAI T. Predicting the crop yield in agriculture using gradient boosting algorithm in comparison of naive Bayes algorithm[J]. Fifth International Conference on Applied Sciences: ICAS2023, 2024, 3097: ID 020201.

[35]
SIKARWAR S S, PANDEY S, KUMAR S A, et al. Optimizing crop yield predictions using K-nearest neighbors regression: An analysis of temperature, rainfall and soil pH influences[C]// 2024 1st International Conference on Advances in Computing, Communication and Networking (ICAC2N). Piscataway, New Jersey, USA: IEEE, 2025: 1336-1341.

[36]
WANG H Y, WANG J, SHEN Z F, et al. Parcel-level mapping of apple orchard in smallholder agriculture areas based on feature-level fusion of VHR image and time-series images[J]. International journal of remote sensing, 2022, 43(17): 6195-6220.

文章导航

/