Welcome to Smart Agriculture 中文
Topic--Smart Agricultural Technology and Machinery in Hilly and Mountainous Areas

Remote Sensing Extraction Method of Terraced Fields Based on Improved DeepLab v3+

  • ZHANG Jun 1 ,
  • CHEN Yuyan 1 ,
  • QIN Zhenyu 2 ,
  • ZHANG Mengyao 1 ,
  • ZHANG Jun , 1
Expand
  • 1. School of Earth Sciences, Yunnan University, Kunming 650500, China
  • 2. Institute of International Rivers and Eco-security, Yunnan University, Kunming 650500, China
ZHANG Jun, E-mail:

ZHANG Jun, E-mail:

Received date: 2023-12-28

  Online published: 2024-03-06

Supported by

State Administration of Science, Technology and Industry for National Defense Gaofen Special Yunnan Provincial Government Comprehensive Management of Deep Application and Large-Scale Industrialization Demonstration Projects(89-Y50G31-9001-22/23)

Yunnan University Graduate Research Innovation Fund(KC-22222840)

Copyright

copyright©2024 by the authors

Abstract

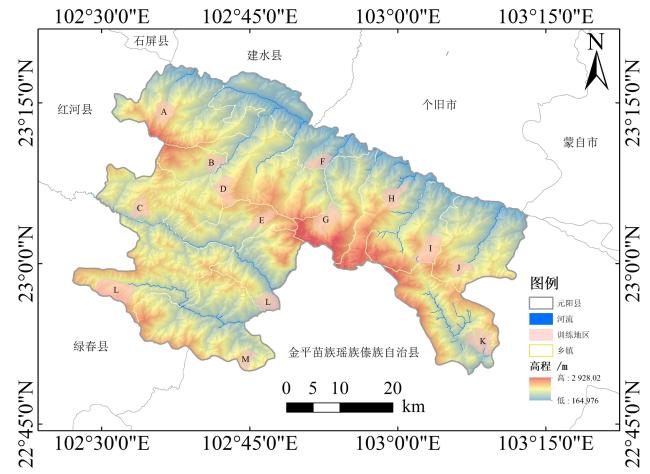
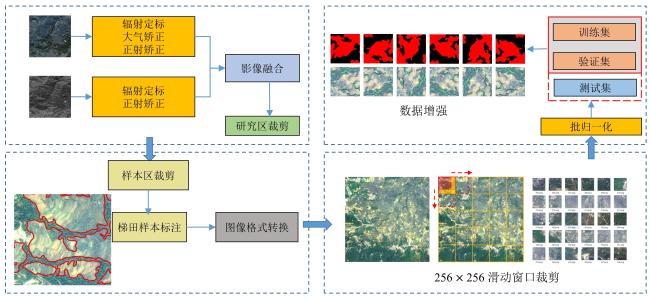
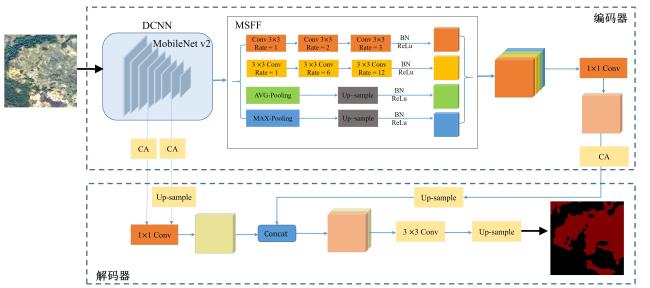
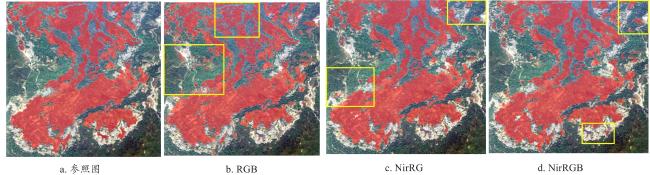
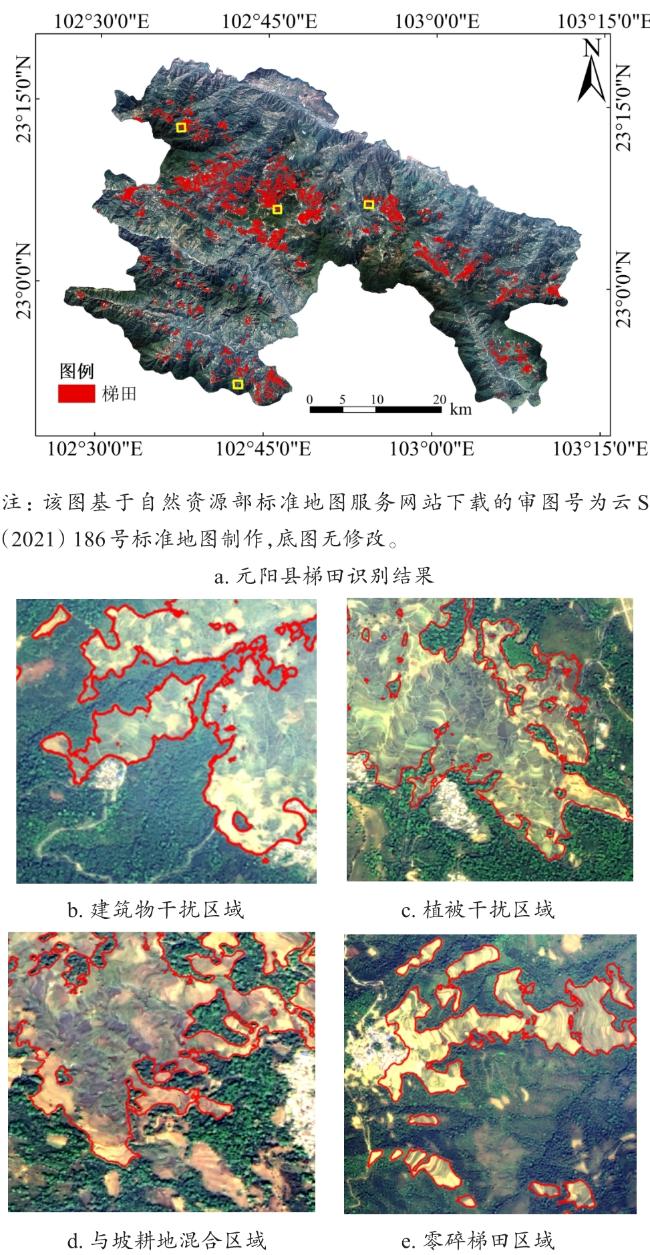
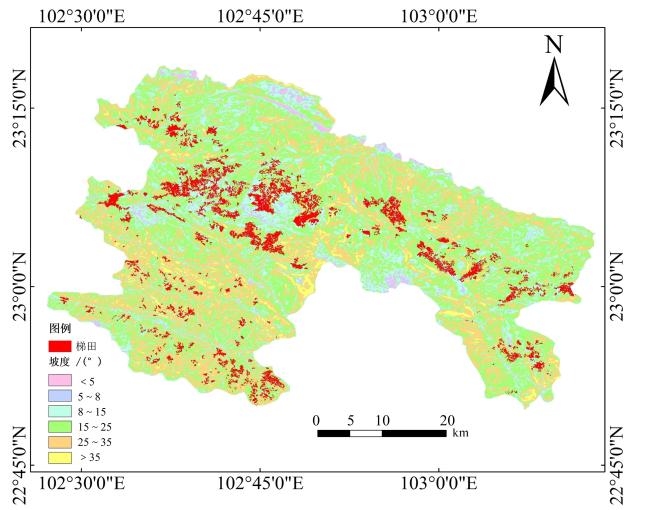
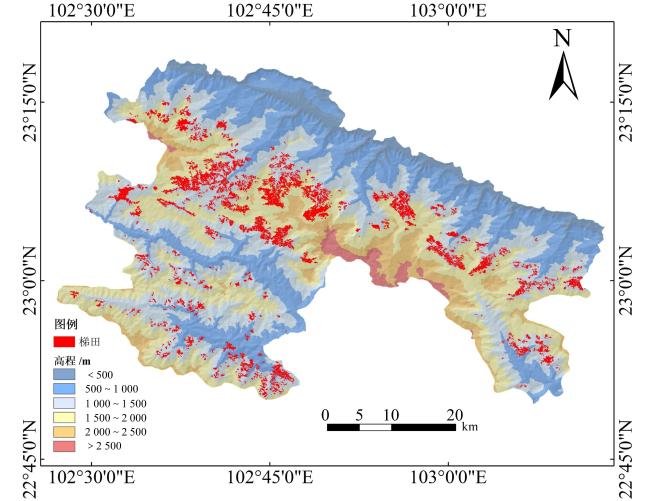
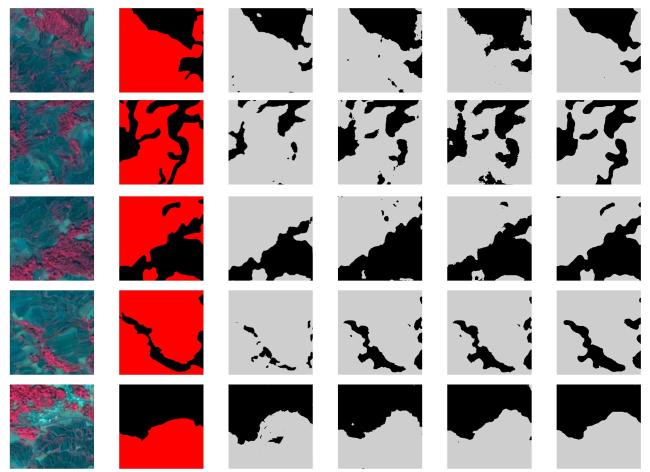
[Objective] The accurate estimation of terraced field areas is crucial for addressing issues such as slope erosion control, water retention, soil conservation, and increasing food production. The use of high-resolution remote sensing imagery for terraced field information extraction holds significant importance in these aspects. However, as imaging sensor technologies continue to advance, traditional methods focusing on shallow features may no longer be sufficient for precise and efficient extraction in complex terrains and environments. Deep learning techniques offer a promising solution for accurately extracting terraced field areas from high-resolution remote sensing imagery. By utilizing these advanced algorithms, detailed terraced field characteristics with higher levels of automation can be better identified and analyzed. The aim of this research is to explore a proper deep learning algorithm for accurate terraced field area extraction in high-resolution remote sensing imagery. [Methods] Firstly, a terraced dataset was created using high-resolution remote sensing images captured by the Gaofen-6 satellite during fallow periods. The dataset construction process involved data preprocessing, sample annotation, sample cropping, and dataset partitioning with training set augmentation. To ensure a comprehensive representation of terraced field morphologies, 14 typical regions were selected as training areas based on the topographical distribution characteristics of Yuanyang county. To address misclassifications near image edges caused by limited contextual information, a sliding window approach with a size of 256 pixels and a stride of 192 pixels in each direction was utilized to vary the positions of terraced fields in the images. Additionally, geometric augmentation techniques were applied to both images and labels to enhance data diversity, resulting in a high-resolution terraced remote sensing dataset. Secondly, an improved DeepLab v3+ model was proposed. In the encoder section, a lightweight MobileNet v2 was utilized instead of Xception as the backbone network for the semantic segmentation model. Two shallow features from the 4th and 7th layers of the MobileNet v2 network were extracted to capture relevant information. To address the need for local details and global context simultaneously, the multi-scale feature fusion (MSFF) module was employed to replace the atrous spatial pyramid pooling (ASPP) module. The MSFF module utilized a series of dilated convolutions with increasing dilation rates to handle information loss. Furthermore, a coordinate attention mechanism was applied to both shallow and deep features to enhance the network's understanding of targets. This design aimed to lightweight the DeepLab v3+ model while maintaining segmentation accuracy, thus improving its efficiency for practical applications. [Results and Discussions] The research findings reveal the following key points: (1) The model trained using a combination of near-infrared, red, and green (NirRG) bands demonstrated the optimal overall performance, achieving precision, recall, F1-Score, and intersection over union (IoU) values of 90.11%, 90.22%, 90.17% and 82.10%, respectively. The classification results indicated higher accuracy and fewer discrepancies, with an error in reference area of only 12 hm2. (2) Spatial distribution patterns of terraced fields in Yuanyang county were identified through the deep learning model. The majority of terraced fields were found within the slope range of 8º to 25º, covering 84.97% of the total terraced area. Additionally, there was a noticeable concentration of terraced fields within the altitude range of 1 000 m to 2 000 m, accounting for 95.02% of the total terraced area. (3) A comparison with the original DeepLab v3+ network showed that the improved DeepLab v3+ model exhibited enhancements in terms of precision, recall, F1-Score, and IoU by 4.62%, 2.61%, 3.81% and 2.81%, respectively. Furthermore, the improved DeepLab v3+ outperformed UNet and the original DeepLab v3+ in terms of parameter count and floating-point operations. Its parameter count was only 28.6% of UNet and 19.5% of the original DeepLab v3+, while the floating-point operations were only 1/5 of UNet and DeepLab v3+. This not only improved computational efficiency but also made the enhanced model more suitable for resource-limited or computationally less powerful environments. The lightweighting of the DeepLab v3+ network led to improvements in accuracy and speed. However, the slection of the NirGB band combination during fallow periods significantly impacted the model's generalization ability. [Conclusions] The research findings highlights the significant contribution of the near-infrared (NIR) band in enhancing the model's ability to learn terraced field features. Comparing different band combinations, it was evident that the NirRG combination resulted in the highest overall recognition performance and precision metrics for terraced fields. In contrast to PSPNet, UNet, and the original DeepLab v3+, the proposed model showcased superior accuracy and performance on the terraced field dataset. Noteworthy improvements were observed in the total parameter count, floating-point operations, and the Epoch that led to optimal model performance, outperforming UNet and DeepLab v3+. This study underscores the heightened accuracy of deep learning in identifying terraced fields from high-resolution remote sensing imagery, providing valuable insights for enhanced monitoring and management of terraced landscapes.

Cite this article

ZHANG Jun , CHEN Yuyan , QIN Zhenyu , ZHANG Mengyao , ZHANG Jun . Remote Sensing Extraction Method of Terraced Fields Based on Improved DeepLab v3+[J]. Smart Agriculture, 2024 , 6(3) : 46 -57 . DOI: 10.12133/j.smartag.SA202312028

0 引 言

梯田作为农业生产的关键要素之一,其面积估算对于农业政策制定、土地规划和资源管理至关重要。梯田监测是水土保持动态监测和评价工作中的重要环节,确定梯田规模和空间分布可为梯田的管理和维护提供依据1。卫星遥感技术支持对地表特征和地理现象进行全覆盖、全天候监测2,被广泛应用于城市规划、目标识别、土地覆盖等领域3-5,为梯田提取提供了可靠的技术支持。
梯田遥感提取的传统方法主要利用其独特的纹理、光谱和几何等特征进行分类,主要技术包括纹理频谱6、面向对象技术7, 8和浅层机器学习9, 10。然而,随着影像分辨率的不断提高,不同地物属性的边界、空间布局等语义信息越来越丰富,随之增加了图像信息的复杂性11。高分辨率影像中复杂的地形环境及“同谱异物”的现象,使得传统方法在梯田、耕地和裸地之间的辨别能力受到挑战,从而产生了地物混合12和椒盐现象13等解译上的问题。此外,仅仅关注浅层特征的传统方法很难有效利用高分辨率遥感影像中的细节特征,提取的梯田较为破碎、分散,难以满足智慧农业对精度和自动化的要求14, 15
近年来,深度学习在语义分割领域表现突出16,其自动学习深层特征的方式为高分辨率梯田影像精准提取提供了可行的方案。以卷积神经网络(Convolutional Neural Network, CNN)为代表的语义分割模型,凭借其卓越的图像分析能力,已成为梯田提取的首选方法17。例如,Wang等18通过改进UNet深度学习模型实现了梯田的像素级智能提取。Yu等19利用深度迁移学习的策略帮助了小样本数据集下梯田提取精度的提升。刘东杰20联合波谱和地形特征的方法,加强了深度学习模型梯田识别的鲁棒性。Zhao等21在梯田提取任务中采用EfficientNet v2骨干网络进行特征提取,并引入卷积注意力机制模块(Convolutional Block Attention Module, CBAM)对DeepLab v3+网络进行改进,成功平衡了超高分辨率无人机图像梯田提取的精度和速度。经典的语义分割模型DeepLab v3+通过编码器-解码器结构、深度可分卷积等手段充分考虑了浅层和深层语义信息,提高了分割性能。然而,原始DeepLab v3+模型结构复杂、参数量大等问题,导致在实际训练和推理过程中需要更多的计算资源。
本研究通过对DeepLab v3+模型的改进,提出了一种轻量级的遥感图像语义分割方法。该方法采用轻量级网络MobileNet v2作为骨干网络,减少了模型参数的数量。为了加强多尺度特征提取,避免信息丢失,利用多尺度特征融合模块替换原来的空洞空间金字塔池化模块。在此基础上,将坐标注意机制同时运用于浅层特征和深层特征,以加强网络对空间位置的学习。

1 研究区与数据处理

1.1 研究区概况

图1,研究区元阳县位于中国云南省南部,隶属于云南省红河哈尼族彝族自治州,位于哀牢山脉和红河的南岸。地理坐标范围为102°27'~103°13'E,22°49'~23°19'N之间,面积为2 212.32 km2,全县辖14个乡镇。境内层峦叠嶂,沟壑纵横,海拔差异明显,最低海拔164 m,最高海拔2 939.6 m。元阳县哈尼梯田开垦历史已有1 300多年,梯田级数最多的有3 700多级。梯田单块面积最大者达到1 000 m2,最小者不足1 m2 [22。其丰富的梯田形态可以代表中国典型的山地梯田区域,满足县域梯田自动提取的研究需求。通过精细地提取元阳县梯田信息,为该地区的梯田水土保持监测提供基础数据。
图1 元阳县位置及样本分布

注: 该图基于自然资源部标准地图服务网站下载的审图号为云S (2021) 186号标准地图制作,底图无修改。

Fig.1 Location and sample distribution in Yuanyang county

梯田的颜色、质地和形态特征随季节而变化。每年10月至次年4月,元阳县梯田进入休耕时期。在这段时间内,梯田被沟渠引水灌溉,以确保在耕种时期仍然有充足的水量,呈现出典型的蓄水形态梯田。

1.2 数据源

本研究使用云南省高分中心提供的高分六号(GF-6)卫星影像数据作为数据源,以满足高空间分辨率的要求。GF-6卫星配置2 m全色和8 m多光谱高分辨率相机,拥有红(Red)、绿(Green)、蓝(Blue)和近红外(Near Infrared,NIR)4个波段。数据使用2021年3月30日无云的GF-6卫星影像数据(信息为GF6_PMS_E102.8_N23.2_20210330_L1A1120093056),可完全覆盖整个研究区。此时研究区内梯田正处于休耕期,沟渠引水灌溉后的梯田田面平整、植被稀疏,与其他地物之间光谱差异大,便于梯田的遥感识别和提取。此外,应用于海拔、坡度的数字高程模型(Digital Elevation Model, DEM)从地理空间数据云(https://www.gscloud.cn/search)平台获取,其空间分辨率为30 m。

1.3 数据集构建

大多数公开遥感分割数据集不包括梯田类别,因此本研究利用GF-6影像构建了梯田数据集。构建GF-6深度学习梯田分割数据集的过程包括4个关键步骤:数据预处理、样本标注、样本裁剪,以及数据集划分与训练集增强,如图2所示。首先,为了满足多光谱数据的空间分辨率和数据质量的要求,实验前执行了一系列预处理步骤,包括对GF-6卫星影像的多光谱影像进行辐射定标、大气校正和正射校正,以及对全色影像进行辐射定标和正射校正。然后,运用NNDiffuse Pan Sharpening23工具融合GF-6影像中8 m分辨率的多光谱影像与2 m分辨率的全色影像,从而获得2 m分辨率的多光谱图像。
图2 梯田识别数据集构建流程

Fig. 2 The process of constructing the terrace identification dataset

梯田的状态因地形特征而异,其中,坡度、海拔和气候是最显著的影响因素。为保证训练样本中梯田具有不同的形态,根据元阳县地貌分布特征,选取14个典型区域作为训练样本区域(图1),训练样本占整个元阳县面积8.9%。通过ArcGIS软件,对14个区域的梯田进行目视解译并矢量化梯田样本。然后,将矢量数据转换为栅格数据完成标签注释。由于CNN预测依赖上下文信息特征,因此预测分类的准确性取决于输入图像中的各种对象位置,即输入图像边缘附近的对象可能会遗漏整个上下文,并可能被错误分类。为了减轻这种影响,在对影像和标签裁剪时,使用大小为256像素的滑动窗口,每个方向的步幅为192,从而改变图像中梯田的位置。此外,为了增加样本的多样性,实验对训练集和验证集进行了数据增强,包括随机旋转90°、180°、270°及水平和垂直镜像操作扩充训练样本数量,最终获得训练集14 760张图像、验证集3 690张图像。

2 研究方法

深度学习技术可以自动地从原始影像中学习到高级的特征表示,更好地适应高分辨率遥感数据中梯田的复杂性和多样性。针对梯田的特性,本研究对DeepLab v3+网络进行了相关优化,并对二元交叉熵损失函数赋予权重以提高模型性能。

2.1 改进的DeepLab v3+

DeepLab v3+网络自提出以来,由于其出色的图像分割能力,常被用于高精度图像分割24, 25。在编码器中,DeepLab v3+模型以Xception为骨干网络,从Xception中提取浅层和深层特征,深层特征输入到ASPP26。ASPP模块由4个卷积层组成,扩展因子分别为1、6、12和18,以及一个全局平均池化操作。在解码器中,采用1×1卷积层对压缩两次的底层特征的通道数进行调整,然后将底层特征与上采样4次的高层特征映射进行拼接。叠加后,通过3×3卷积对特征进行细化。最后,通过线性插值上采样得到具有原始图像分辨率的预测图像。
本研究以经典的DeepLab v3+网络模型为基础,提出改进方案如图3所示。在编码器部分,使用轻量级MobileNet v227取代Xception作为语义分割模型的骨干网络。从MobileNet v2网络中提取了第4层和第7层两个浅层特征,并应用坐标注意力(Coordinate Attention, CA)28机制增强下层的语义信息。此外,在原始DeepLab v3+网络中使用空洞空间金字塔池化(Atrous Spatial Pyramid Pooling, ASPP)模块使深层特征得到增强,但扩张卷积的离散采样容易忽略大扩张率情况下连续点之间的依赖关系,容易造成局部信息的丢失并影响预测结果。为了同时兼顾局部细节和全局语境,本研究使用MSFF模块代替ASPP模块,利用扩张率依次增大的空洞卷积级联模式改善信息丢失的问题。在解码器部分,将具有CA关注的第7层特征经过调整后上采样到与第4层特征相同的大小。然后,与原始模型一样,将深层特征经过CA关注后与浅层特征连接起来。最后,经过3×3卷积和上采样操作,图像恢复到原始大小。
图3 改进后的DeepLab V3+结构图

Fig. 3 Structure of improved DeepLab V3+

2.1.1 特征提取网络

与原始的Xception相比,MobileNet v2引入基于深度可分离卷积的反向残差模块和线性瓶颈层,从而大大减少模型参数的数量,使网络更快地收敛29。本研究对MobileNet v2进行了改进,进一步减少模型的参数个数,简化了模型。具体而言,使用MobileNet v2网络的前8层,下采样因子设置为3。同时,将第5层和第7层的步幅由原始的2改为1,将第7层的3×3普通卷积替换为扩张率为4的空洞卷积。具体的网络结构如表1所示。
表1 MobileNet v2的主要参数

Table 1 The primary parameters of MobileNet v2

i 操作 c n s r
1 Conv2d 32 1 2 1
2 32 Bottleneck 16 1 1 1
3 16 Bottleneck 24 2 2 1
4 24 Bottleneck 32 3 2 1
5 32 Bottleneck 64 4 1 1
6 64 Bottleneck 96 3 1 1
7 96 Bottleneck 160 3 1 4
8 160 Bottleneck 320 1 1 1

注: i表示输入通道数;-为输入数据的波段数;c表示输出通道数;n表示瓶颈重复的次数;s表示步幅;r表示扩张率。

2.1.2 坐标注意力模块

在卷积神经网络中,SENet30和CBAM31等注意机制被广泛使用,但SENet注意机制只关注通道维度信息,没有考虑空间维度信息,而CBAM虽然融合通道和空间维度信息,但无法解决空间维度上的远距离依赖问题。CA机制是一种轻量级的注意机制,同时考虑通道和空间维度,可以解决远程依赖等问题。其关键思想是将坐标信息作为输入的一部分,允许模型实现跨通道的信息获取,从而更准确地提取特征。在梯田语义分割任务中,CA更加注重图像中每个像素的位置,使模型更好地理解图像中梯田的空间结构,从而改善对梯田边界、形状和位置的识别。

2.1.3 多尺度特征融合模块

MSFF模块通过使用不同扩张率的空洞卷积和池化操作来实现多尺度特征融合,以提高网络的性能。如图3所示,该模块经过4个并行的分支网络结构:第1个分支分别使用扩张率为1、2、3的3个空洞卷积来获取较小尺度下的特征信息;第2个分支分别使用扩张率为1、6、12的3个空洞卷积来进一步扩大特征信息的尺度;第3和第4分别使用Average Pooling和Max Pooling来获取全局信息和局部信息,并进行上采样恢复输入图像的大小。最后,使用1×1卷积层对融合后的特征进行进一步融合和调整输出特征图的数量。这种在编码器和解码器之间引入多尺度特征融合模块有助于提高网络在梯田提取任务中的性能,确保网络能够更好地处理多尺度的梯田地形特征,减少信息损失。
与ASPP模块相比,MSFF模块仅包含4个分支。在模块中,每个分支不再使用单一的空洞卷积,而是采用扩张率逐渐增大的空洞卷积进行串联。这样的设计旨在减少参数的同时,扩大模型感受野以捕捉不同尺度的信息,确保每个分支都能有效地提取更多的多尺度特征。此外,另外两个分支分别包含2×2的Average Pooling层和Max Pooling层,通过并联可以减缓信息的丢失,并更好地保留原始特征图中的多样性信息。

2.2 损失函数

高分辨率遥感图像中不同类型地物所占比例不同。目标地物与背景的极端不平衡将影响分割网络的性能。因此,为了降低特征类别比例差异大对模型特征分类精度的影响,本研究采用改进的二元交叉熵损失函数来处理分类对象比例不平衡的问题。计算如公式(1)所示。
L B C E = W 1 × - y l o g p ( y ) - W 2 1 - y l o g   [ 1 - p y ]
式中: y为二元标签0或者1; p ( y )为输出属于y标签的概率; W 1 W 2为权重系数,实验通过计算所有训练样本中目标和背景像素和占总像素的比值来实现。

2.3 评价指标

精度评价是描述模型可靠性的重要组成部分。本研究利用混淆矩阵的方法计算模型精度,通过分析梯田提取结果的真阳性(True Positive, TP)、真阴性(True Positive, TN)、假阳性(False Negative, FP)、假阴性(False Negative, FN)之间的关系进行精度评价,采用精确率、召回率、F 1评分和IoU作为评价模型的准则,评价指标公式如表2所示。
表2 精度评价指标及意义

Table 2 The accuracy evaluation metrics and their significance

评价指标 公式 意义
精确率(Precision) P r e c i s i o n = T P T P + F P (2) 衡量模型在预测正类别时的准确性
召回率(Recall) R e c a l l = T P T P + F N (3) 衡量模型识别所有正类别样本的能力
F 1评分(F 1-Score) F 1 - S c o r e = 2 × P r e c i s i o n × R e c a l l P r e c i s i o n + R e c a l l (4) F 1评分是精确率和召回率的调和平均值,综合考虑模型的准确性和召回能力
交并比Intersection over Union, IoU) I o U = T P T P + F P + F N (5) 衡量模型预测的目前区域与实际目标区域之间的重叠程度

3 结果与分析

3.1 实验设置

为了有效训练深度学习模型,实验在I9-12900k 16核24线程CPU,配置64 G内存,搭载GV-N3090GAMING显卡的计算机上进行。在软件方面,使用Windows 11专业版64位操作系统,Anaconda 3(64位)进行环境配置,在环境中安装python 3.7,基于开源框架TensorFlow2.4.0作为后端的深度学习框架。实验过程中,Batch size设置为8,初始Epoch设置为200,学习率设置为0.003,Adam作为优化器,多步长动态调整学习率。为了防止过度拟合,当训练损失和IoU连续10次没有改善时,网络将停止模型训练并保存最优模型。

3.2 不同波段组合对梯田提取的影响

已有研究表明,近红外波段对深度学习模型识别耕地具有明显的影响32。本研究选取一个5 km×5 km的梯田集中区域来探究不同波段组合下模型识别梯田的效果。该区域参考梯田面积为976 hm2,参考矢量地块数量为79块。表3展示了在RGB、NirRG和NirRGB波段组合下模型在测试区域的精度指标对比。在RGB波段组合中,Precision取得最高,但Recall相对降低,导致F 1和IoU最低。在NirRGB波段组合中,各个指标具有较均衡的性能,且Recall和IoU相较于RGB波段有明显的提升,证明近红外波段对梯田识别具有促进作用。而在NirRG波段组合中,各项指标都保持在较高水平。其中IoU达到了相对最高,表明模型的预测结果和真实情况的重叠较好,进一步说明近红外波段的促进效果。从指标对比中可以看出,NirRG波段组合训练的模型整体表现最佳,Precision、Recall、F 1-Score和IoU分别为90.11%、90.22%、90.17%和82.10%。
表3 梯田集中区域不同波段组合的精度对比

Table 3 The accuracy comparison of different band combinations in the concentrated terraced area

波段组合 Precision/% Recall/% F 1-Score/% IoU/% 地块数量 预测面积/hm2
RGB 90.67 86.35 88.46 79.31 790 1 015
NirRG 90.11 90.22 90.17 82.10 228 964
NirRGB 89.89 90.27 90.08 80.96 326 928
为了进一步分析波段组合对梯田分类结果的实际影响,实验统计了不同波段组合下测试区域的梯田预测地块数和总面积。从生成的梯田地块数量可以看出,RGB波段组合生成的数量最多,达到700以上,而NirRG和NirRGB波段组合的地块数量分别为228和326。总面积方面,RGB、NirRG和NirRGB波段组合的面积分别为1 015、964和928 hm2,其中NirRG与参考面积仅有12 hm2的误差。
为了验证提取结果,将不同波段组合的结果与影像叠加显示的视觉效果展示在图4中。整体上,3种波段组合方式基本上都能将梯田范围大致提取出来。然而,在局部细节上,RGB组合提取结果的破碎程度较高,左侧有较大零碎的坡耕地被误识别为梯田。NirRGB组合错误的现象比较明显,尤其是靠近建筑物区域的梯田。相比之下,NirRG提取结果更加完整,对梯田和坡耕地的提取结果相对更为准确。
图4 不同波段组合下测试区域梯田提取结果

Fig. 4 Extraction results of terraced fields in test areas under different band combinations

3.3 梯田提取结果与分析

利用本研究提出的网络进行样本训练后,使用最优训练模型对整个元阳县梯田进行预测。将预测结果通过相邻图像重叠四分之一的方式拼接得到元阳县梯田提取结果,如图5所示。结果显示,元阳县中部地区是梯田分布的主要集中区域,这里分布着连片的上万亩梯田(如箐口、全福庄、麻栗寨和主鲁等梯田风景区)。在南部和东部地区,同样观察到有大面积梯田的分布,但相对中部地区较为分散,大都分布于居民点附近。沿着北部河谷地区几乎没有梯田的分布,这可能是由于该地区地形较为陡峭,不适合进行梯田农业。图5a~图5e为元阳县4个典型梯田区域的测试效果。在图5b图5c中,预测结果的梯田内部存在一些细小的噪声现象,对模型的判别准确性产生了轻微的影响,但模型对于梯田内部的植被具有较为准确的判断。在图5d图5e中观察到对于坡耕地和梯田辨别具有一定的准确性,展示出对于不同地形特征的敏感性。总体而言,模型在大面积梯田提取的测试中表现出较高准确性,测试结果突显了模型对于大范围梯田提取的整体良好性能,同时也提示了在处理植被复杂、地形变化明显的区域时,还有进一步提高模型精度的空间。
图5 元阳县梯田和典型区域识别结果

Fig. 5 Results of identification of terraces and typical areas in Yuanyang county

为进一步分析元阳县梯田的分布情况,依据水利部发布的《土地侵蚀分类分级标准》(SL190—2007)33,将坡度划分为6个等级(图6),统计分析不同坡度上梯田分布情况。数据表明,预测结果中梯田的总面积为15 562.18 hm2,元阳县境内有统计的哈尼梯田面积约为1.3万hm2,加上元阳县南部零碎的非哈尼梯田,大致符合实际的梯田面积。根据表4可知,大部分的梯田分布在坡度8º~25º之间的区间内,占据了总梯田面积的84.97%。坡度小于5º和大于35º的面积只占1.65%,表明坡度过高或过低的地形条件可能不太适合梯田农业。梯田的分布主要集中在中等坡度范围内。
图6 元阳县梯田在不同坡度的空间分布

注: 该图基于自然资源部标准地图服务网站下载的审图号为云S(2021) 186号标准地图制作,底图无修改。

Fig. 6 The spatial distribution of terraced fields in Yuanyang county across different slopes

表4 元阳县不同坡度等级下梯田的面积及占比

Table 4 The area and proportion of terraced fields in Yuanyang county at different slope levels

坡度/(°) 面积/hm2 占比/%
<5 230.51 1.47
5~8 632.32 4.05
8~15 5 430.85 34.82
15~25 7 820.91 50.15
25~35 1 453.59 9.32
>35 28.75 0.18
以500 m为海拔梯度间隔划分6个等级统计元阳县梯田空间分布变化与海拔的关系(图7)。根据表5可知,元阳县境内,梯田的海拔分布差异明显,绝大多数的梯田分布在海拔为1 000~2 000 m,占据总梯田面积的95.02%。海拔梯度为1 000~1 500 m的梯田面积最多,占总面积的69.57%。低于500 m和高于2 000 m的海拔范围内,几乎没有梯田存在。这种分布情况可能受到地理条件和气候因素的影响,对于地方农业规划和土地利用决策有重要意义。
图7 元阳县梯田在不同高程的空间分布

注: 该图基于自然资源部标准地图服务网站下载的审图号为云S (2021) 186号标准地图制作,底图无修改。

Fig. 7 The spatial distribution of terraced fields in Yuanyang county across different elevations

表5 元阳县不同海拔等级下梯田的面积及占比

Table 5 The area and proportion of terraced fields in Yuanyang county at different altitude levels

海拔/m 面积/hm2 占比/%
<500 N/A N/A
500~1 000 775.72 4.98
1 000~1 500 10 825.54 69.57
1 500~2 000 3 959.91 25.45
2 000~2 500 N/A N/A
>2 500 N/A N/A

注:N/A表示无数据。

3.4 与其他算法比较

为了验证改进DeepLab v3+模型对梯田提取的有效性,在保证其他训练参数不变的情况下,将基于MobileNet v2骨干网络构建的改进轻量级DeepLab v3+模型与UNet、PSPNet及原始DeepLab v3+模型进行对比。通过表6可知,改进后的DeepLab v3+网络Precision为93.93%、Recall为92.08%、F 1评分为93.17%、IoU为83.21%。相比于原始DeepLab v3+网络,4个指标分别提升4.62%、2.61%、3.81%和2.81%。与PSPNet和UNet相比,Precision分别提高7.72%和3.49%;Recall分别提高8.01%和1.59%;F 1-Score分别提高7.96%和2.71%;IoU分别提高4.73%和3.52%。
表6 元阳县梯田识别结果的精度对比

Table 6 Comparison of the accuracy of the identification results of terraced fields in Yuanyang county

方法 Precision/% Recall/% F 1-Score/% IoU/%
PSPNet 86.21 84.07 85.21 79.20
UNet 90.44 90.49 90.46 80.41
DeepLab v3+ 89.31 89.47 89.39 81.12
Improved DeepLab v3+ 93.93 92.08 93.17 83.93
图8可以看出,4个模型都成功提取了梯田,但本研究的方法对梯田提取结果优于其他模型。其中,PSPNet网络提取结果存在大量粘连现象,对于梯田内部的小面积非梯田区域不能有效提取。UNet和DeepLab v3+在提取结果方面粘连现象得到显著改善,梯田的整体提取效果更准确。DeepLab v3+虽然更好地关注不同位置的梯田特征,但由于对局部特征的过度关注,导致在边缘区域毛刺现象变得更明显。相比之下,改进后的DeepLab v3+网络改善了粘连问题的同时保持边缘的清晰性,没有引入边界毛刺。
图8 不同算法提取结果的局部细节对比

a. 图像 b. 标签 c. PSPNet d. UNet e. DeepLab v3+ f. Improved DeepLab v3+

Fig. 8 Comparison of local details in extraction results obtained using different algorithms

表7统计了实验中对比算法模型的参数量(Parameters),浮点运算数(Floating Point Operations, FLOPs)和取得最优模型所经历的轮数(Optimal Model Epoch, OME)。通过比较可以得出以下结论:首先,改进的DeepLab v3+网络的参数量为8 M,其参数量仅为UNet网络的28.6%,DeepLab v3+的19.5%。其次,在浮点运算数方面,改进的DeepLab v3+网络相对于UNet和DeepLab v3+来说,具有更小的FLOPs数值。这意味着改进的DeepLab v3+网络在模型的复杂度上明显降低,这对于实际应用中的计算资源要求更为友好。同时,也反映在取得最优模型所需的Epoch数上,改进的DeepLab v3+网络仅需要108轮,而UNet和DeepLab v3+分别需要115轮和128轮,这表明改进的模型在训练过程中更为高效。与轻量级PSPNet相比,改进的DeepLab v3+网络在表7中的3个指标并未显示出明显的优势。然而,通过综合上文的精度分析可得知,改进的DeepLab v3+网络整体上表现出绝对的优势。在实际场景中,模型参数量和浮点运算数并不是影响模型性能的唯一因素,而网络结构和训练策略等因素也在综合性能上起到了关键作用。
表7 四种算法的分割效率对比

Table 7 Comparison of segmentation efficiency among four algorithms

方法 Parameters/M FLOPs OME/epoch
PSPNet 3 8.2×10¹⁰ 92
UNet 28 1.8×10¹² 115
DeepLab v3+ 41 1.9×10¹² 128
Improved DeepLab v3+ 8 3.5×10¹¹ 108

4 讨论与结论

4.1 讨论

在梯田语义分割任务中,UNet模型结构简单,利用跳跃连接有助于多分辨率特征的融合,在数据量较小的情况能取得不错的效果34。但由于固定的感受野,使其在面临复杂的地物特征时,细节特征提取不完整。相较于UNet和DeepLab v3+模型,PSPNet可以认为是轻量级语义分割模型35,但随着卷积深度的增加,模型可能达到性能瓶颈,难以进一步提高分割精度。DeepLab v3+模型引入了ASPP模块,用于同时捕获不同尺度的上下文信息,有助于提高对目标的理解和分割精度36。由于梯田在空间上具有多尺度特征,而DeepLab v3+模型能够更全面地理解梯田图像中的细节和结构。然而,DeepLab v3+模型相对较大参数量和较高计算复杂度成为在实际应用中的一项挑战,使得在资源受限的环境中难以高效地部署和运行该模型。轻量化DeepLab v3+模型成为当前深度学习研究中的一个重要方向,以确保模型在轻量化的同时仍然能够有效地应对梯田图像等复杂场景的分割任务。
模型提取的精度除了受到模型结构的影响之外,还包括研究对象、数据集的处理等。本研究采用了休耕时期的GF-6梯田影像作为数据源,并选择NirRG波段组合进行模型训练,在特定场景任务中取得了较高的精度。然而,这些措施也存在一些局限性。首先,梯田会随着种植作物的生长状态具有明显的时序特征。单一时节训练的模型可能无法很好地适应这种时序变化,丧失了对梯田全年变化的有效捕捉能力。其次,实验采用了NirRG波段组合,保证了提取精度和梯田完整性。然而,获取具有近红外波段的高分辨率影像并非易事,实际应用中仅有RGB波段的高分辨率影像更为常见。这使得本研究所训练的模型在缺乏NIR波段信息的情况下适用性显著降低,从而限制了其在更广泛场景中的应用潜力。

4.2 结论

本研究提出了一种改进的DeepLab v3+模型,将骨干网络替换为轻量级网络Mobilenet v2。同时再引入MSFF模块替换原来的ASPP模块,将CA机制同时运用于浅层特征和深层特征,以加强网络对空间位置的学习。以云南省红河哈尼族彝族自治州元阳县为研究区,进行了梯田提取的县域研究,取得较为理想的识别结果。主要结论如下:
1)近红外波段对于模型学习梯田特征具有明显的促进作用,经过波段组合对比发现,NirRG波段组合下,梯田的整体识别效果和精度指标最高。
2)与PSPNet、UNet和原始的DeepLab v3+相比,本研究提出的模型在梯田数据集上具有更高的精度和更好的效果。模型总参数量、浮点运算数和取得最优模型所经历的轮数这三个分割效率的指标方面,改进后的DeepLab v3模型较UNet和原始的DeepLab v3+有更优的效率。

利益冲突声明

本研究不存在研究者以及与公开研究成果有关的利益冲突。

1
张艳超, 杨海龙, 信忠保, 等. 基于面向对象和无人机影像的黄土高原丘陵区小流域梯田提取研究[J]. 水土保持学报, 2023, 37(3): 139-146.

ZHANG Y C, YANG H L, XIN Z B, et al. Extraction of small watershed terraces in the hilly areas of loess plateau through UAV images with object-oriented approach[J]. Journal of soil and water conservation, 2023, 37(3): 139-146.

2
李德仁. 摄影测量与遥感的现状及发展趋势[J]. 武汉测绘科技大学学报, 2000, 25(1): 1-6.

LI D R. Towards photogrammetry and remote sensing: Status and future development[J]. Geomatics and information science of Wuhan university, 2000, 25(1): 1-6.

3
张华卫, 张文飞, 蒋占军, 等. 引入上下文信息和Attention Gate的GUS-YOLO遥感目标检测算法[J]. 计算机科学与探索, 2024, 18(2): 453-464.

ZHANG H W, ZHANG W F, JIANG Z J, et al. GUS-YOLO remote sensing target detection algorithm introducing context information and Attention Gate[J]. Journal of frontiers of computer science and technology, 2024, 18(2): 453-464.

4
史姝姝, 窦银银, 陈永强, 等. 中国海岸带区域城市扩展遥感监测与内部地表覆盖时空分异特征分析[J]. 自然资源遥感, 2022, 34(4): 76-86.

SHI S S, DOU Y Y, CHEN Y Q, et al. Remote sensing monitoring based analysis of the spatio-temporal changing characteristics of regional urban expansion and urban land cover in China's coastal zones[J]. Remote sensing for natural resources, 2022, 34(4): 76-86.

5
田智慧, 常蓬, 赫晓慧, 等. 一种基于CNN-GCN的高分辨率遥感影像土地覆盖分类[J]. 测绘科学, 2023, 48(6): 59-72.

TIAN Z H, CHANG P, HE X H, et al. Land cover classification of high resolution remote sensing images based on CNN-GCN[J]. Science of surveying and mapping, 2023, 48(6): 59-72.

6
赵钧阳, 赖格英. 高分辨率遥感影像中小尺度梯田纹理信息的增强与提取[J]. 江西科学, 2020, 38(2): 263-268.

ZHAO J Y, LAI G Y. Enhancement and extraction of small-scale terrace texture information for high-resolution remote sensing image[J]. Jiangxi science, 2020, 38(2): 263-268.

7
党恬敏, 穆兴民, 孙文义, 等. 高分辨率遥感影像梯田快速提取方法研究进展[J]. 人民黄河, 2017, 39(3): 85-89, 94.

DANG T M, MU X M, SUN W Y, et al. Review of quickly discriminating approaches of terrace information based on high resolution remote sensing images[J]. Yellow river, 2017, 39(3): 85-89, 94.

8
李梦华, 石云, 马永强, 等. 基于面向对象的黄土丘陵沟壑区梯田信息提取研究[J]. 测绘与空间地理信息, 2019, 42(5): 50-54.

LI M H, SHI Y, MA Y Q, et al. Terrace information extraction in loess hilly-gully region landscape based on object-oriented classification method[J]. Geomatics & spatial information technology, 2019, 42(5): 50-54.

9
吴傲, 袁利, 齐斐, 等. 基于随机森林的山丘区梯田措施类型识别与评价[J]. 山东农业大学学报(自然科学版), 2023, 54(4): 582-594.

WU A, YUAN L, QI F, et al. Identification and evaluation of terracing measure types in hilly areas based on random forest[J]. Journal of Shandong agricultural university (natural science edition), 2023, 54(4): 582-594.

10
DENG C X, ZHANG G Y, LIU Y J, et al. Advantages and disadvantages of terracing: A comprehensive review[J]. International soil and water conservation research, 2021, 9(3): 344-359.

11
ZHAO W Z, DU S H. Learning multiscale and deep representations for classifying remotely sensed imagery[J]. ISPRS journal of photogrammetry and remote sensing, 2016, 113: 155-165.

12
JAWAK S D, DEVLIYAL P, LUIS A J. A comprehensive review on pixel oriented and object oriented methods for information extraction from remotely sensed satellite images with a special emphasis on cryospheric applications[J]. Advances in remote sensing, 2015, 4(3): 177-195.

13
GHAMISI P, COUCEIRO M S, BENEDIKTSSON J A. Classification of hyperspectral images with binary fractional order Darwinian PSO and random forests[C]// Proc SPIE 8892, image and signal processing for remote sensing. Washington, D.C., USA: SPIE, 2013, 8892: 215-222.

14
刘晓燕, 杨胜天, 王富贵, 等. 黄土高原现状梯田和林草植被的减沙作用分析[J]. 水利学报, 2014, 45(11): 1293-1300.

LIU X Y, YANG S T, WANG F G, et al. Analysis on sediment yield reduced by current terrace and shrubs-herbs-arbor vegetation in the loess plateau[J]. Journal of hydraulic engineering, 2014, 45(11): 1293-1300.

15
XIONG L Y, TANG G A, YANG X, et al. Geomorphology-oriented digital terrain analysis: Progress and perspectives[J]. Journal of geographical sciences, 2021, 31(3): 456-476.

16
HINTON G E, SALAKHUTDINOV R R. Reducing the dimensionality of data with neural networks[J]. Science, 2006, 313(5786): 504-507.

17
周珏, 李蒙蒙, 汪小钦, 等. 面向对象卷积神经网络的耕作梯田提取[J]. 遥感信息, 2022, 37(2): 138-144.

ZHOU J, LI M M, WANG X Q, et al. Extraction of farming terraces using object-based convolutional neural networks from very high resolution satellite images[J]. Remote sensing information, 2022, 37(2): 138-144.

18
WANG Y N, KONG X B, GUO K, et al. Intelligent extraction of terracing using the ASPP ArrU-net deep learning model for soil and water conservation on the loess plateau[J]. Agriculture, 2023, 13(7): 1283.

19
YU M G, RUI X P, XIE W Y, et al. Research on automatic identification method of terraces on the loess plateau based on deep transfer learning[J]. Remote sensing, 2022, 14(10): ID 2446.

20
刘东杰. 联合波谱和地形特征的深度学习梯田提取方法探讨[D]. 兰州: 兰州大学, 2022.

LIU D J. Study on terraced field extraction with a deep learning method combined with both spectral and topographic features[D]. Lanzhou: Lanzhou University, 2022.

21
ZHAO Y L, CAI D M, LYU X J, et al. Terraced field extraction in UAV imagery using improved DeepLab v3+ network[C]// 2023 8th International Conference on Intelligent Computing and Signal Processing (ICSP). Piscataway, New Jersey, USA: IEEE, 2023: 854-859.

22
刘敬, 刘澄静, 角媛梅, 等. 基于GIS的元阳梯田空间分布及其自然要素分异研究[J]. 水土保持研究, 2020, 27(2): 337-343.

LIU J, LIU C J, JIAO Y M, et al. Study on the spatial distribution rules and variation of natural factors of hani rice terrace in Yuanyang county based on GIS spatial data[J]. Research of soil and water conservation, 2020, 27(2): 337-343.

23
SUN W H, CHEN B, MESSINGER D. Nearest-neighbor diffusion-based pan-sharpening algorithm for spectral images[J]. Optical engineering, 2014, 53(1): ID 013107.

24
WANG C S, DU P F, WU H R, et al. A cucumber leaf disease severity classification method based on the fusion of DeepLab v3+ and U-Net[J]. Computers and electronics in agriculture, 2021, 189: ID 106373.

25
AZAD R, ASADI-AGHBOLAGHI M, FATHY M, et al. Attention DeepLab v3+: Multi-level context attention mechanism for skin lesion segmentation[C]// BARTOLI A, FUSIELLO A. European Conference on Computer Vision. Berlin, German: Springer, 2020: 251-266.

26
ZHANG D Y, DING Y, CHEN P F, et al. Automatic extraction of wheat lodging area based on transfer learning method and deeplab v3+ network[J]. Computers and electronics in agriculture, 2020, 179: ID 105845.

27
SANDLER M, HOWARD A, ZHU M L, et al. MobileNet V2: Inverted residuals and linear bottlenecks[C]// 2018 IEEE/CVF Conference on Computer Vision and Pattern Recognition. Piscataway, New Jersey, USA: IEEE, 2018: 4510-4520.

28
HOU Q B, ZHOU D Q, FENG J S. Coordinate attention for efficient mobile network design[C]// 2021 IEEE/CVF Conference on Computer Vision and Pattern Recognition (CVPR). Piscataway, New Jersey, USA: IEEE, 2021: 13713-13722.

29
LI W, LIU K. Confidence-aware object detection based on MobileNet v2 for autonomous driving[J]. Sensors, 2021, 21(7): ID 2380.

30
HU J, SHEN L, SUN G. Squeeze-and-excitation networks[C]// 2018 IEEE/CVF Conference on Computer Vision and Pattern Recognition. Piscataway, New Jersey, USA: IEEE, 2018: 7132-7141.

31
WOO S, PARK J, LEE J Y, et al. CBAM: convolutional block attention module[C]// European Conference on Computer Vision. Berlin, German: Springer, 2018: 3-19.

32
LIU Z Z, LI N, WANG L J, et al. A multi-angle comprehensive solution based on deep learning to extract cultivated land information from high-resolution remote sensing images[J]. Ecological indicators, 2022, 141: ID 108961.

33
中华人民共和国水利部. 土壤侵蚀分类分级标准: SL 190—2007 [S]. 北京: 中国水利水电出版社, 2008.

Ministry of Water Resources of the People's Republic of China. Standards for classification and gradation of soil erosion: SL 190—2007 [S]. Beijing: China water & power press, 2008.

34
RONNEBERGER O, FISCHER P, BROX T. U-net: Convolutional networks for biomedical image segmentation[C]// International Conference on Medical Image Computing and Computer-Assisted Intervention. Berlin, German: Springer, 2015: 234-241.

35
ZHAO H S, SHI J P, QI X J, et al. Pyramid scene parsing network[C]// 2017 IEEE Conference on Computer Vision and Pattern Recognition (CVPR). Piscataway, New Jersey, USA: IEEE, 2017.

36
CHEN L C, ZHU Y K, PAPANDREOU G, et al. Encoder-decoder with atrous separable convolution for semantic image segmentation[C]// European Conference on Computer Vision. Berlin, German : Springer, 2018: 833-851.

Outlines

/