


0 引 言
高光谱成像(Hyperspectral Imaging, HSI)是一种集成光谱与图像信息的先进检测技术,具有高空间分辨率、高光谱分辨率的特点,能够在每个波长下提供空间图像,从而实现样品表面分子振动信息的空间分布分析,被广泛用于农产品质量的无损评估[3]。此外,这种先进的光谱技术可以实现高通量分析。近年来,HSI技术在多种水果的水分含量预测中得到了广泛应用。例如,Di等[4]利用增强型近红外高光谱相机(900~1 750 nm)结合多元线性回归(Multiple Linear Regression, MLR)与偏最小二乘回归(Partial Least Squares Regression, PLSR)方法,实现了对冬枣水分含量的快速预测。Yang等[5]将高光谱成像系统(400~1 000 nm)与机器学习算法相结合,构建了多元散射校正-竞争自适应加权采样-径向基函数(MSC-CARS-RBF,Multiplicative Scatter Correction-Competitive Adaptive Reweighted Sampling-Radial Basis Function)模型,在甘薯水分预测中取得了良好效果(RMSE= 0.066%,R 2= 0.97)。Chen等[6]基于多元散射校正(Multiplicative Scatter Correction, MSC)预处理和竞争自适应重加权采样(Competitive Adaptive Reweighted Sampling, CARS)算法提取特征波长的反向传播神经网络(Back Propagation Neural Network, BPNN),实现了新鲜苹果水分的定量预测。Meng等[7]开展了基于HSI的枇杷水分无损检测研究,并通过偏最小二乘判别分析(Partial Least Squares Discriminant Analysis, PLS-DA)、多元逻辑回归(Multinomial Logistic Regression, MLogR)和BPNN等多种分类模型实现了不同贮藏时间枇杷的新鲜度判别。然而,迄今为止,关于山楂水分含量预测的研究较少。因此,有必要开展基于HSI技术的山楂水分含量检测研究,为山楂品质分级与加工提供技术支撑。
本研究旨在基于高光谱成像技术,构建一种高效的山楂含水量快速无损分析的方法。由于高光谱数据的高维性和计算机性能的限制,必须通过降低原始高光谱数据的维数来简化建模过程并提高建模效率。因此,本研究以山楂果实为研究对象,系统地分析摆放位置、光谱范围、预处理方法、特征波段提取方法、回归模型对山楂水分预测性能的影响。创新性地采用基于离散小波变换与逐步回归联用(Discrete Wavelet Transform-Stepwise Regression, DWT-SR)进行特征数据提取的方法,建立最佳山楂含水量预测模型。与常规可见近红外光谱方法相比,本研究所提出的策略实现了基于山楂原型果实的快速、无损与高通量检测,无须对样品进行干燥、研磨等预处理步骤,实现了对新鲜山楂水分含量的完全无损预测,显著提升了检测效率与适用性。研究结果可为山楂水分在线监测及智能分选提供新的技术路径,为开发基于光谱传感的智能分选装备提供理论基础。
1 材料与方法
1.1 山楂样品收集
本研究从河北、辽宁、河南、山东和山西共五个省份采集了不同品种的新鲜山楂样品458个。具体包括河北清河“大金星”(HB_DJX,35个),河北石家庄“燕瓤红”(HB_YRH,29个),河北兴隆“铁山楂”(HB_TSZ,35个),河南济源“大五棱”(HN_DWL,60个),山东费县“金如意”(SD_JRY,60个),山东新泰“玉甘红”(SD_YGH,35个),山西运城“大金星”(SX_DJX,35个),山西运城“大五棱”(SX_DWL,50个),山西“水果山楂”(SX_SG,50个),辽宁本溪“本溪4号”(LN_BX,34个),以及辽宁沈阳“辽红”(LN_LH,35个)。所有山楂新鲜采摘之后快速送到北京实验室,确保每个样品没有破损。
1.2 高光谱数据采集
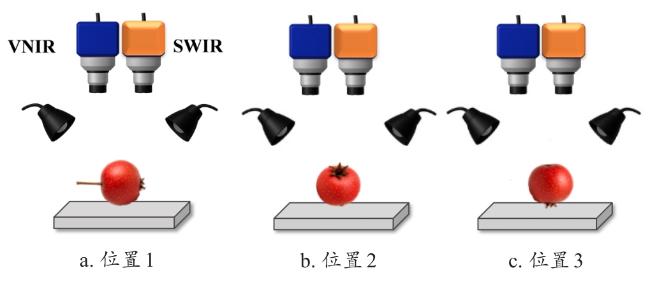
采用 HySpex 系列高光谱成像光谱仪(Norsk Elektro Optikk A/S公司,挪威)采集HSI数据。系统包括可见-近红外( Visible to Near Infrared, VNIR)(410~990 nm,分辨率5.4 nm,共108个波长)和短波红外(Short-Wave Infrared, SWIR)(950~2 500 nm,分辨率5.45 nm,共288个波长)两个波段范围的镜头、两个150 W卤钨灯其入射角为45°、移动载物平台及自带计算机和软件。VNIR和SWIR曝光时间分别为0.003 5和0.004 5 s,样品距离镜头30 cm,传送带速度为2.5 mm/s。实验在室温条件下进行,温度为25±2 °C,相对湿度维持在45%~65%。
考虑到山楂果实的形状,以及由于表面反射率不均匀而导致的不同朝向可能造成的光谱变化,分别从三个不同的位置采集了高光谱图像。摆放示意图见图1,位置1表示果实水平放置,果柄朝侧;位置2表示果柄朝下;位置3表示果柄朝上。
获得山楂高光谱数据后,原始高光谱图像首先使用HySpex RAD软件(挪威Norsk Elektro Optikk公司)进行校正,然后进行黑白板校正,如公式(1) 所示。
式中:I为校正后的反射率图像;I raw为原始反射率图像;I w为白板参考图像;I d为黑板参考图像。
1.3 感兴趣区域提取
采用阈值分割法提取感兴趣区域(Region of Interest, ROI)。首先,对反射率校正后的高光谱图像的第一波段进行固定阈值(0.6)分割,获得初始掩膜以定位样品大致区域。然后,采用主成分分析(Principal Component Analysis, PCA)对高光谱图像进行降维,保留前三个主成分。对第一主成分(PC1)图像,依据高光谱相机类型(VNIR或SWIR)设置不同固定阈值(VNIR:-0.75;SWIR:-0.5)进行二值化,将像素值大于阈值的设为1(目标),其余设为0(背景)。然后,利用初始掩膜定位信息去除PC1分割结果中的边缘干扰区域,再通过闭运算(矩形结构元素1×5)和孔洞填充优化分割掩膜,并滤除小面积区域(VNIR:面积<1 500像素;SWIR:面积<250像素)。最后,提取连通区域的边界框作为ROI,计算ROI内所有像素的平均反射率,获得样本光谱数据。
1.4 山楂水分含量测定
光谱采集完成后,样品立即进行水分指标测定,避免水分损失导致数据失真。按照国家标准(GB/T 5009.3—2016)中[10]的干燥减量法,将每个山楂样品放入电热鼓风干燥箱中,在75 ℃下干燥36 h。水分含量计算如公式(2) 所示。
式中:w为样品的含水量,%;m 1为样品干燥前的质量,g;m 2为样品干燥后的质量,g。
1.5 光谱数据处理方法
1.6 DWT-SR算法
DWT-SR算法旨在实现数据的多尺度变换,降低数据的维数。DWT-SR算法包含两步降维算法,其中DWT对原始光谱数据进行多尺度变换以获得最优的山楂含水量预测数据集,而SR算法在最优小波分解层下进一步实现数据降维。
小波变换由许多子函数组成,每个子函数都源自一个母小波 。此外,可以通过对母小波进行缩放和平移来生成小波基函数(Wavelet Basis Function, WBF)[17],母小波计算如公式(3) 所示。
式中:∅( a , b )(t)为生成的小波基函数;a为尺度参数;b为平移参数;t为光谱的自变量波长,nm。为了便于数据处理,采用DWT对原始信号进行离散化,如公式(4) 所示[18]:
式中:∅( j . k )(t)为离散小波基函数;a 0为尺度步长;b 0为平移步长;j为尺度级别;k为平移级别。
另外,将山楂样品ROI区域高光谱数据分解为低频分量和高频分量,并将小波分解得到的低频分量和高频分量分别放入矩阵 A i和矩阵 D i中,其中i表示小波分解层数。
然后,采用SR方法对低频成分矩阵 A i进行进一步处理。利用因子分析中的后向消去法评估矩阵 A i中数据特征的有效性。将SR选取的特征数据放入矩阵 B i(ci×di)中,其中ci为第i层小波分解下经过SR处理后的特征数据个数,di为第i层小波分解下的样本个数。SR降维计算如公式(5) 所示[19]:
式中: 为小波分解第i层下第j个样品对应的含水量,%; 为小波分解第i层下所有样品的平均含水量,%; 为小波分解第i层下去除第j个样品前剩余样品的平均含水量,%; 为小波分解第i层下去除第j个样品后剩余样品的平均含水量,%;c为SR处理前样品的光谱总数。
1.7 机器学习回归方法
为构建山楂高光谱数据与其含水量之间的预测模型,本研究系统地对比了四种典型的机器学习回归方法:PLSR[20]、支持向量机回归(Support Vector Regression, SVR)[21]、随机森林回归(Random Forest Regression, RF)[22],以及多层感知机(Multilayer Perceptron, MLP)[23]。数据集按照7∶2∶1的比例随机划分为校准集(Calibration Set)、验证集(Validation Set)和预测集(Prediction Set),以保证模型的泛化能力。对于 PLSR、SVR和RF三种模型,采用网格搜索法(Grid Search)优化关键超参数,目标为验证集上的决定系数(R 2)最大,为了避免模型过拟合,训练集采用十折交叉验证。PLSR以潜变量因子数(n_components)为主要调参对象,搜索范围设定为1~30;SVR采用径向基函数(Radial Basis Function, RBF)作为核函数,调节惩罚系数C(0.1、1、10、100)与核函数带宽gamma(0.01、0.001、0.000 1);RF从集成规模(n_estimators:100和300)、最大树深(max_depth:5、10和15)、最小分裂样本数(min_samples_split:5和10)、叶节点最小样本数(min_samples_leaf:2和5),以及特征选择策略(max_features:sqrt或log2)等方面进行组合优化。
MLP通过结构搜索与训练超参数调节,构建两层隐藏层网络,并优化各层神经元数量。最终确定包含256和128个神经元的网络结构,引入Dropout(0.1)与L2正则化(权重衰减系数1e-4)以抑制过拟合,采用Adam优化器(学习率设为1e-3),激活函数为ReLU。
模型优化过程中,以验证集的R 2为评价指标,选取各算法参数组合中的最优配置。最终,所有模型在独立预测集上通过R 2、平均绝对误差(Mean Absolute Error, MAE)、均方根误差(Root Mean Square Error, RMSE)及相对分析误差(Ratio of Performance to Deviation, RPD)综合评估其预测性能。
1.8 软件
本研究所有光谱数据分析均在Windows 10平台上使用Python 3.9和PyCharm Community进行。PLSR、RF和SVR模型基于scikit-learn实现,MLP模型使用Tensorflow开发。
2 结果与讨论
2.1 光谱特征
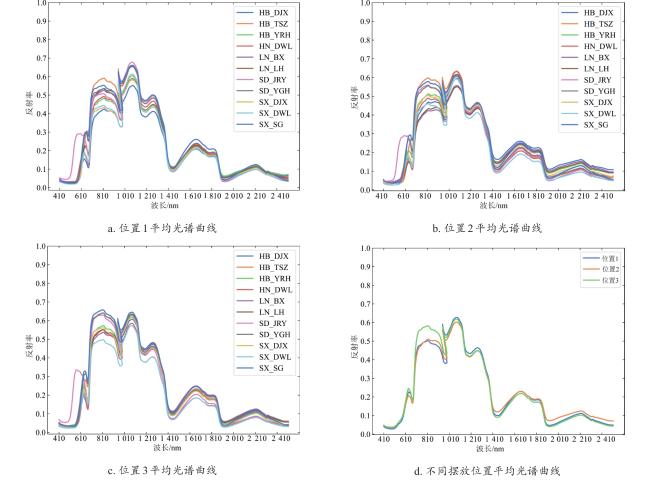
山楂样品的光谱特征如图2,可以看出不同产地、不同品种的山楂,总体光谱趋势一致,但是样品的反射率有一定差异。600~620 nm 反射率光谱吸收与山楂颜色相关色素有关,其中,黄果山楂品种山东金如意(SD_JRY)在600 nm附近显示出明显的吸收峰。670 nm附近的反射率光谱吸收属于植物中类胡萝卜素和叶绿素的吸收光谱[24]。970 nm处的反射率光谱吸收对应于O-H键伸缩振动的一阶倍频[25];1 200 nm附近的反射率光谱吸收带源于O-H伸缩振动与弯曲振动的组合模式[26];1 450 nm处的反射率光谱吸收特征峰为O-H弯曲振动的一阶倍频[26];1 640和1 800 nm的反射率光谱吸收分别对应于C-H伸缩振动和O-H伸缩振动[27];而1 930 nm处的反射率光谱水分子强吸收带则反映了O-H键伸缩振动的组合模式[28]。另外,山楂的摆放位置不同,光谱的反射率也有差异,这可能是由于不同表面方向上的化学成分分布异质性造成的。
2.2 不同预处理方法的性能比较
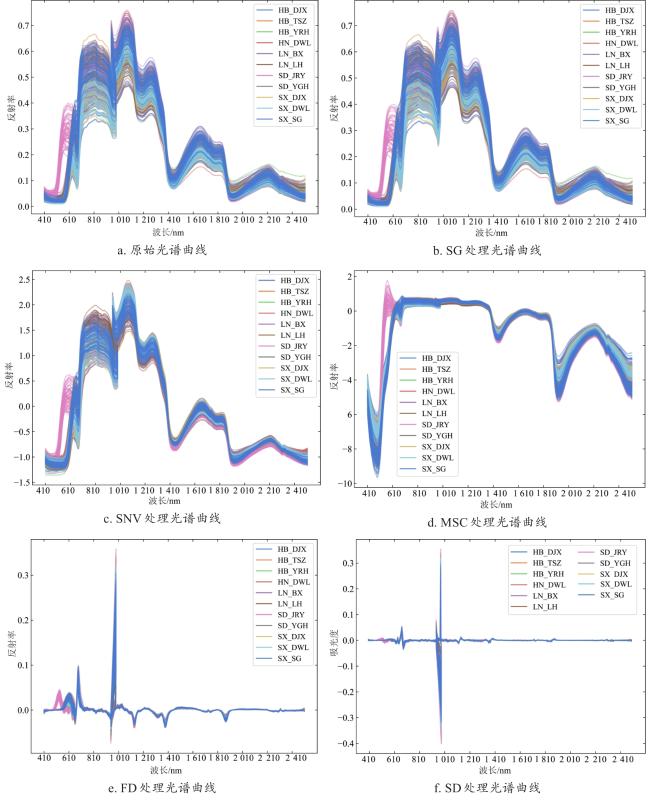
采用SG、MSC、SNV、FD、SD等不同的光谱预处理算法处理山楂光谱,处理后的曲线如图3,可以看出,SG 算法处理前后山楂的光谱曲线变化不大,SNV 和 MSC 处理后山楂光谱曲线的变化趋势相似,但不同产地不同品种的山楂反射率强度明显不同。此外,FD和 SD算法可以有效处理光谱曲线的重叠峰,光谱吸收峰的数量减少,光谱之间的差异增强。
为了选取最佳的预处理算法,以位置1摆放为例,将原始光谱数据和其他5种预处理后的光谱数据作为PLSR的输入,含水量作为PLSR的输出,通过验证集确定最佳潜变量,并使用测试集评估预测性能,进而确定最优的光谱预处理方法。由表1可以看出,不同预处理后,利用光谱建立的山楂含水量预测模型的性能存在差异,其中,利用FD处理后的光谱建立的山楂含水量预测模型的性能最佳,优于利用原始光谱和其他预处理算法处理后的光谱建立的模型。FD-PLSR预测模型的R 2 p、MAE、RMSEP和RPD分别为0.743 4、0.874 6、1.248 1和1.974 0。因此,对经过FD处理后的光谱进行后续的分析。
表1 PLSR模型基于预处理前后光谱数据对山楂水分含量的预测性能Table 1 Prediction performances of PLSR model for hawthorn water content based on spectral data before and after preprocessing |
| 预处理方法 | 潜变量 | 校准集 | 验证集 | 测试集 | |||||||
|---|---|---|---|---|---|---|---|---|---|---|---|
| R 2 C | RMSEC | MAEC | R 2 V | RMSEV | MAEV | R 2 P | RMSEP | MAEP | RPD | ||
| 无 | 24 | 0.777 5 | 1.099 4 | 0.822 0 | 0.726 6 | 1.123 7 | 0.790 5 | 0.717 4 | 1.309 7 | 0.972 7 | 1.881 2 |
| SG | 29 | 0.772 5 | 1.111 8 | 0.832 3 | 0.718 0 | 1.141 2 | 0.822 8 | 0.726 5 | 1.288 5 | 0.969 4 | 1.912 2 |
| MSC | 10 | 0.605 2 | 1.464 6 | 1.136 2 | 0.330 1 | 1.221 8 | 1.391 9 | 0.547 6 | 1.657 2 | 1.287 3 | 1.486 7 |
| SNV | 20 | 0.681 5 | 1.315 5 | 0.994 2 | 0.647 9 | 1.275 3 | 0.970 6 | 0.594 7 | 1.568 5 | 1.151 5 | 1.570 8 |
| FD | 25 | 0.870 7 | 0.838 2 | 0.626 6 | 0.670 2 | 1.234 3 | 0.918 8 | 0.743 4 | 1.248 1 | 0.874 6 | 1.974 0 |
| SD | 29 | 0.872 7 | 0.831 6 | 0.621 8 | 0.631 4 | 1.304 9 | 0.957 1 | 0.731 5 | 1.276 8 | 0.898 7 | 1.929 7 |
2.3 不同摆放位置和光谱范围对模型性能的影响
表2 在不同摆放位置和不同光谱范围时不同机器学习算法的最佳参数Table 2 Optimal parameters of different machine learning algorithms at different placement positions and in different spectral ranges |
| 摆放位置 | 光谱范围 | 回归方法 | 最佳参数 |
|---|---|---|---|
| 位置1 | VNIR | PLSR | n_components= 28 |
| SVR | C= 10, gamma= 0.001 | ||
| RF | max_depth= 10, max_features= sqrt, min_samples_leaf= 2, min_samples_split= 10, n_estimators= 100 | ||
| SWIR | PLSR | n_components= 8 | |
| SVR | C= 100, gamma= 0.000 1 | ||
| RF | max_depth= 15, max_features= sqrt, min_samples_leaf= 2, min_samples_split= 5, n_estimators= 300 | ||
| VNIR+SWIR | PLSR | n_components= 10 | |
| SVR | C= 100, gamma= 0.000 1 | ||
| RF | max_depth= 10, max_features= sqrt, min_samples_leaf= 2, min_samples_split= 5, n_estimators= 300 | ||
| 位置2 | VNIR | PLSR | n_components= 21 |
| SVR | C= 100, gamma= 0.001 | ||
| RF | max_depth= 10, max_features= sqrt, min_samples_leaf= 2, min_samples_split= 5, n_estimators= 300 | ||
| SWIR | PLSR | n_components= 7 | |
| SVR | C= 100, gamma= 0.000 1 | ||
| RF | max_depth= 15, max_features= sqrt, min_samples_leaf= 2, min_samples_split= 5, n_estimators= 300 | ||
| VNIR+SWIR | PLSR | n_components= 13 | |
| SVR | C= 10, gamma= 0.001 | ||
| RF | max_depth= 15, max_features= sqrt, min_samples_leaf= 2, min_samples_split= 5, n_estimators= 300 | ||
| 位置3 | VNIR | PLSR | n_components= 24 |
| SVR | C= 10, gamma= 0.001 | ||
| RF | max_depth= 15, max_features= sqrt, min_samples_leaf= 2, min_samples_split= 10, n_estimators= 100 | ||
| SWIR | PLSR | n_components= 9 | |
| SVR | C= 100, gamma= 0.000 1 | ||
| RF | max_depth= 10, max_features= sqrt, min_samples_leaf= 2, min_samples_split= 5, n_estimators= 300 | ||
| VNIR+SWIR | PLSR | n_components= 12 | |
| SVR | C= 100, gamma= 0.000 1 | ||
| RF | max_depth= 15, max_features= sqrt, min_samples_leaf= 2, min_samples_split= 5, n_estimators= 100 | ||
| 综合位置 | VNR | PLSR | n_components= 29 |
| SVR | C= 100, gamma= 0.001 | ||
| RF | max_depth= 15, max_features= sqrt, min_samples_leaf= 2, min_samples_split= 5, n_estimators= 300 | ||
| SWIR | PLSR | n_components= 28 | |
| SVR | C= 10, gamma= 0.001 | ||
| RF | max_depth= 15, max_features= sqrt, min_samples_leaf= 2, min_samples_split= 5, n_estimators= 300 | ||
| VNIR+SWIR | PLSR | n_components= 25 | |
| SVR | C= 100, gamma= 0.000 1 | ||
| RF | max_depth= 15, max_features= sqrt, min_samples_leaf= 2, min_samples_split= 5, n_estimators= 300 |
表3 在不同摆放位置和不同光谱范围时不同机器学习算法对水分含量的预测性能Table 3 Prediction performances of different machine learning algorithms for moisture content at different placement positions and different spectral ranges |
| 摆放位置 | 光谱范围 | 回归方法 | 校准集 | 验证集 | 测试集 | |||||||
|---|---|---|---|---|---|---|---|---|---|---|---|---|
| R 2 C | RMSEC | MAEC | R 2 V | RMSEV | MAEV | R 2 P | RMSEP | MAEp | RPD | |||
| 位置1 | VNIR | PLSR | 0.784 9 | 1.034 6 | 0.813 5 | 0.618 7 | 1.507 3 | 1.156 0 | 0.327 1 | 1.915 6 | 1.443 0 | 1.219 1 |
| SVR | 0.687 1 | 1.247 9 | 0.902 2 | 0.561 3 | 1.616 9 | 1.221 2 | 0.563 6 | 1.542 7 | 1.197 6 | 1.513 7 | ||
| MLP | 0.835 3 | 0.905 3 | 0.718 2 | 0.542 6 | 1.650 9 | 1.251 9 | 0.492 9 | 1.662 8 | 1.349 2 | 1.404 3 | ||
| RF | 0.830 3 | 0.919 1 | 0.715 0 | 0.475 9 | 1.767 3 | 1.314 9 | 0.518 6 | 1.620 2 | 1.222 6 | 1.441 3 | ||
| SWIR | PLSR | 0.829 4 | 0.974 9 | 0.693 9 | 0.632 7 | 1.347 4 | 1.001 0 | 0.719 4 | 1.093 5 | 0.877 3 | 1.887 9 | |
| SVR | 0.861 0 | 0.879 9 | 0.493 6 | 0.644 7 | 1.325 2 | 0.951 8 | 0.781 4 | 0.965 3 | 0.751 6 | 2.138 8 | ||
| MLP | 0.928 8 | 0.629 5 | 0.459 5 | 0.660 8 | 1.294 7 | 0.940 5 | 0.753 7 | 1.024 5 | 0.785 6 | 2.015 0 | ||
| RF | 0.896 3 | 0.760 0 | 0.570 6 | 0.450 9 | 1.647 4 | 1.201 3 | 0.534 4 | 1.408 7 | 1.125 5 | 1.465 5 | ||
| VNIR+SWIR | PLSR | 0.883 3 | 0.775 9 | 0.572 2 | 0.752 0 | 1.075 6 | 0.817 9 | 0.711 4 | 1.361 8 | 1.018 3 | 1.861 4 | |
| SVR | 0.902 2 | 0.710 0 | 0.368 1 | 0.752 5 | 1.074 6 | 0.786 9 | 0.739 6 | 1.293 5 | 0.906 6 | 1.959 7 | ||
| MLP | 0.929 6 | 0.602 1 | 0.470 6 | 0.708 4 | 1.166 2 | 0.939 5 | 0.683 9 | 1.425 0 | 1.121 0 | 1.778 7 | ||
| RF | 0.905 6 | 0.697 7 | 0.516 7 | 0.568 5 | 1.418 8 | 1.115 7 | 0.517 6 | 1.760 5 | 1.382 2 | 1.439 8 | ||
| 位置2 | VNIR | PLSR | 0.787 6 | 1.006 8 | 0.784 7 | 0.727 5 | 1.380 5 | 1.057 0 | 0.660 5 | 1.497 2 | 1.187 2 | 1.716 2 |
| SVR | 0.853 8 | 0.835 2 | 0.506 1 | 0.686 6 | 1.480 5 | 1.132 9 | 0.682 8 | 1.447 0 | 1.077 7 | 1.775 6 | ||
| MLP | 0.866 3 | 0.798 5 | 0.624 9 | 0.630 3 | 1.607 7 | 1.224 0 | 0.679 2 | 1.455 2 | 1.131 2 | 1.765 5 | ||
| RF | 0.890 3 | 0.723 6 | 0.530 9 | 0.511 3 | 1.848 6 | 1.408 9 | 0.513 4 | 1.792 2 | 1.422 3 | 1.433 6 | ||
| SWIR | PLSR | 0.787 0 | 1.081 2 | 0.779 4 | 0.846 0 | 1.137 1 | 0.825 2 | 0.803 1 | 1.086 2 | 0.840 4 | 2.253 6 | |
| SVR | 0.841 4 | 0.933 1 | 0.537 7 | 0.742 4 | 1.068 2 | 0.724 2 | 0.860 5 | 0.914 2 | 0.711 1 | 2.677 6 | ||
| MLP | 0.890 1 | 0.776 5 | 0.534 2 | 0.632 6 | 1.275 6 | 0.938 2 | 0.763 4 | 1.190 5 | 0.901 5 | 2.056 0 | ||
| RF | 0.901 4 | 0.735 8 | 0.556 4 | 0.452 1 | 1.557 9 | 1.163 6 | 0.569 0 | 1.607 1 | 1.222 1 | 1.523 2 | ||
| VNIR+SWIR | PLSR | 0.871 6 | 0.794 3 | 0.597 2 | 0.777 0 | 1.225 2 | 0.857 8 | 0.749 8 | 1.263 8 | 0.902 6 | 1.999 1 | |
| SVR | 0.925 6 | 0.604 6 | 0.276 9 | 0.715 2 | 1.384 7 | 0.948 3 | 0.821 2 | 1.068 4 | 0.781 5 | 2.364 8 | ||
| MLP | 0.917 6 | 0.636 2 | 0.490 1 | 0.662 0 | 1.508 5 | 1.114 7 | 0.752 8 | 1.256 0 | 1.014 2 | 2.011 4 | ||
| RF | 0.912 2 | 0.657 0 | 0.478 3 | 0.539 6 | 1.760 6 | 1.351 4 | 0.574 5 | 1.648 0 | 1.268 3 | 1.533 1 | ||
| 位置3 | VNIR | PLSR | 0.784 5 | 1.053 5 | 0.795 4 | 0.609 1 | 1.477 5 | 1.136 8 | 0.768 6 | 1.142 3 | 0.851 6 | 2.078 9 |
| SVR | 0.711 8 | 1.218 2 | 0.876 1 | 0.491 4 | 1.685 3 | 1.366 8 | 0.702 6 | 1.295 0 | 1.033 3 | 1.833 8 | ||
| MLP | 0.840 2 | 0.907 0 | 0.712 9 | 0.435 5 | 1.775 3 | 1.443 7 | 0.520 8 | 1.643 7 | 1.317 0 | 1.444 7 | ||
| RF | 0.817 0 | 0.970 8 | 0.739 2 | 0.381 3 | 1.858 7 | 1.466 3 | 0.593 4 | 1.514 2 | 1.168 4 | 1.568 3 | ||
| SWIR | PLSR | 0.837 2 | 0.951 5 | 0.695 9 | 0.683 9 | 1.276 1 | 0.912 3 | 0.632 2 | 1.193 0 | 0.845 5 | 1.648 8 | |
| SVR | 0.853 9 | 0.901 2 | 0.528 2 | 0.705 6 | 1.231 6 | 0.896 1 | 0.725 4 | 1.030 7 | 0.764 6 | 1.908 5 | ||
| MLP | 0.881 1 | 0.812 9 | 0.613 5 | 0.694 5 | 1.254 3 | 0.920 4 | 0.670 7 | 1.128 6 | 0.835 2 | 1.742 8 | ||
| RF | 0.885 9 | 0.796 5 | 0.611 7 | 0.395 6 | 1.764 5 | 1.375 5 | 0.444 5 | 1.466 0 | 1.129 9 | 1.341 8 | ||
| VNIR+SWIR | PLSR | 0.877 1 | 0.787 5 | 0.583 4 | 0.696 3 | 1.399 1 | 1.072 8 | 0.815 9 | 0.956 8 | 0.718 2 | 2.330 5 | |
| SVR | 0.880 6 | 0.776 0 | 0.424 2 | 0.730 1 | 1.319 0 | 0.959 0 | 0.849 3 | 0.865 6 | 0.669 0 | 2.576 0 | ||
| MLP | 0.901 7 | 0.704 0 | 0.521 5 | 0.688 3 | 1.417 3 | 1.043 9 | 0.697 4 | 1.226 3 | 0.917 1 | 1.818 1 | ||
| RF | 0.903 3 | 0.698 3 | 0.527 3 | 0.461 5 | 1.863 1 | 1.487 3 | 0.599 0 | 1.412 0 | 1.062 3 | 1.579 2 | ||
| 综合位置 | VNR | PLSR | 0.671 5 | 1.314 6 | 1.027 2 | 0.583 6 | 1.482 8 | 1.135 9 | 0.592 4 | 1.533 8 | 1.191 5 | 1.566 3 |
| SVR | 0.793 3 | 1.042 8 | 0.686 8 | 0.633 0 | 1.392 2 | 1.042 1 | 0.663 8 | 1.3931 | 1.065 9 | 1.724 5 | ||
| MLP | 0.815 6 | 0.984 9 | 0.773 6 | 0.553 5 | 1.535 4 | 1.147 2 | 0.595 9 | 1.527 0 | 1.191 3 | 1.573 2 | ||
| RF | 0.898 6 | 0.730 4 | 0.549 8 | 0.477 1 | 1.661 8 | 1.259 3 | 0.447 8 | 1.785 2 | 1.374 8 | 1.345 7 | ||
| SWIR | PLSR | 0.837 2 | 0.948 9 | 0.712 8 | 0.680 0 | 1.253 4 | 0.976 0 | 0.707 0 | 1.181 8 | 0.918 7 | 1.847 4 | |
| SVR | 0.844 3 | 0.928 1 | 0.550 1 | 0.736 0 | 1.138 4 | 0.846 2 | 0.758 3 | 1.073 5 | 0.788 0 | 2.033 9 | ||
| MLP | 0.906 6 | 0.718 5 | 0.551 7 | 0.701 1 | 1.211 0 | 0.904 1 | 0.699 7 | 1.196 4 | 0.910 6 | 1.824 8 | ||
| RF | 0.898 2 | 0.750 5 | 0.567 2 | 0.498 4 | 1.569 3 | 1.231 7 | 0.455 9 | 1.610 5 | 1.273 3 | 1.355 6 | ||
| VNIR+SWIR | PLSR | 0.870 7 | 0.838 2 | 0.626 6 | 0.670 2 | 1.234 3 | 0.918 8 | 0.743 4 | 1.248 1 | 0.874 6 | 1.974 0 | |
| SVR | 0.862 2 | 0.865 4 | 0.540 0 | 0.722 6 | 1.131 8 | 0.801 2 | 0.772 7 | 1.174 7 | 0.816 9 | 2.097 4 | ||
| MLP | 0.874 3 | 0.826 3 | 0.636 9 | 0.670 8 | 1.232 9 | 0.936 4 | 0.750 3 | 1.231 0 | 0.885 3 | 2.001 4 | ||
| RF | 0.913 7 | 0.684 7 | 0.513 9 | 0.558 5 | 1.428 0 | 1.086 0 | 0.548 5 | 1.655 6 | 1.278 7 | 1.488 2 | ||
2.3.1 摆放位置对模型性能的影响
当山楂固定摆放位置且单面朝上时,在不同摆放位置下,不同光谱范围所建立的含水量预测模型表现出显著差异。在 VNIR 光谱范围内,当样品以位置3摆放时,基于PLSR、RF和SVR方法构建的模型均表现出最优的预测性能;而在 SWIR 光谱范围内,采用位置2摆放的样品在四种回归模型中均获得了最佳预测结果。这可能是由于SWIR波段主要反映样品内部的化学组成信息,受表面形貌的干扰较小,且具有更强的穿透能力。在位置2摆放时,虽然上表面为萼片区域,其表皮结构相对复杂,但对应的是果实中部区域,该区域组织结构更致密、水分分布更具代表性,有助于提升模型对含水量的响应能力。另外,当将三个摆放位置的数据融合,即模拟山楂样品随机摆放的情况时,模型整体预测性能低于基于最佳摆放位置所构建的模型。说明,将山楂样品按照最佳检测位置统一摆放,可以提高实际应用过程中光谱建模的稳定性与准确性。
2.3.2 光谱范围对模型性能的影响
对于不同的光谱范围,四种回归方法在山楂不同的摆放位置时,基于SWIR光谱数据建立的模型性能均要优于VNIR光谱范围,这是由于SWIR光谱范围包含更多的化合物官能团信息,具有更强的成分识别能力。然而值得注意的是,在融合两个范围的光谱数据后,当样品摆放在位置2(果柄朝下)时,模型预测性能未见提升,反而有所下降。这或许是因为该方向下的可见表面为山楂的萼片区域,其结构复杂、表面凹凸不平且色差明显,易致使VNIR波段中的光谱信号不稳定。由于VNIR波段对表面纹理和颜色变化更为敏感,其较低的信噪比可能在融合过程中引入冗余或干扰信息,进而削弱SWIR波段对含水量的有效表达。相比之下,当样品摆放在位置3(果柄朝上)时,光谱采集面为去柄部位,此处表面较为平整、结构均匀,光照条件良好,有利于获取稳定的VNIR信号。在此条件下,VNIR与SWIR数据的互补性能够得到更好的体现,从而提升融合模型的预测性能。
对于四种回归方法,可以看出,无论何种摆放位置和光谱范围,SVR模型的性能均最佳。山楂按照位置2摆放,在SWIR光谱范围,采用SVR回归方法,对于含水量的预测性能最佳,R 2 p为0.860 5,MAEp为0.711 1,RMSEp为0.914 2,PRD为2.677 6,能很好地实现山楂含水量的预测。
2.4 光谱数据的降维
本研究采用SPA、CARS、VISSA和DWT-SR来降低光谱数据的维度。SPA、CARS和VISSA提取的按照位置2摆放的SWIR范围光谱数据与含水量的相关性特征结果如图4所示。可以看出,通过 SPA、CARS和 VISSA 算法提取的特征波段数量分别为35、77和176。
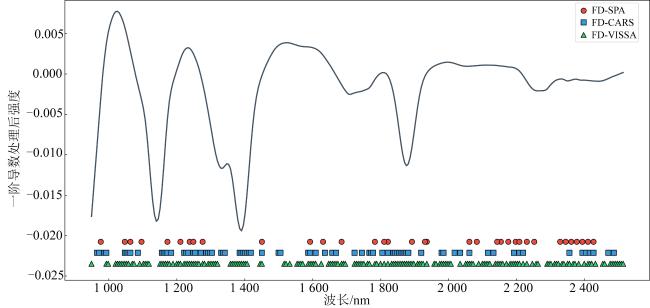
表4显示了由 SPA、CARS和 VISSA 进行一阶导数处理后提取的SWIR范围光谱特征建立的SVR模型的结果。可以看出,利用不同降维算法提取特征建立的山楂含水量预测模型的性能有所不同。其中FD集合CARS算法提取的特征建模数据模型性能最好,最佳模型的R 2 p、RMSEp和RPD分别为0.848 9、0.951 5和2.572 6。与基于全波段光谱数据构建的模型相比,三种特征选择方法 SPA、CARS 和 VISSA 分别将波段数量减少了87.85%、73.26%和38.89%。在测试集上的表现中,R 2 p分别下降了29.76%、1.35%和2.24%,RMSEp分别增加68.42%、4.08%和6.72%,RPD分别下降了40.61%、3.91%和6.28%。其中,SPA提取的特征波段所构建模型的预测性能最差,主要原因在于SPA为无监督降维方法,其变量选择过程未利用目标变量信息,因此难以有效提取与水分含量显著相关的特征波段,导致模型预测能力显著下降。相比之下,CARS与VISSA均为有监督的特征选择方法,波段筛选过程中引入了目标变量,有助于保留与水分相关的光谱特征,因此尽管模型精度较全波段略有下降,其预测性能仍处于可接受范围内。然而,需要指出的是,CARS和VISSA提取的特征波段数量仍相对较多,若应用于实际工业检测场景,可能会带来较高的设备和计算成本。因此,进一步开发能够在显著减少波段数量的同时保持较高预测精度的特征选择方法,仍具有重要的研究意义和应用价值。
表4 基于三种降维算法处理的SWIR光谱对水分含量的预测性能Table 4 Prediction performances of water content based on SWIR spectra processed by three dimensionality reduction algorithms |
| 数据处理方法 | 特征数 | 校准集 | 验证集 | 测试集 | |||||||
|---|---|---|---|---|---|---|---|---|---|---|---|
| R 2 C | RMSEC | MAEC | R 2 V | RMSEV | MAEV | R 2 P | RMSEP | MAEP | RPD | ||
| FD-SPA | 35 | 0.584 3 | 1.510 6 | 1.043 0 | 0.524 9 | 1.450 7 | 1.096 9 | 0.604 4 | 1.539 7 | 1.169 2 | 1.589 8 |
| FD-CARS | 77 | 0.841 8 | 0.931 7 | 0.554 2 | 0.699 9 | 1.152 9 | 0.824 4 | 0.848 9 | 0.951 5 | 0.726 9 | 2.572 6 |
| FD-VISSA | 176 | 0.953 2 | 0.507 1 | 0.228 5 | 0.722 3 | 1.109 0 | 0.743 5 | 0.841 2 | 0.975 6 | 0.765 7 | 2.509 1 |
2.5 使用 DWT-SR 进行降维和建模
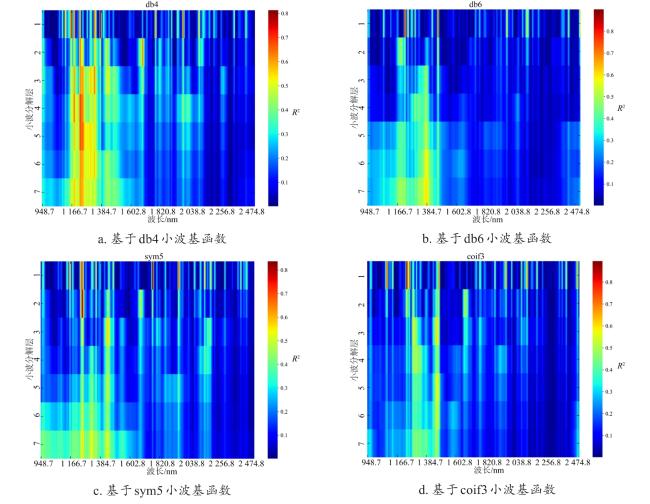
DWT-SR算法主要分为小波多尺度变换和数据降维两个阶段。此外,分别采用db4、db6、sym5和coif3函数作为小波基函数,小波多尺度变换的最大分解层为7。其中,相关性通过决定系数R 2进行评估,其随波长变化的结果见图5。结合逐步回归算法分析,db4,db6,sym5和coif3对应的最佳分解层均为1。可以看出,与含水量相关性决定系数大的波长主要集中在1 000~1 200 nm,1 300~1 600 nm,1 800~1 970 nm,2 200~2 300 nm。
利用DWT-SR策略对光谱数据进行降维,利用降维后的光谱特征建立含水量预测的SVR模型,结果如表5所示,可以看出,基于DWT-SR小波基函数db6得到的光谱特征(1 075.55,1 117.83,1 191.81,1 255.23,1 318.64,1 329.21,1 434.91,1 572.31,1 604.01,1 825.97,2 047.92,2 174.76,2 227.60,2 238.17,2 280.45,2 301.59,2 512.97)建立的含水量预测SVR模型性能最佳,R 2 p、RMSEp和RPD分别为0.857 1、0.925 2和2.645 7,性能和基于全波长建立的模型的预测性能相当。一方面,该条件下提取的特征数量为22,相比全波长降低了92.36%,低于SPA、CARS、IRIV和VISSA算法提取的特征数量;另一方面,利用DWT-SR算法提取的特征建立的SVR模型性能优于利用SPA、CARS和VISSA算法提取的特征建立的SVR模型性能,R 2 p为0.857 1,RMSEp为0.925 2,MAEp为0.669 2,RPD为2.645 7,这表明DWT-SR策略在特征提取和模型性能优化方面具有显著优势。
表5 基于DWT-SR处理的SWIR光谱对水分含量的预测性能Table 5 Prediction performance of water content based on SWIR spectra processed by DWT-SR |
| 小波基函数 | 特征数 | 校准集 | 验证集 | 测试集 | |||||||
|---|---|---|---|---|---|---|---|---|---|---|---|
| R 2 C | RMSEC | MAEC | R 2 V | RMSEV | MAEV | R 2 P | RMSEP | MAEP | RPD | ||
| db4 | 16 | 0.769 8 | 1.124 1 | 0.795 1 | 0.698 8 | 1.155 0 | 1.053 4 | 0.829 8 | 1.010 0 | 0.779 0 | 2.423 7 |
| db6 | 17 | 0.785 8 | 1.084 4 | 0.653 0 | 0.715 6 | 1.122 3 | 1.060 5 | 0.857 1 | 0.925 2 | 0.669 2 | 2.645 7 |
| sym5 | 22 | 0.795 9 | 1.058 3 | 0.679 5 | 0.721 7 | 1.110 3 | 1.036 2 | 0.829 0 | 1.012 2 | 0.784 5 | 2.418 3 |
| coif3 | 19 | 0.765 5 | 1.134 6 | 0.726 6 | 0.635 6 | 1.270 5 | 1.156 2 | 0.826 0 | 1.021 2 | 0.750 1 | 2.397 1 |
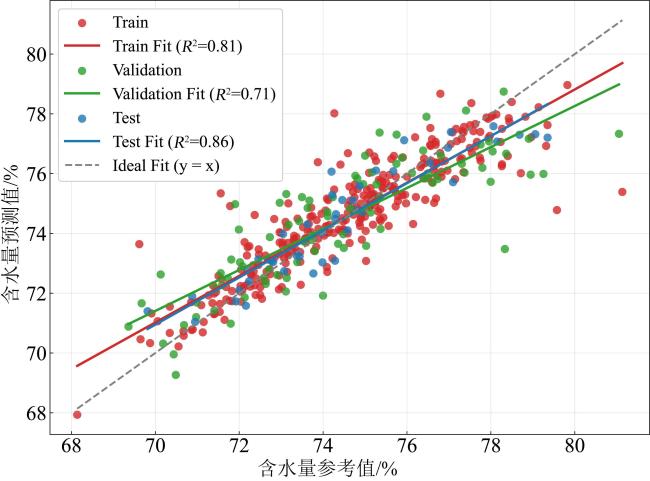
为了更直观地展示模型的预测性能,绘制了最佳 DWT-SR-SVR模型的回归拟合曲线的散点图(图6),以展示预测值与实际值的相关性。可以看出,最佳 DWT-SR-SVR 模型对含水量的回归拟合呈现出良好的线性趋势。大部分数据点密集分布在45°对角线附近,表明预测值与实际值高度一致,具有良好的拟合能力与泛化性能。
3 结 论
本研究以山楂为对象,探索了基于高光谱成像技术结合机器学习算法的山楂水分含量快速无损检测方法。首先,基于图像处理技术构建高光谱图像分割算法,用于提取果实的平均反射光谱。其次,采用五种光谱预处理方法(SG、MSC、SNV、FD 和SD)对原始光谱数据进行处理,基于最佳光谱预处理方法,构建PLSR、SVR、RF和MLP四种典型回归模型,系统比较不同摆放方式(果柄侧面、果柄朝上、果柄朝下及三者融合)与光谱范围(VNIR、SWIR、VNIR+SWIR)对山楂含水量预测性能的影响。结果表明,当山楂果柄朝下(位置2)摆放、采用SWIR波段范围经过 FD预处理的光谱数据,作为SVR输入的特征变量时,预测性能最优(R 2 p=0.860 5、MAEp = 0.711 1、RMSEp =0.914 2、RPD=2.677 6)。在此基础上,进一步对性能最优的组合进行特征波段提取,采用 SPA、CARS、VISSA和DWT-SR 四种变量筛选算法进行降维,以降低数据冗余。其中,DWT-SR 方法在小波第一层分解下,选用db6作为小波基函数,最终筛选出 17个关键特征波段,所构建的 SVR 模型在预测集上仍保持较高性能(R 2 p=0.857 1、MAEp = 0.669 2、RMSEp =0.925 2、RPD=2.645 7)。
本研究验证了高光谱成像结合机器学习算法在山楂含水量快速无损检测中的可行性和实用价值,为果品品质在线监测及智能分选提供了理论依据与技术支持。与传统方法通常需要对样品进行干燥、研磨或化学预处理不同,本研究基于山楂原形果实,建立了一种快速、无损且高通量的检测框架,显著提升了检测效率与操作便捷性。尤其在水分含量预测方面,所提出的方法完全非侵入性,避免了对样品的破坏,保持了果实的完整性。这一特点使其在山楂采后加工、储藏及流通等环节的实时质量监控中具有高度的实用价值和应用前景。未来工作将进一步挖掘高光谱的空间与光谱融合特性,结合迁移学习策略,扩展至不同年份与产地的样品,以增强模型的泛化能力和跨批次适应性。


