Smart Agriculture ›› 2025, Vol. 7 ›› Issue (4): 95-107.doi: 10.12133/j.smartag.SA202505033
• Topic--Intelligent Sensing and Grading of Agricultural Product Quality • Previous Articles Next Articles
BAI Ruibin1, WANG Hui1, WANG Hongpeng2, HONG Jiashun3, ZHOU Junhui1, YANG Jian1,3( )
)
Received:2025-05-29
Online:2025-07-30
Foundation items:National Key R&D Program of China(2024YFC3506800); Scientific and Technological Innovation Project of China Academy of Chinese Medical Sciences(CI2023E002); Major Increase and Decrease in Expenditure at The Central Level(2060302); National Administration of Traditional Chinese Medicine High-level Key Discipline Construction Project of Traditional Chinese Medicine(ZYYZDXK-2023244); China Agricultural Research System of MOF and MARA(CARS-21); Excellent Young Scientists Cultivation Program of China Academy of Chinese Medical Sciences(ZZ16-YQ-040); Independent Research Project of National Resource Center for Chinese Materia Medica, China Academy of Chinese Medical Sciences(ZZXT202312)
About author:BAI Ruibin, E-mail: bairuibin2022@163.com
corresponding author:
CLC Number:
BAI Ruibin, WANG Hui, WANG Hongpeng, HONG Jiashun, ZHOU Junhui, YANG Jian. Rapid and Non-Destructive Analysis Method of Hawthorn Moisture Content Based on Hyperspectral Imaging Technology[J]. Smart Agriculture, 2025, 7(4): 95-107.
Add to citation manager EndNote|Ris|BibTeX
URL: https://www.smartag.net.cn/EN/10.12133/j.smartag.SA202505033
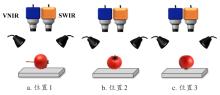
Fig. 1
Schematic diagram of different placement positions of hawthorn
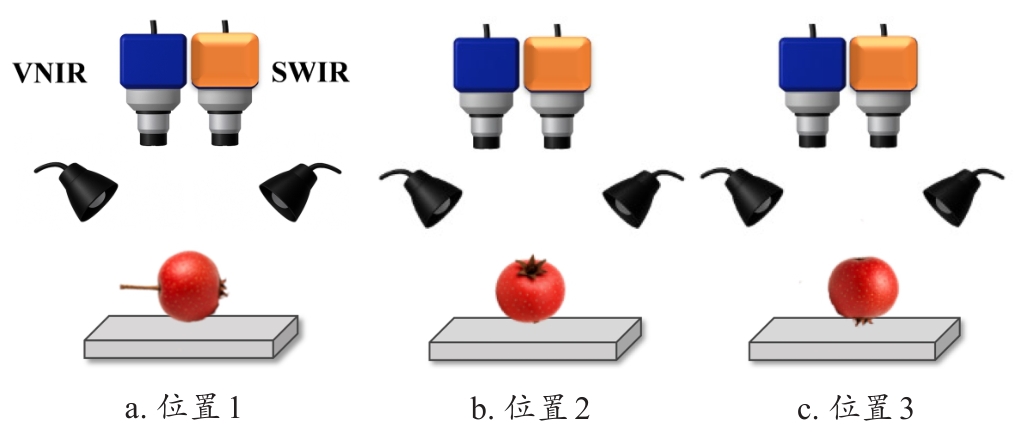
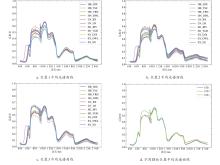
Fig. 2
Spectral reflectance curves of hawthorn at different positions
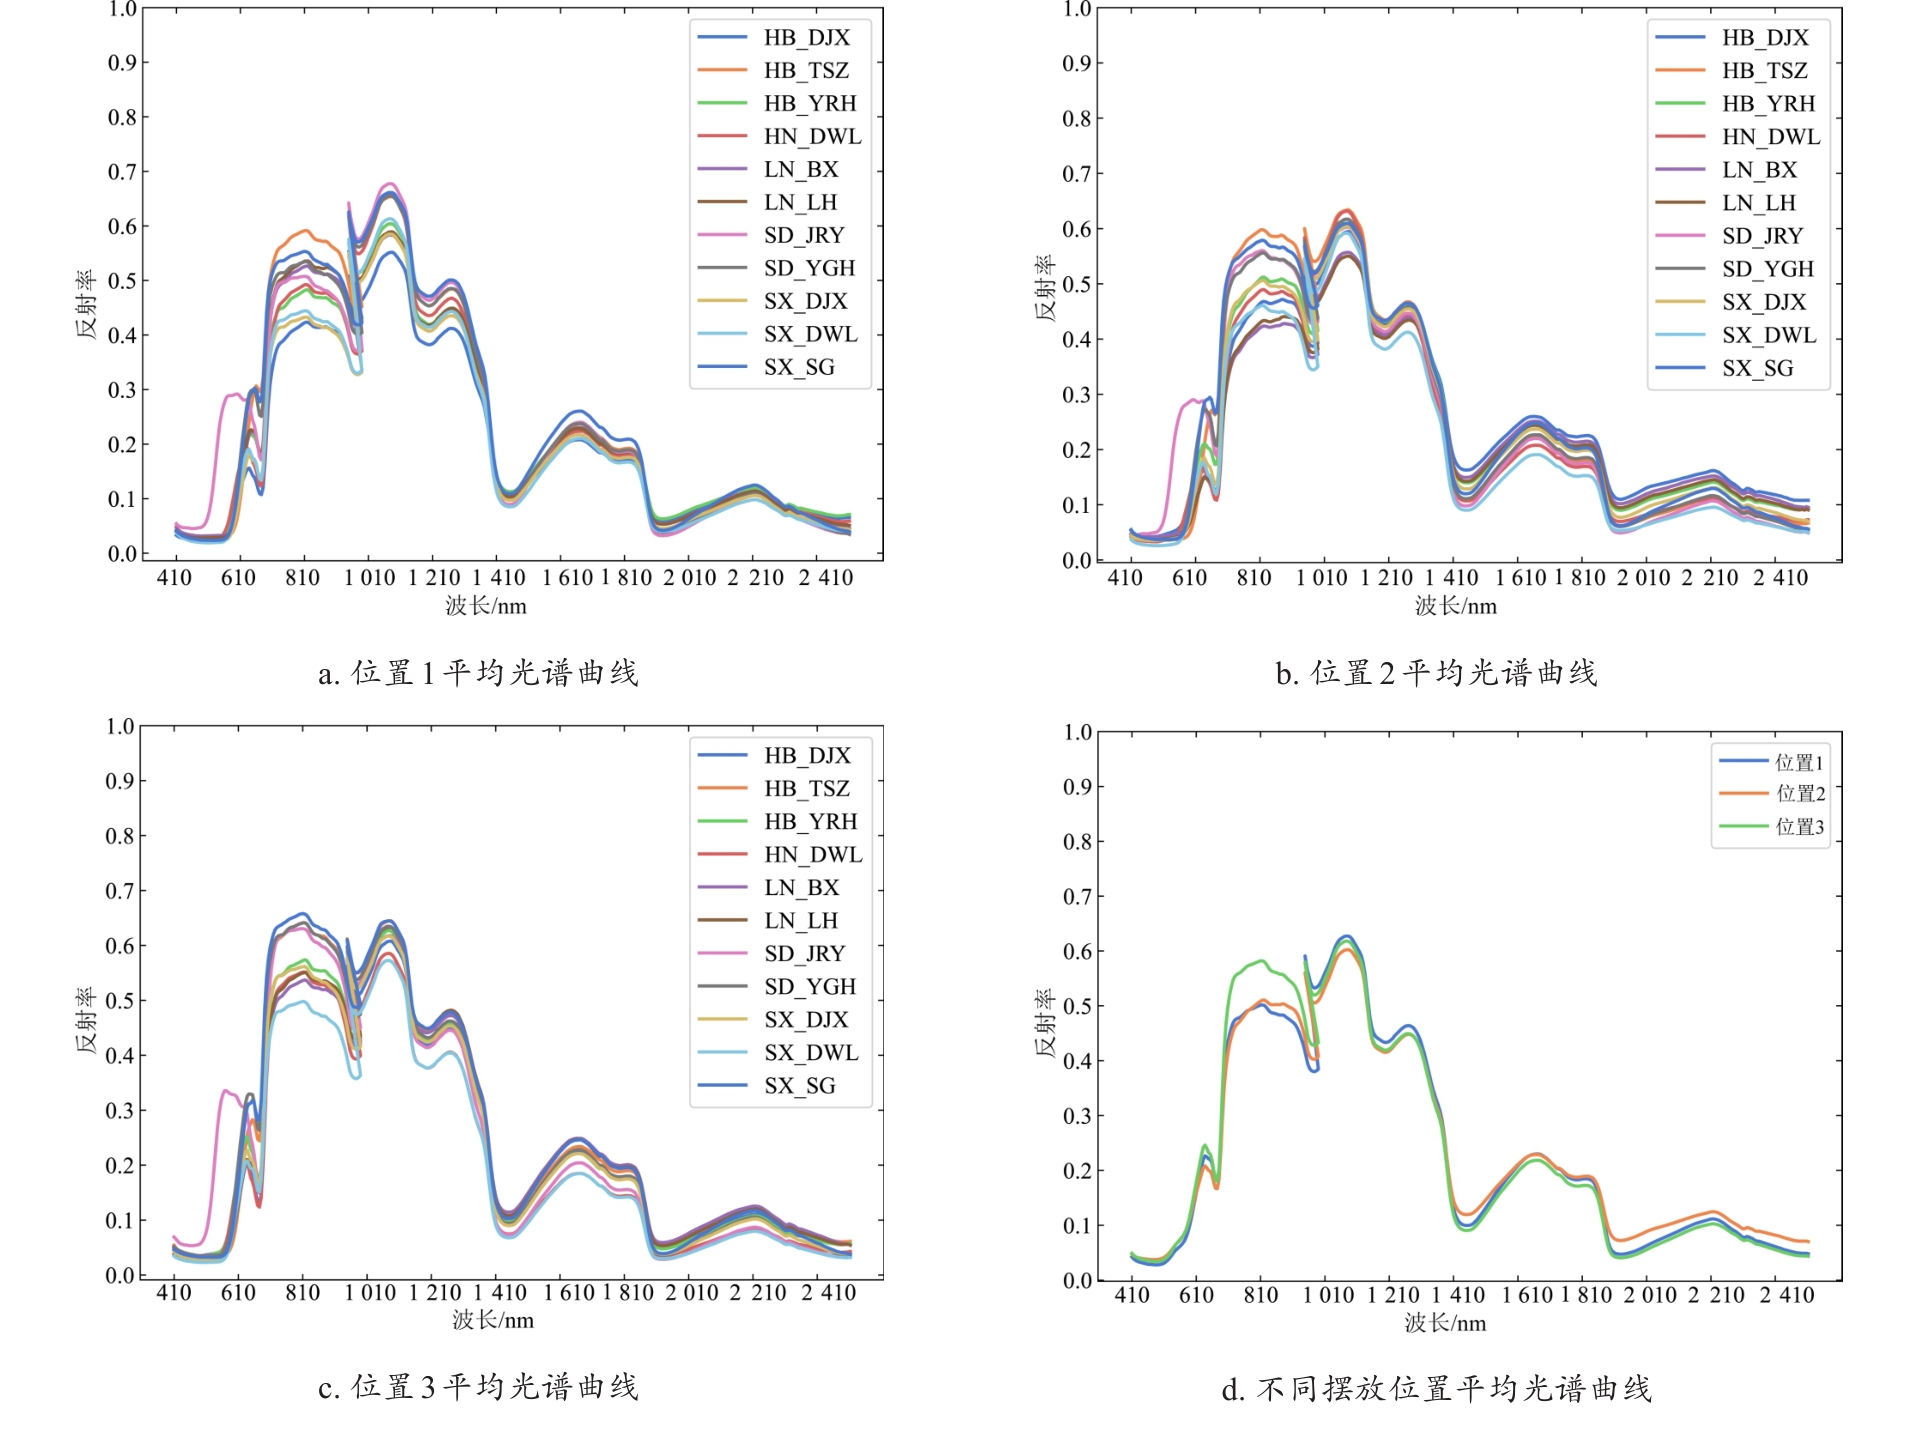
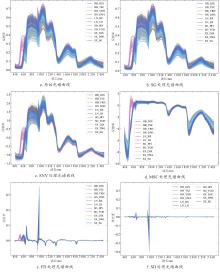
Fig. 3
Spectral reflectance curves of hawthorn after different pretreatments (taking position 1 as an example)

Table 1
Prediction performances of PLSR model for hawthorn water content based on spectral data before and after preprocessing
| 预处理方法 | 潜变量 | 校准集 | 验证集 | 测试集 | |||||||
|---|---|---|---|---|---|---|---|---|---|---|---|
| R 2 C | RMSEC | MAEC | R 2 V | RMSEV | MAEV | R 2 P | RMSEP | MAEP | RPD | ||
| 无 | 24 | 0.777 5 | 1.099 4 | 0.822 0 | 0.726 6 | 1.123 7 | 0.790 5 | 0.717 4 | 1.309 7 | 0.972 7 | 1.881 2 |
| SG | 29 | 0.772 5 | 1.111 8 | 0.832 3 | 0.718 0 | 1.141 2 | 0.822 8 | 0.726 5 | 1.288 5 | 0.969 4 | 1.912 2 |
| MSC | 10 | 0.605 2 | 1.464 6 | 1.136 2 | 0.330 1 | 1.221 8 | 1.391 9 | 0.547 6 | 1.657 2 | 1.287 3 | 1.486 7 |
| SNV | 20 | 0.681 5 | 1.315 5 | 0.994 2 | 0.647 9 | 1.275 3 | 0.970 6 | 0.594 7 | 1.568 5 | 1.151 5 | 1.570 8 |
| FD | 25 | 0.870 7 | 0.838 2 | 0.626 6 | 0.670 2 | 1.234 3 | 0.918 8 | 0.743 4 | 1.248 1 | 0.874 6 | 1.974 0 |
| SD | 29 | 0.872 7 | 0.831 6 | 0.621 8 | 0.631 4 | 1.304 9 | 0.957 1 | 0.731 5 | 1.276 8 | 0.898 7 | 1.929 7 |
Table 2
Optimal parameters of different machine learning algorithms at different placement positions and in different spectral ranges
| 摆放位置 | 光谱范围 | 回归方法 | 最佳参数 |
|---|---|---|---|
| 位置1 | VNIR | PLSR | n_components= 28 |
| SVR | C= 10, gamma= 0.001 | ||
| RF | max_depth= 10, max_features= sqrt, min_samples_leaf= 2, min_samples_split= 10, n_estimators= 100 | ||
| SWIR | PLSR | n_components= 8 | |
| SVR | C= 100, gamma= 0.000 1 | ||
| RF | max_depth= 15, max_features= sqrt, min_samples_leaf= 2, min_samples_split= 5, n_estimators= 300 | ||
| VNIR+SWIR | PLSR | n_components= 10 | |
| SVR | C= 100, gamma= 0.000 1 | ||
| RF | max_depth= 10, max_features= sqrt, min_samples_leaf= 2, min_samples_split= 5, n_estimators= 300 | ||
| 位置2 | VNIR | PLSR | n_components= 21 |
| SVR | C= 100, gamma= 0.001 | ||
| RF | max_depth= 10, max_features= sqrt, min_samples_leaf= 2, min_samples_split= 5, n_estimators= 300 | ||
| SWIR | PLSR | n_components= 7 | |
| SVR | C= 100, gamma= 0.000 1 | ||
| RF | max_depth= 15, max_features= sqrt, min_samples_leaf= 2, min_samples_split= 5, n_estimators= 300 | ||
| VNIR+SWIR | PLSR | n_components= 13 | |
| SVR | C= 10, gamma= 0.001 | ||
| RF | max_depth= 15, max_features= sqrt, min_samples_leaf= 2, min_samples_split= 5, n_estimators= 300 | ||
| 位置3 | VNIR | PLSR | n_components= 24 |
| SVR | C= 10, gamma= 0.001 | ||
| RF | max_depth= 15, max_features= sqrt, min_samples_leaf= 2, min_samples_split= 10, n_estimators= 100 | ||
| SWIR | PLSR | n_components= 9 | |
| SVR | C= 100, gamma= 0.000 1 | ||
| RF | max_depth= 10, max_features= sqrt, min_samples_leaf= 2, min_samples_split= 5, n_estimators= 300 | ||
| VNIR+SWIR | PLSR | n_components= 12 | |
| SVR | C= 100, gamma= 0.000 1 | ||
| RF | max_depth= 15, max_features= sqrt, min_samples_leaf= 2, min_samples_split= 5, n_estimators= 100 | ||
| 综合位置 | VNR | PLSR | n_components= 29 |
| SVR | C= 100, gamma= 0.001 | ||
| RF | max_depth= 15, max_features= sqrt, min_samples_leaf= 2, min_samples_split= 5, n_estimators= 300 | ||
| SWIR | PLSR | n_components= 28 | |
| SVR | C= 10, gamma= 0.001 | ||
| RF | max_depth= 15, max_features= sqrt, min_samples_leaf= 2, min_samples_split= 5, n_estimators= 300 | ||
| VNIR+SWIR | PLSR | n_components= 25 | |
| SVR | C= 100, gamma= 0.000 1 | ||
| RF | max_depth= 15, max_features= sqrt, min_samples_leaf= 2, min_samples_split= 5, n_estimators= 300 |
Table 3
Prediction performances of different machine learning algorithms for moisture content at different placement positions and different spectral ranges
| 摆放位置 | 光谱范围 | 回归方法 | 校准集 | 验证集 | 测试集 | |||||||
|---|---|---|---|---|---|---|---|---|---|---|---|---|
| R 2 C | RMSEC | MAEC | R 2 V | RMSEV | MAEV | R 2 P | RMSEP | MAEp | RPD | |||
| 位置1 | VNIR | PLSR | 0.784 9 | 1.034 6 | 0.813 5 | 0.618 7 | 1.507 3 | 1.156 0 | 0.327 1 | 1.915 6 | 1.443 0 | 1.219 1 |
| SVR | 0.687 1 | 1.247 9 | 0.902 2 | 0.561 3 | 1.616 9 | 1.221 2 | 0.563 6 | 1.542 7 | 1.197 6 | 1.513 7 | ||
| MLP | 0.835 3 | 0.905 3 | 0.718 2 | 0.542 6 | 1.650 9 | 1.251 9 | 0.492 9 | 1.662 8 | 1.349 2 | 1.404 3 | ||
| RF | 0.830 3 | 0.919 1 | 0.715 0 | 0.475 9 | 1.767 3 | 1.314 9 | 0.518 6 | 1.620 2 | 1.222 6 | 1.441 3 | ||
| SWIR | PLSR | 0.829 4 | 0.974 9 | 0.693 9 | 0.632 7 | 1.347 4 | 1.001 0 | 0.719 4 | 1.093 5 | 0.877 3 | 1.887 9 | |
| SVR | 0.861 0 | 0.879 9 | 0.493 6 | 0.644 7 | 1.325 2 | 0.951 8 | 0.781 4 | 0.965 3 | 0.751 6 | 2.138 8 | ||
| MLP | 0.928 8 | 0.629 5 | 0.459 5 | 0.660 8 | 1.294 7 | 0.940 5 | 0.753 7 | 1.024 5 | 0.785 6 | 2.015 0 | ||
| RF | 0.896 3 | 0.760 0 | 0.570 6 | 0.450 9 | 1.647 4 | 1.201 3 | 0.534 4 | 1.408 7 | 1.125 5 | 1.465 5 | ||
| VNIR+SWIR | PLSR | 0.883 3 | 0.775 9 | 0.572 2 | 0.752 0 | 1.075 6 | 0.817 9 | 0.711 4 | 1.361 8 | 1.018 3 | 1.861 4 | |
| SVR | 0.902 2 | 0.710 0 | 0.368 1 | 0.752 5 | 1.074 6 | 0.786 9 | 0.739 6 | 1.293 5 | 0.906 6 | 1.959 7 | ||
| MLP | 0.929 6 | 0.602 1 | 0.470 6 | 0.708 4 | 1.166 2 | 0.939 5 | 0.683 9 | 1.425 0 | 1.121 0 | 1.778 7 | ||
| RF | 0.905 6 | 0.697 7 | 0.516 7 | 0.568 5 | 1.418 8 | 1.115 7 | 0.517 6 | 1.760 5 | 1.382 2 | 1.439 8 | ||
| 位置2 | VNIR | PLSR | 0.787 6 | 1.006 8 | 0.784 7 | 0.727 5 | 1.380 5 | 1.057 0 | 0.660 5 | 1.497 2 | 1.187 2 | 1.716 2 |
| SVR | 0.853 8 | 0.835 2 | 0.506 1 | 0.686 6 | 1.480 5 | 1.132 9 | 0.682 8 | 1.447 0 | 1.077 7 | 1.775 6 | ||
| MLP | 0.866 3 | 0.798 5 | 0.624 9 | 0.630 3 | 1.607 7 | 1.224 0 | 0.679 2 | 1.455 2 | 1.131 2 | 1.765 5 | ||
| RF | 0.890 3 | 0.723 6 | 0.530 9 | 0.511 3 | 1.848 6 | 1.408 9 | 0.513 4 | 1.792 2 | 1.422 3 | 1.433 6 | ||
| SWIR | PLSR | 0.787 0 | 1.081 2 | 0.779 4 | 0.846 0 | 1.137 1 | 0.825 2 | 0.803 1 | 1.086 2 | 0.840 4 | 2.253 6 | |
| SVR | 0.841 4 | 0.933 1 | 0.537 7 | 0.742 4 | 1.068 2 | 0.724 2 | 0.860 5 | 0.914 2 | 0.711 1 | 2.677 6 | ||
| MLP | 0.890 1 | 0.776 5 | 0.534 2 | 0.632 6 | 1.275 6 | 0.938 2 | 0.763 4 | 1.190 5 | 0.901 5 | 2.056 0 | ||
| RF | 0.901 4 | 0.735 8 | 0.556 4 | 0.452 1 | 1.557 9 | 1.163 6 | 0.569 0 | 1.607 1 | 1.222 1 | 1.523 2 | ||
| VNIR+SWIR | PLSR | 0.871 6 | 0.794 3 | 0.597 2 | 0.777 0 | 1.225 2 | 0.857 8 | 0.749 8 | 1.263 8 | 0.902 6 | 1.999 1 | |
| SVR | 0.925 6 | 0.604 6 | 0.276 9 | 0.715 2 | 1.384 7 | 0.948 3 | 0.821 2 | 1.068 4 | 0.781 5 | 2.364 8 | ||
| MLP | 0.917 6 | 0.636 2 | 0.490 1 | 0.662 0 | 1.508 5 | 1.114 7 | 0.752 8 | 1.256 0 | 1.014 2 | 2.011 4 | ||
| RF | 0.912 2 | 0.657 0 | 0.478 3 | 0.539 6 | 1.760 6 | 1.351 4 | 0.574 5 | 1.648 0 | 1.268 3 | 1.533 1 | ||
| 位置3 | VNIR | PLSR | 0.784 5 | 1.053 5 | 0.795 4 | 0.609 1 | 1.477 5 | 1.136 8 | 0.768 6 | 1.142 3 | 0.851 6 | 2.078 9 |
| SVR | 0.711 8 | 1.218 2 | 0.876 1 | 0.491 4 | 1.685 3 | 1.366 8 | 0.702 6 | 1.295 0 | 1.033 3 | 1.833 8 | ||
| MLP | 0.840 2 | 0.907 0 | 0.712 9 | 0.435 5 | 1.775 3 | 1.443 7 | 0.520 8 | 1.643 7 | 1.317 0 | 1.444 7 | ||
| RF | 0.817 0 | 0.970 8 | 0.739 2 | 0.381 3 | 1.858 7 | 1.466 3 | 0.593 4 | 1.514 2 | 1.168 4 | 1.568 3 | ||
| SWIR | PLSR | 0.837 2 | 0.951 5 | 0.695 9 | 0.683 9 | 1.276 1 | 0.912 3 | 0.632 2 | 1.193 0 | 0.845 5 | 1.648 8 | |
| SVR | 0.853 9 | 0.901 2 | 0.528 2 | 0.705 6 | 1.231 6 | 0.896 1 | 0.725 4 | 1.030 7 | 0.764 6 | 1.908 5 | ||
| MLP | 0.881 1 | 0.812 9 | 0.613 5 | 0.694 5 | 1.254 3 | 0.920 4 | 0.670 7 | 1.128 6 | 0.835 2 | 1.742 8 | ||
| RF | 0.885 9 | 0.796 5 | 0.611 7 | 0.395 6 | 1.764 5 | 1.375 5 | 0.444 5 | 1.466 0 | 1.129 9 | 1.341 8 | ||
| VNIR+SWIR | PLSR | 0.877 1 | 0.787 5 | 0.583 4 | 0.696 3 | 1.399 1 | 1.072 8 | 0.815 9 | 0.956 8 | 0.718 2 | 2.330 5 | |
| SVR | 0.880 6 | 0.776 0 | 0.424 2 | 0.730 1 | 1.319 0 | 0.959 0 | 0.849 3 | 0.865 6 | 0.669 0 | 2.576 0 | ||
| MLP | 0.901 7 | 0.704 0 | 0.521 5 | 0.688 3 | 1.417 3 | 1.043 9 | 0.697 4 | 1.226 3 | 0.917 1 | 1.818 1 | ||
| RF | 0.903 3 | 0.698 3 | 0.527 3 | 0.461 5 | 1.863 1 | 1.487 3 | 0.599 0 | 1.412 0 | 1.062 3 | 1.579 2 | ||
| 综合位置 | VNR | PLSR | 0.671 5 | 1.314 6 | 1.027 2 | 0.583 6 | 1.482 8 | 1.135 9 | 0.592 4 | 1.533 8 | 1.191 5 | 1.566 3 |
| SVR | 0.793 3 | 1.042 8 | 0.686 8 | 0.633 0 | 1.392 2 | 1.042 1 | 0.663 8 | 1.3931 | 1.065 9 | 1.724 5 | ||
| MLP | 0.815 6 | 0.984 9 | 0.773 6 | 0.553 5 | 1.535 4 | 1.147 2 | 0.595 9 | 1.527 0 | 1.191 3 | 1.573 2 | ||
| RF | 0.898 6 | 0.730 4 | 0.549 8 | 0.477 1 | 1.661 8 | 1.259 3 | 0.447 8 | 1.785 2 | 1.374 8 | 1.345 7 | ||
| SWIR | PLSR | 0.837 2 | 0.948 9 | 0.712 8 | 0.680 0 | 1.253 4 | 0.976 0 | 0.707 0 | 1.181 8 | 0.918 7 | 1.847 4 | |
| SVR | 0.844 3 | 0.928 1 | 0.550 1 | 0.736 0 | 1.138 4 | 0.846 2 | 0.758 3 | 1.073 5 | 0.788 0 | 2.033 9 | ||
| MLP | 0.906 6 | 0.718 5 | 0.551 7 | 0.701 1 | 1.211 0 | 0.904 1 | 0.699 7 | 1.196 4 | 0.910 6 | 1.824 8 | ||
| RF | 0.898 2 | 0.750 5 | 0.567 2 | 0.498 4 | 1.569 3 | 1.231 7 | 0.455 9 | 1.610 5 | 1.273 3 | 1.355 6 | ||
| VNIR+SWIR | PLSR | 0.870 7 | 0.838 2 | 0.626 6 | 0.670 2 | 1.234 3 | 0.918 8 | 0.743 4 | 1.248 1 | 0.874 6 | 1.974 0 | |
| SVR | 0.862 2 | 0.865 4 | 0.540 0 | 0.722 6 | 1.131 8 | 0.801 2 | 0.772 7 | 1.174 7 | 0.816 9 | 2.097 4 | ||
| MLP | 0.874 3 | 0.826 3 | 0.636 9 | 0.670 8 | 1.232 9 | 0.936 4 | 0.750 3 | 1.231 0 | 0.885 3 | 2.001 4 | ||
| RF | 0.913 7 | 0.684 7 | 0.513 9 | 0.558 5 | 1.428 0 | 1.086 0 | 0.548 5 | 1.655 6 | 1.278 7 | 1.488 2 | ||
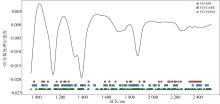
Fig. 4
Characteristic wavelengths for predicting water content of hawthorn extracted by SPA, CARS and VISSA
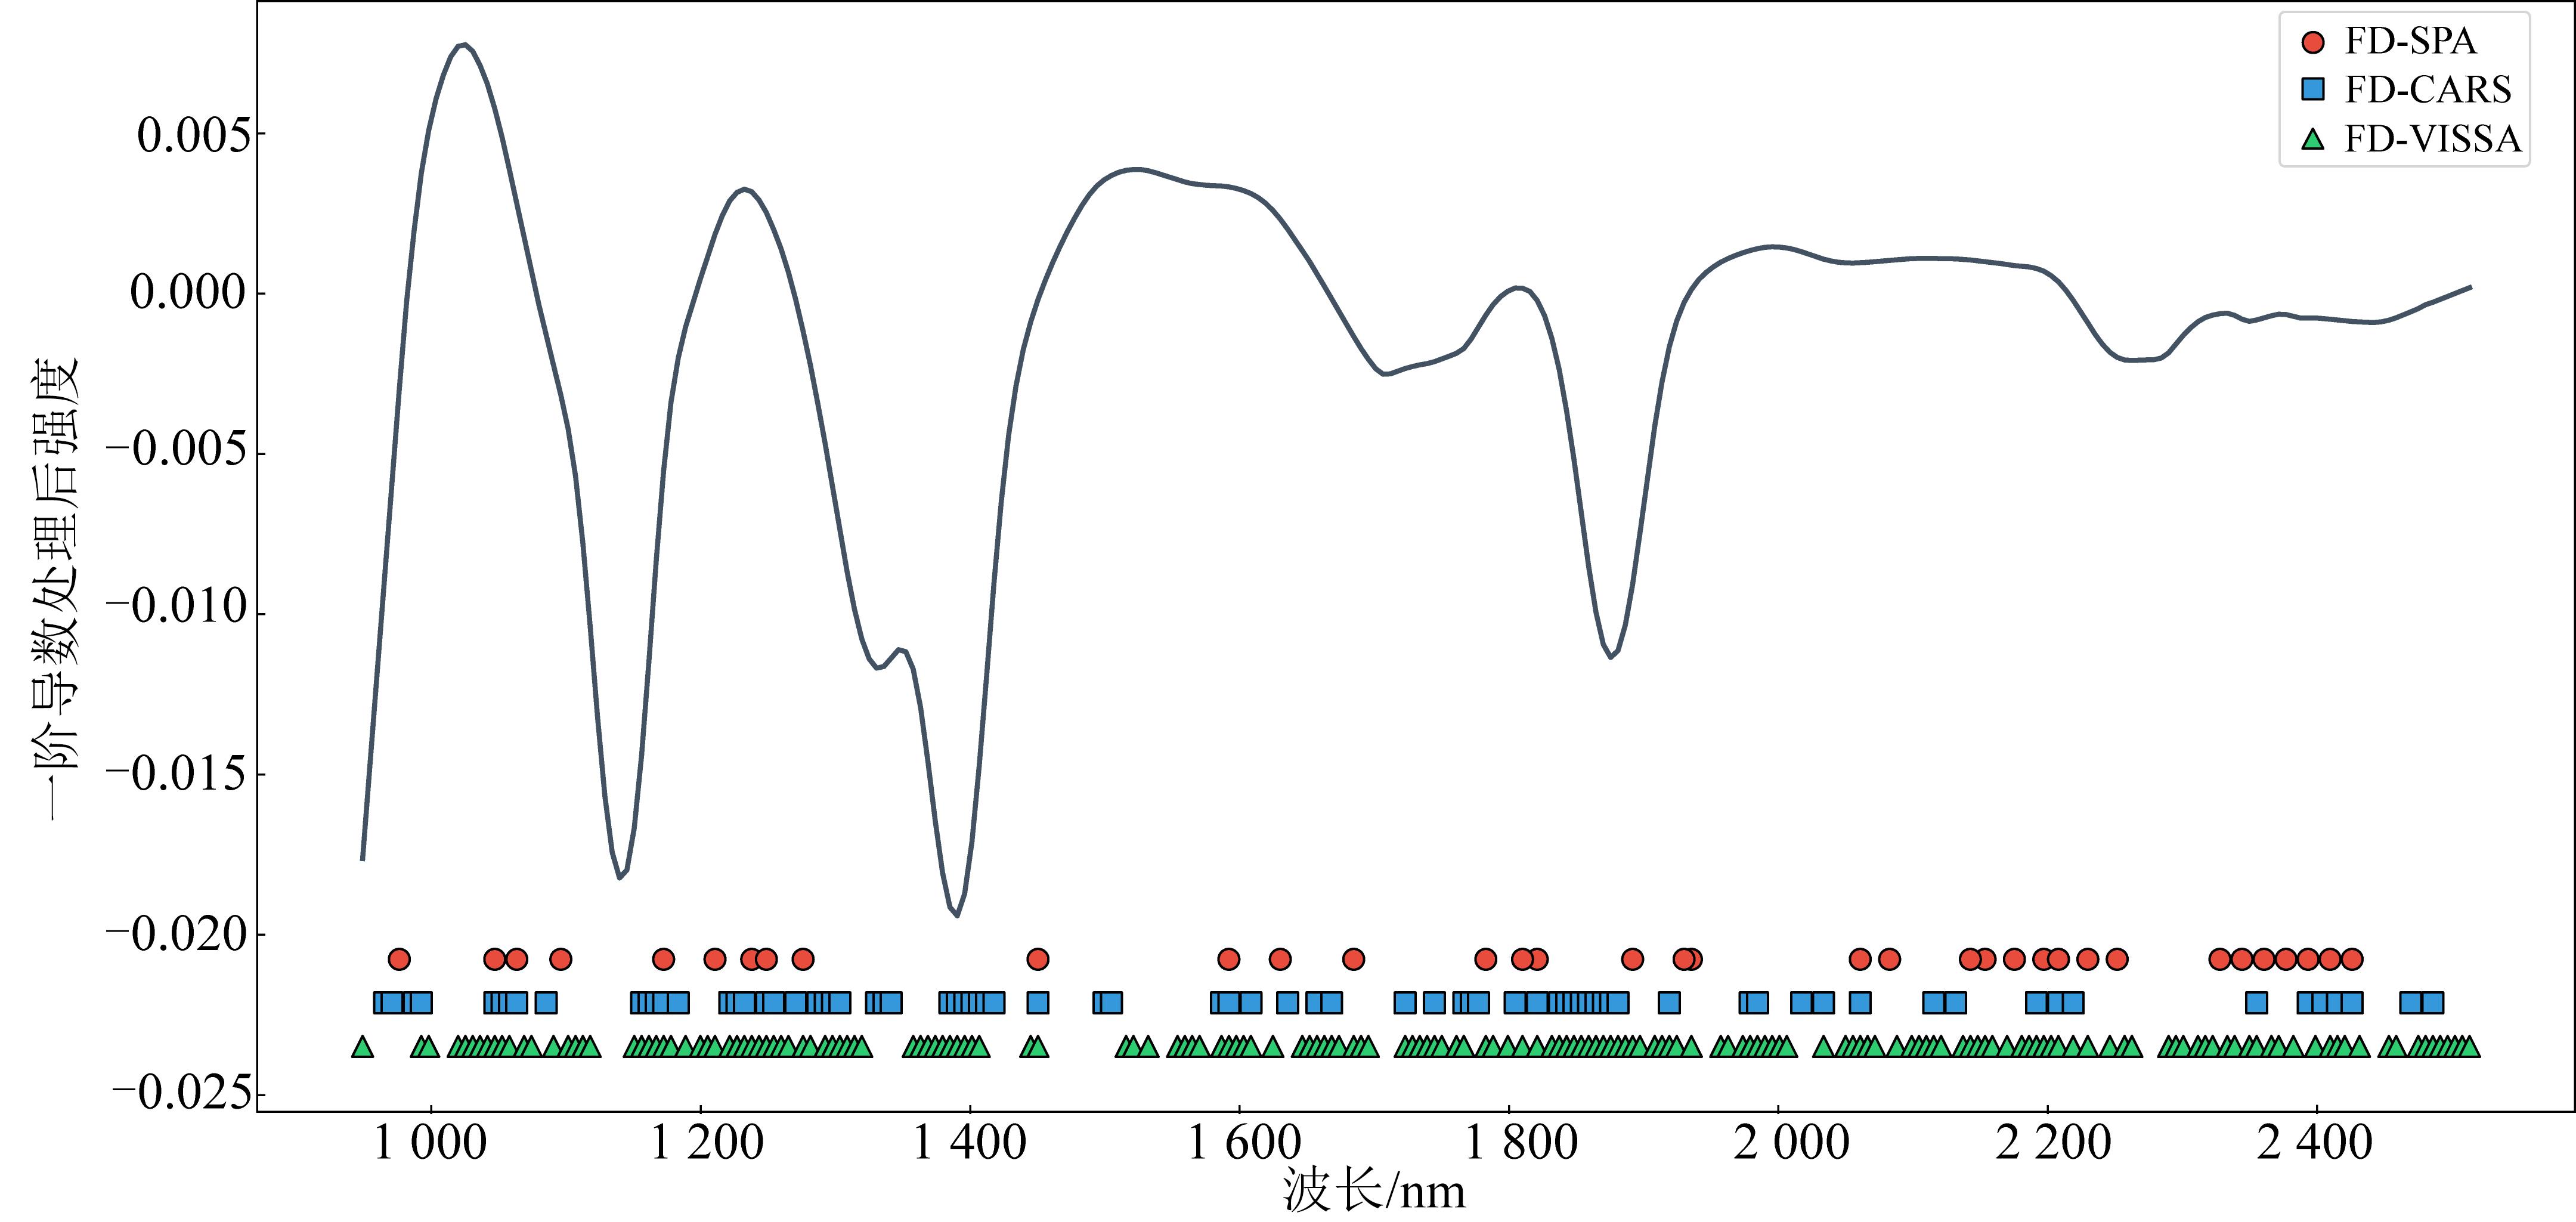
Table 4
Prediction performances of water content based on SWIR spectra processed by three dimensionality reduction algorithms
| 数据处理方法 | 特征数 | 校准集 | 验证集 | 测试集 | |||||||
|---|---|---|---|---|---|---|---|---|---|---|---|
| R 2 C | RMSEC | MAEC | R 2 V | RMSEV | MAEV | R 2 P | RMSEP | MAEP | RPD | ||
| FD-SPA | 35 | 0.584 3 | 1.510 6 | 1.043 0 | 0.524 9 | 1.450 7 | 1.096 9 | 0.604 4 | 1.539 7 | 1.169 2 | 1.589 8 |
| FD-CARS | 77 | 0.841 8 | 0.931 7 | 0.554 2 | 0.699 9 | 1.152 9 | 0.824 4 | 0.848 9 | 0.951 5 | 0.726 9 | 2.572 6 |
| FD-VISSA | 176 | 0.953 2 | 0.507 1 | 0.228 5 | 0.722 3 | 1.109 0 | 0.743 5 | 0.841 2 | 0.975 6 | 0.765 7 | 2.509 1 |
Fig. 5
Determination coefficient of hawthorn water content at different wavelet decomposition levels
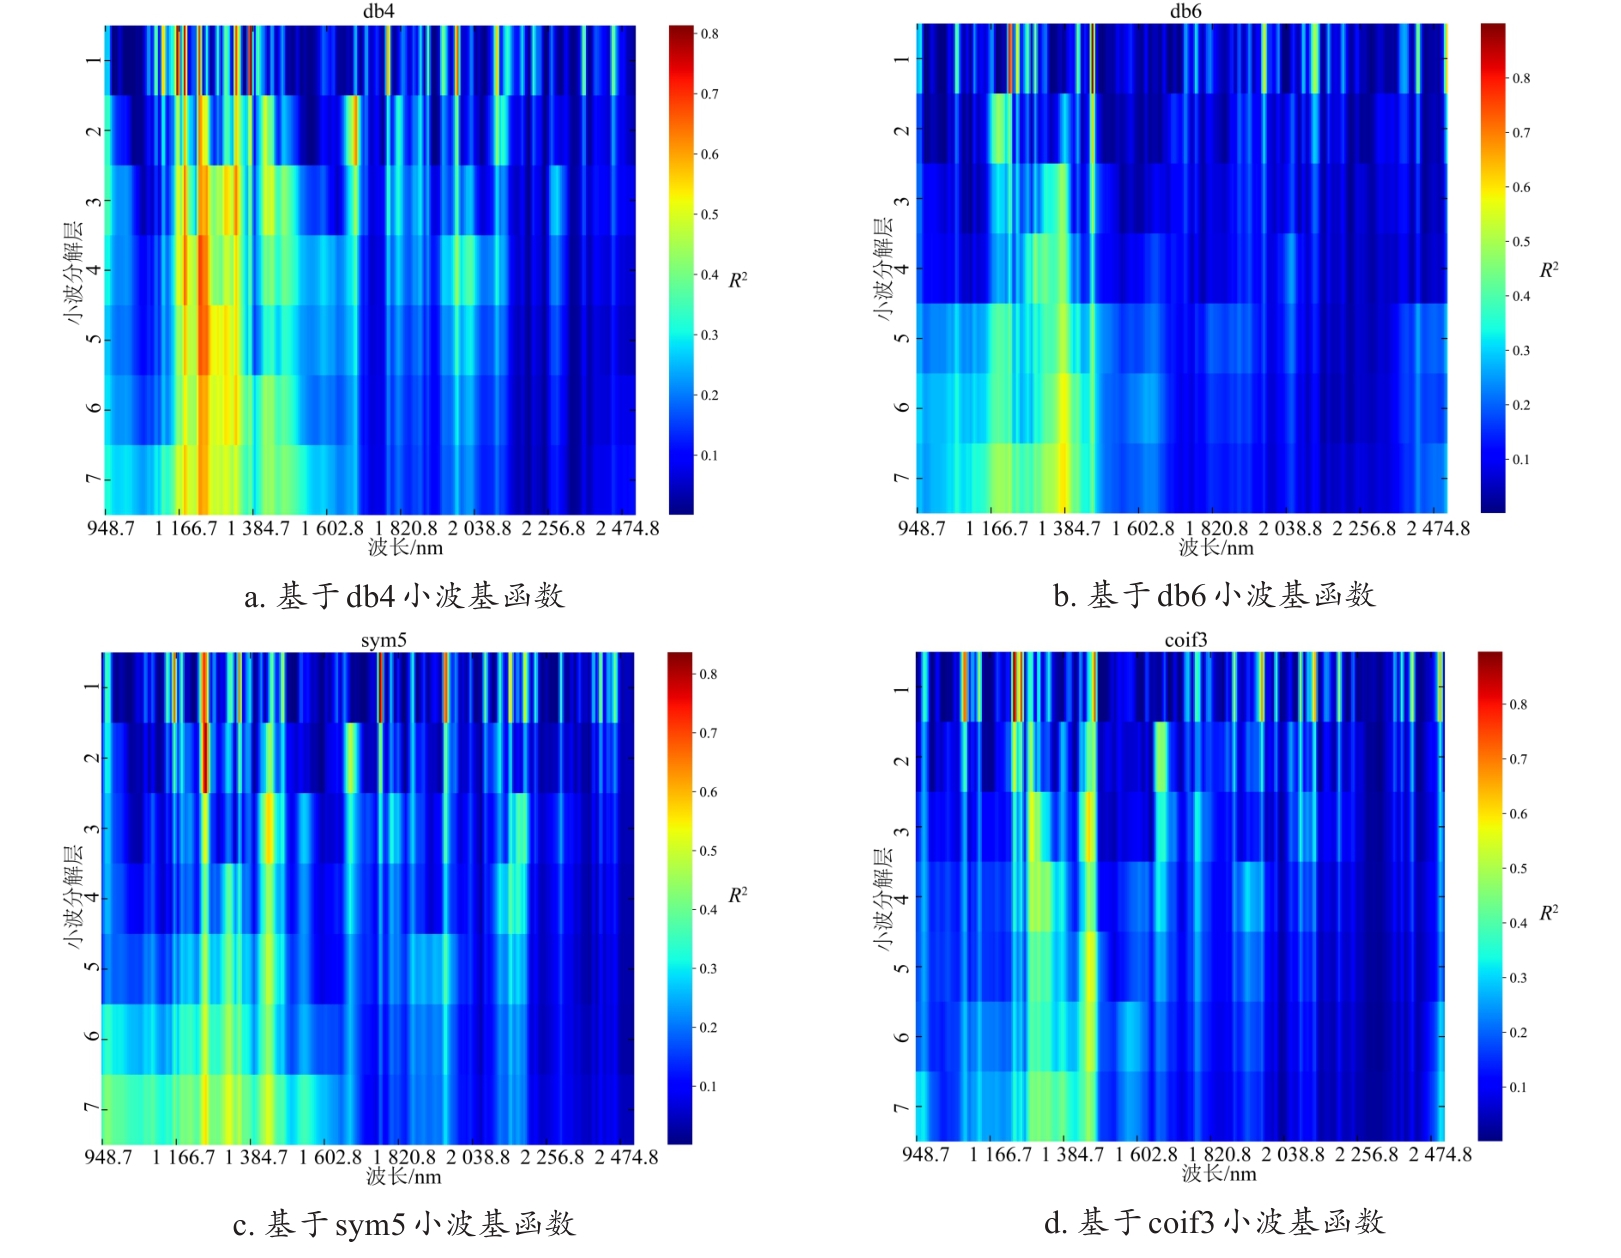
Table 5
Prediction performance of water content based on SWIR spectra processed by DWT-SR
| 小波基函数 | 特征数 | 校准集 | 验证集 | 测试集 | |||||||
|---|---|---|---|---|---|---|---|---|---|---|---|
| R 2 C | RMSEC | MAEC | R 2 V | RMSEV | MAEV | R 2 P | RMSEP | MAEP | RPD | ||
| db4 | 16 | 0.769 8 | 1.124 1 | 0.795 1 | 0.698 8 | 1.155 0 | 1.053 4 | 0.829 8 | 1.010 0 | 0.779 0 | 2.423 7 |
| db6 | 17 | 0.785 8 | 1.084 4 | 0.653 0 | 0.715 6 | 1.122 3 | 1.060 5 | 0.857 1 | 0.925 2 | 0.669 2 | 2.645 7 |
| sym5 | 22 | 0.795 9 | 1.058 3 | 0.679 5 | 0.721 7 | 1.110 3 | 1.036 2 | 0.829 0 | 1.012 2 | 0.784 5 | 2.418 3 |
| coif3 | 19 | 0.765 5 | 1.134 6 | 0.726 6 | 0.635 6 | 1.270 5 | 1.156 2 | 0.826 0 | 1.021 2 | 0.750 1 | 2.397 1 |
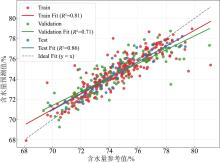
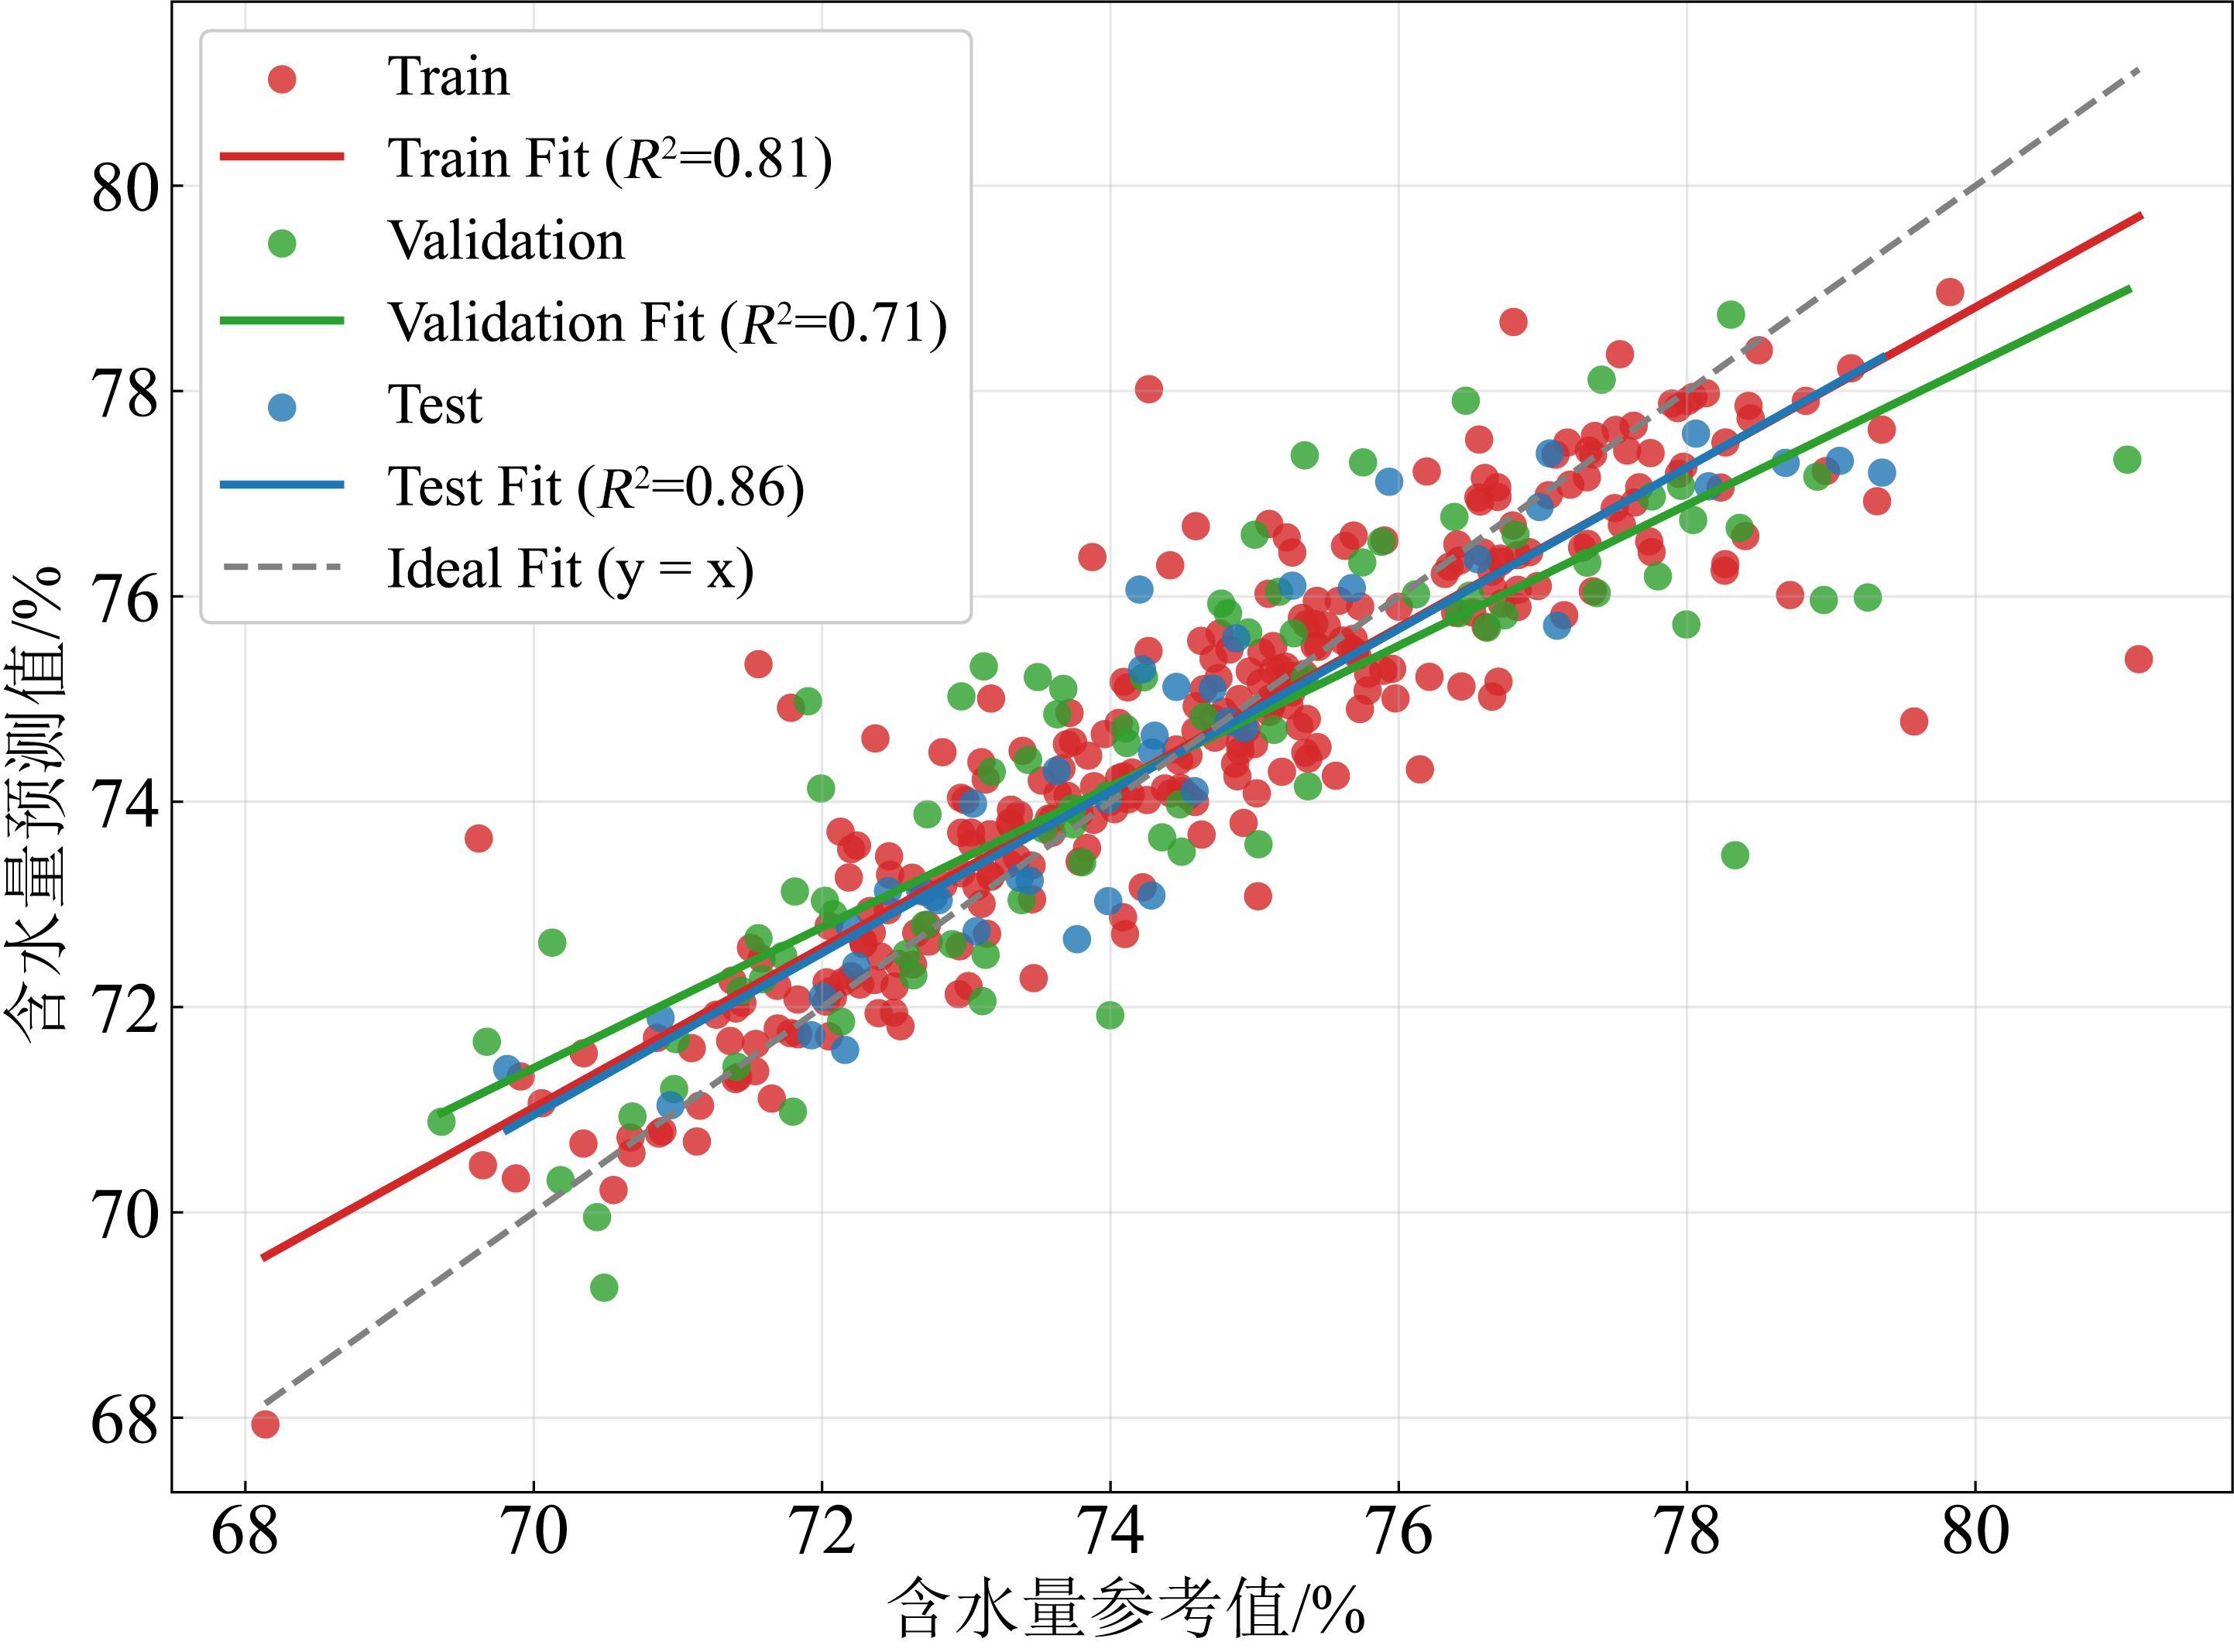
Fig. 6
Prediction results of hawthorn moisture content using the optimal DWT-SR-SVR model
| [1] |
|
| [2] |
|
| [3] |
张海芳, 纳日, 韩育梅, 等. 光谱无损检测技术在农产品产地溯源中的研究进展[J]. 食品工业科技, 2023, 44(8): 17-25.
|
|
|
|
| [4] |
|
| [5] |
|
| [6] |
|
| [7] |
|
| [8] |
|
| [9] |
|
| [10] |
中华人民共和国国家卫生和计划生育委员会. 食品安全国家标准 食品中水分的测定: GB 5009.3—2016 [S]. 北京: 中国标准出版社, 2017.
|
|
National Food Safety Standard Determination of Moisture in Food: GB 5009.3—2016[S]. Beijing: Standards Press of China, 2017.
|
|
| [11] |
刘玲玲, 王游游, 杨健, 等. 基于高光谱技术的枸杞子化学成分含量快速检测技术研究[J]. 中国中药杂志, 2023, 48(16): 4328-4336.
|
|
|
|
| [12] |
|
| [13] |
|
| [14] |
周聪, 王慧, 杨健, 等. 基于高光谱成像技术的中药栀子产地识别[J]. 中国中药杂志, 2022, 47(22): 6027-6033.
|
|
|
|
| [15] |
李璇, 袁希平, 甘淑, 等. 多变分模态分解下的湿地植被高光谱识别特征波长优选与模型研究[J]. 光谱学与光谱分析, 2025, 45(3): 601-607.
|
|
|
|
| [16] |
王飞. 基于变量迭代空间收缩法的土壤有机质含量高光谱快速检测[J]. 水利科技与经济, 2021, 27(11): 8-12.
|
|
|
|
| [17] |
|
| [18] |
|
| [19] |
|
| [20] |
杨宝华, 高远, 王梦玄, 等. 基于光谱-空间特征的黄茶多酚含量估算模型[J]. 光谱学与光谱分析, 2021, 41(3): 936-942.
|
|
|
|
| [21] |
|
| [22] |
杨唯瀚, 郝经文, 黄和平, 等. 近红外漫反射光谱法快速测定蕨菜多糖含量的研究[J]. 中国现代应用药学, 2023, 40(5): 597-602.
|
|
|
|
| [23] |
|
| [24] |
|
| [25] |
|
| [26] |
|
| [27] |
|
| [28] |
|
| [1] | WU Zhangbin, HE Ning, WU Yandong, GUO Xinyu, WEN Weiliang. Point Cloud Data-driven Methods for Estimating Maize Leaf Biomass [J]. Smart Agriculture, 2026, 8(1): 156-166. |
| [2] | LIU Jie, GUO Jiaxin, ZHANG Jiahao, ZHANG Bingchao, XIONG Jie, CAO Jianpeng, WU Shangrong, DENG Yingbin, CHEN Guipeng. Method for Estimating Leaf Area Index of Winter Rapeseed Based on Fusion of Vegetation Indices and Texture Features [J]. Smart Agriculture, 2025, 7(6): 161-173. |
| [3] | ZHANG Zishen, CHENG Hong, GENG Wenjuan, GUAN Junfeng. Research Advances in Hyperspectral Imaging Technology for Fruit Quality Assessment [J]. Smart Agriculture, 2025, 7(5): 52-66. |
| [4] | LI Fei, WANG Ziqiang, WU Jing, XIN Xia, LI Chunmei, XU Hubo. Imbalanced Hyperspectral Viability Detection of Naturally Aged Soybean Germplasm Based on Semi-Supervised Deep Convolutional Generative Adversarial Network [J]. Smart Agriculture, 2025, 7(5): 101-113. |
| [5] | YU Xinyuan, WANG Zhenjie, YOU Sicong, TU Kang, LAN Weijie, PENG Jing, ZHU Lixia, CHEN Tao, PAN Leiqing. Non-destructive Detection of Apple Water Core Disease Based on Hyperspectral and X-ray CT Imaging [J]. Smart Agriculture, 2025, 7(4): 108-118. |
| [6] | LIU Liqi, WEI Guangyuan, ZHOU Ping. Prediction and Mapping of Soil Total Nitrogen Using GF-5 Image Based on Machine Learning Optimization Modeling [J]. Smart Agriculture, 2024, 6(5): 61-73. |
| [7] | XU Ruifeng, WANG Yaohua, DING Wenyong, YU Junqi, YAN Maocang, CHEN Chen. Shrimp Diseases Detection Method Based on Improved YOLOv8 and Multiple Features [J]. Smart Agriculture, 2024, 6(2): 62-71. |
| [8] | SHEN Yanyan, ZHAO Yutao, CHEN Gengshen, LYU Zhengang, ZHAO Feng, YANG Wanneng, MENG Ran. Identification and Severity Classification of Typical Maize Foliar Diseases Based on Hyperspectral Data [J]. Smart Agriculture, 2024, 6(2): 28-39. |
| [9] | GUO Wang, YANG Yusen, WU Huarui, ZHU Huaji, MIAO Yisheng, GU Jingqiu. Big Models in Agriculture: Key Technologies, Application and Future Directions [J]. Smart Agriculture, 2024, 6(2): 1-13. |
| [10] | TANG Chaoli, LI Hao, WANG Rujing, WANG Le, HUANG Qing, WANG Dapeng, ZHANG Jiabao, CHEN Xiangyu. Automatic Identification Method for Spectral Peaks of Soil Nutrient Ions Using Contactless Conductivity Detection [J]. Smart Agriculture, 2024, 6(1): 36-45. |
| [11] | JIA Wenshen, LYU Haolin, ZHANG Shang, QIN Yingdong, ZHOU Wei. Using a Portable Visible-near Infrared Spectrometer and Machine Learning to Distinguish and Quantify Mold Contamination in Wheat [J]. Smart Agriculture, 2024, 6(1): 89-100. |
| [12] | LONG Jianing, ZHANG Zhao, LIU Xiaohang, LI Yunxia, RUI Zhaoyu, YU Jiangfan, ZHANG Man, FLORES Paulo, HAN Zhexiong, HU Can, WANG Xufeng. Wheat Lodging Types Detection Based on UAV Image Using Improved EfficientNetV2 [J]. Smart Agriculture, 2023, 5(3): 62-74. |
| [13] | YE Dapeng, CHEN Chen, LI Huilin, LEI Yingxiao, WENG Haiyong, QU Fangfang. Visible/NIR Spectral Inversion of Malondialdehyde Content in JUNCAO Based on Deep Convolutional Gengrative Adversarial Network [J]. Smart Agriculture, 2023, 5(3): 132-141. |
| [14] | LI Jiahao, QU Hongjun, GAO Mingzhe, TONG Dezhi, GUO Ya. A Multi-Focal Green Plant Image Fusion Method Based on Stationary Wavelet Transform and Parameter-Adaptation Dual Channel Pulse-Coupled Neural Network [J]. Smart Agriculture, 2023, 5(3): 121-131. |
| [15] | SHI Jiefeng, HUANG Wei, FAN Xieyang, LI Xiuhua, LU Yangxu, JIANG Zhuhui, WANG Zeping, LUO Wei, ZHANG Muqing. Yield Prediction Models in Guangxi Sugarcane Planting Regions Based on Machine Learning Methods [J]. Smart Agriculture, 2023, 5(2): 82-92. |
| Viewed | ||||||
|
Full text |
|
|||||
|
Abstract |
|
|||||


