


0 Introduction
Tea diseases represent a significant influence on both the yield and quality of the tea industry, while most of its green tea production in China comes from small farmers[1, 2]. The accurate, rapid discovery and identification of tea diseases can facilitate the implementation of appropriate control measures at the earliest possible stage, thereby preventing the spread of diseases and ensuring the safety, production, and quality of tea[3-5]. Currently, the methodology used to identify and diagnose leaf diseases has evolved from general image processing to deep learning techniques, which have significantly improved the accuracy of recognition[6, 7]. RITHARSON et al.[8] achieved 99.94% accuracy in rice leaf disease recognition through an improved VGG16 (Visual Geometry Group 16) architecture, demonstrating the effectiveness of deep learning methods in plant disease identification. HU et al.[9] proposed a computer vision-based segmentation to diagnose the disease severity of a self-constructed tea wilt dataset and validated a higher estimation accuracy of 78%. NIE et al.[10] proposed Camellia-YOLACT (You Only Look At CoefficienTs), an enhanced instance segmentation model incorporating Swin-Transformer, weighted BiFPN (Bidirectional Feature Pyramid Network), and HardSwish activation for anthracnose severity grading in Camellia oleifera, achieved 86.8% mAP75 and 94.4% field grading accuracy. NATH et al.[11] employed a convolutional neural network (CNN) architecture based on depthwise separable convolution with an attention mechanism, enabling the precise extraction of disease features with an accuracy of 99.27% on a tea image dataset. However, in a natural tea plantation environment, the applied and lightweight recognition task is challenging due to factors such as the fact that the target features are mutually infected and have a high resemblance to fine-grained features of each other. Therefore, it is particularly essential to recognize and diagnose disease severity early for precise anti-disease control measures.
Due to the capability to extract extensive fine-grained features, deep semantic segmentation can hereby enable end-to-end automated learning and the identification of both high-level semantics and low-level detailed disease features regarding tissue sites[12-14]. It enables targeted classification while suppressing irrelevant noise and focusing on key semantic features[15]. The most commonly used models mainly include fully convolutional networks (FCN)[16], DeepLab[17], SegNet[18], U-Net[19], etc. These models can more accurately diagnose the severity of leaf disease in image data captured under challenging brightness and background conditions[20, 21]. An increasing number of researches have achieved accurate and efficient disease segmentation by leveraging the strong transferability and high accuracy of these models. HU et al.[22] developed a lightweight DeepLabV3+ variant for precise segmentation of premium tea buds in automated harvesting, the model integrates MobileNetV2 with an ECA-ASPP (Efficient Channel Attention-Atrous Spatial Pyramid Pooling) fusion module, achieving 93.71% mIoU (mean Intersection over Union) while reducing parameters by 89.4%. ZHOU et al.[23] enhanced the DeepLabV3+ and introduced a new segmentation model called GS-DeepLabV3+, achieved an mIoU of 87.77% and an average pixel accuracy of 94.55% on a self-constructed leaf disease dataset of oil tea. CHEN et al.[24] introduced a novel multi-feature fusion module based on the YOLOv7 model to capture local and global dependencies, thereby obtaining more comprehensive feature information of tea bud leaves, achieved a final average detection accuracy of 94.43%. SUN et al.[25] designed TeaDiseaseNet, which also used a multi-scale self-attention mechanism to enhance disease detection performance. HU et al.[26] utilized U-Net for the segmentation of diseased spots and proposed an ellipse recovery for occluded or damaged leaves, employing conditional random fields (CRF) optimization. The algorithm achieved an average precision (AP) of 91.22%. In a subsequent study, the initial disease severity (IDS) coefficient was utilized to assess the severity of tea wilt, resulting in enhanced estimation accuracy[27]. As above, an encoder-decoder-based semantic segmentation is capable of effectively learning to extract feature representations at various sizes and integrate contextual information. Therefore, for multi-size and multi-target leaf blob features within a wide field of view, the segmentation accuracy can be significantly improved by utilizing features from different receptive fields.
The recognition of tea-leaf disease is complex, requiring large-scale computing and a large model size, which needs a considerable dataset to train. Therefore, a lightweight detection model with an optimal target recognition algorithm needs to be explored. SHWETHA et al.[28] developed a lightweight MobileNetV3-based CNN classifier for detecting leaf blight spot disease in jasmine plants. They employed depth-wise convolutions and max pooling for feature extraction. Conditional GAN was used for data augmentation, and particle swarm optimization (PSO) was applied for feature selection. The classifier achieved over 94% accuracy in real-world conditions. GUI et al.[29] introduced the Ghost_conv module as a replacement for the original convolution block in YOLOv5. This modification significantly decreased both the computational effort and the model size. WU et al.[30] developed an enhanced end-to-end RGB-D multi-modal object detection network based on YOLOv7, referred to as YOLO-RGBDtea, whilst the parameter increment of the proposed model was 17.8%. MACDONALD et al.[31] developed a novel lightweight CNN approach for plant disease classification in a smart grow-light monitoring system. Their lightweight model with dense residual connections achieved high accuracy (96.75%) using only 228 479 parameters, outperforming many full-scale models with significantly less computational requirements. To reduce the model parameters and to improve the computation efficiency and segmentation accuracy, U-Net3+ was designed for medical image segmentation, and its full-scale skip connections incorporate low-level details with high-level semantics from feature maps in different scales[32, 33]. To fully leverage the features from each layer, many extensions of U-Net3+, such as ConvUNeXt[34], Evo-GU-Net3++[35], ConvNet-HIDE[33], and Trans-Res-U-Net3+[36], have been proposed for various small-object-sensitive areas of segmentation. The multi-scale feature-fusion module (MSFFM)could be redesigned to extract more reliable multi-scale features for varied sizes of diseased leaf spots and to better the final detection performances[37]. The dual attention mechanism based on MSFF integrated color texture and spatial structure features to improve the semantic segmentation[38].
Since those U-Net3+ based lightweight models and related extensions of varied attention mechanisms and MSFFM have achieved great progress in fine-grained feature segmentation tasks, the proposed method applied a customized U-Net3+ network to semantically segment the tea leaf disease image. A series of parameter optimizations and feature fusion modules improvements were conducted on the lightweight semantic segmentation of the U-Net3+ architecture. This model not only maintains a high precise recognition rate but also can greatly reduces network parameters, effectively decreasing computation and model size, respectively. The main contributions, the new MDC-U-Net3+ was proposed on the base framework of U-Net3+. The main contributions are summarized as follows: 1) Development of a new U-Net3+ based semantic segmentation. 2) Redesign of the MSFFM in the backbone network to replace the original convolutional block of U-Net3+. 3) Integration of dual multi-scale attention (DMSA) at the skip connection stage. 4) Post-processing of segmented spot and leaf mask images using a fully connected conditional random field (CRF).
1 Materials and methods
1.1 Tea disease dataset
The images of tea diseases were taken from the Xixiang tea experimental demonstration station of Northwest A&F University and adjacent tea gardens in Xixiang county, Hanzhong city, Shaanxi province, China (107°40'51.801 6" E, 32°57'56.055 6" N, at an altitude of 400 to 500 m above sea level). Image data for five disease types, including tea leaf blight, tea red leaf spot, tea red scab, tea blister blight, and tea anthracnose, were collected for Shaanxi Tea 1 and Longjing 43. The images were captured in natural environments, utilizing soil and tea branches as the backdrop. The camera was positioned at 0.2 to 0.4 m from the leaves to ensure optimal clarity and detail. To enhance the diversity of the training samples, the image data were collected using various shooting techniques,including capturing images with and against the light, from multiple angles, and at different elevations. The image samples are shown in Fig. 1, comprising a total of 3 260 samples collected. The image data underwent a series of preprocessing operations, including cropping, filling, and scaling, to ensure uniformity in image size, which was subsequently standardized to 224 pixels. The leaves were labeled using LabelMe software, which generated the corresponding masks.
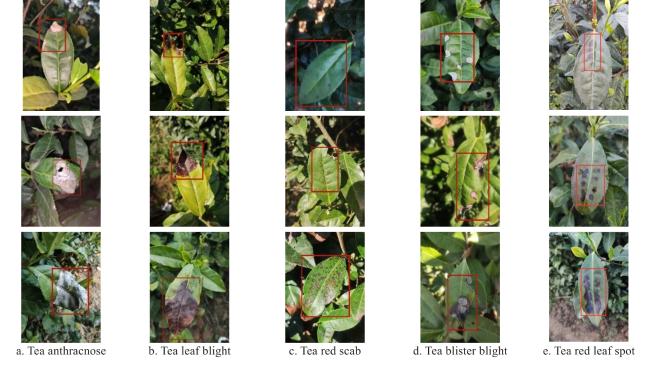
Fig. 1 Disease samples of tea leaf |
The same leaf exhibits varying characters in different shooting environments, leading to significant changes in its size, position, orientation, and brightness or darkness. In Fig. 1b, the disease of tea leaf blight spot in fact appears as the original brown coloration, and certain areas of the leaves show a reddish hue, which is influenced by the light and shooting angle, resulting in a blurred appearance. Additionally, spots on tea leaves are irregularly shaped and vary in size, while the clarity of the images is influenced by different lighting conditions. Moreover, some images of diseased leaves are affected by rain, dew, and mud, which have produced image noise. To address potential issues of overfitting or underfitting that may arise from the uneven number of images and to enhance the generalization capability of the network model, five data augmentation methods were employed. These methods included blurring, scaling, rotating, brightening or darkening, and adding noise. The effects of data enhancement are illustrated in Fig. 2. Following data enhancement, a total of 13 158 image data were generated. The changes in the number of samples for each disease type, both before and after data enhancement, are presented in Table 1.
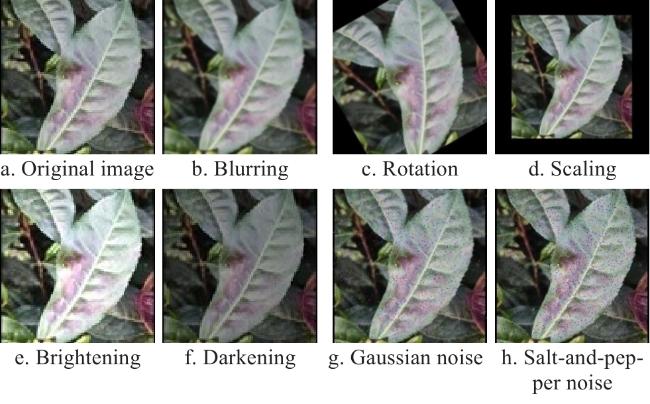
Fig. 2 Methods of data enhancement for disease samples of tea leaf |
Table 1 Number of images corresponding to each disease of tea leaf before and after data augmentation |
| Disease types | Pre-augmentation | Post-augmentation |
|---|---|---|
| Tea anthracnose (Gloeosporium theae-sinensis Miyake) | 428 | 2 568 |
| Tea leaf blight (Colletotrichum camelliae Massee) | 375 | 2 250 |
| Tea red scab (Cercospora theae BreadaDe Haan) | 486 | 2 916 |
| Tea blister blight (Exobasidium vexans Massee) | 469 | 2 814 |
| Tea red leaf spot (Phyllosticta theicola Petch) | 435 | 2 610 |
According to the practical experience of comprehensive measurement and control of diseases in standardized and large-scale tea plantations[39], specific calculation criteria for diagnosing the severity of tea leaf diseases are outlined, as presented in Table 2. For the study of tea red leaf spot disease, tea anthracnose, tea blister blight, and tea leaf blight, the semantic segmentation technique can be employed to determine the area of disease spots and leaves. The severity of these diseases can then be assessed based on the ratio of the spot area to the leaf area, along with the grading criteria for disease severity. To assess the severity of tea red scab in tea plants, it is crucial to quantify the number of spots on the leaf surface and subsequently apply the relevant grading criteria.
Table 2 Classification standard of tea leaf disease |
| Disease severity | Classification standard of leaf | |
|---|---|---|
| Area of leaf spots | Number of leaf spots | |
| 0 | none | 0 |
| 1 | less than 25% of the leaf area | 1 |
| 2 | 25% to 50% of the leaf area | 2 |
| 3 | 50% to 75% of the leaf area | 3 |
| 4 | more than 75% of the leaf area | 4 |
In the context of disease diagnosis, diseases are typically characterized by their severity and disease index. Disease severity is defined as the extent of the diseased unit and is expressed as a percentage of the total area of the diseased unit[39]. This calculation is represented by the following Equation (1) .
Where is the disease severity; is the diseases level, take the value ; is the number of units with level ; is the level of diseases with .
1.2 MDC-U-Net3+ for semantic segmentation
1.2.1 Improvement of U-Net3+ base network
Aiming at addressing the indistinct boundaries among the tea disease severity levels of five investigated diseases, a novel lightweight model of MDC-U-Net3+ was proposed. The overall structure of the MDC-U-Net3+ framework is shown in Fig. 3, which is redesigned to solve the indistinct boundaries among the disease severity levels of five investigated diseases. The model improved the U-Net3+ base network by optimizing the backbone network, full-scale skip connection structure, and segmentation modules. This optimization can alleviate the encoder's vulnerability to feature loss and the decoder's underutilization of multi-scale features, which can preserve the clarity of disease edge features and can achieve better segmentation results characterized by indistinct boundaries.
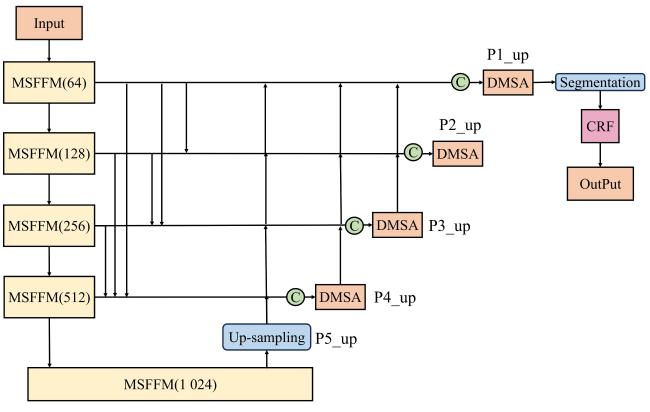
Fig. 3 The network structure of MDC-U-Net3+ for sematic segmentation of tea disease |
U-Net3+[32] is adopted as the base network, as shown in Fig. 4, which employs an end-to-end U-shaped network framework mainly segmented into down-sampling and up-sampling stages. The down-sampling process is similar to the process of U-Net[40, 41] and U-Net++[19, 42] models. In contrast, during the up-sampling phase, U-Net3+ utilizes full-scale skip connections to extract additional information. This framework of U-Net3+ can optimally integrate low-level and fine-grained infested details with high-level semantic features, better solving the gradient vanishing in deeper network layers, facilitating the back-propagation of gradients, and accelerating the training process of the model. To learn the hierarchical representations from the multi-scale aggregated feature maps, U-Net3+ applies a deeply supervised strategy. Therefore, in each decoding layer, the feature maps generated by feature aggregation are sequentially processed by 3×3 convolution, up-sampling, and sigmoid function to obtain the deeply supervised output, which is ultimately fed into the loss function. One of the up-sampling methods utilized is bilinear up-sampling, which aims to restore the resolution of the feature map to that of the input image.
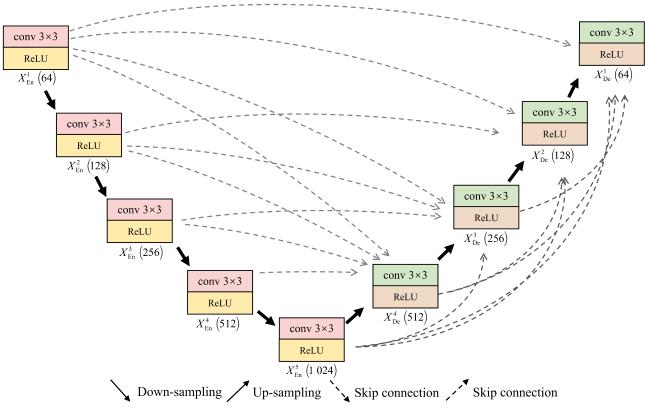
Fig. 4 Structure of U-Net3+[32] |
As shown in Fig. 3, to resolve the loss of features associated with disease spots, the MDC-U-Net3+ network, upon receiving image inputs of varying dimensions, first undergoes down-sampling through the encoding layer. The decoder module of the original U-Net3+ model is replaced with the MSFFM[43], allowing for the extraction of features related to tea disease spots. To improve the utilization of multi-scale information and refine segmentation boundaries, the DMSA module is integrated into all skip connection structures of the decoder. DMSA, an attention module proposed by Sagar[44] in 2022, aggregates feature information across different scales and employs spatial and channel attention mechanisms to capture contextual information at varying levels. This approach facilitates the adaptive integration of local features with global information. To address the challenge of blurred segmentation boundaries, the resulting segmentation is processed through a conditional random field. This step enables the classification of pixel points according to their respective categories, enhances edge refinement, and improves overall segmentation performance.
1.2.2 Backbone network improvement via multi-scale feature fusion
To alleviate the feature loss issue in the coding layer during down-sampling, the U-Net3+ backbone network is improved by incorporating multiscale features. U-Net3+ typically employs either VGGNet or ResNet as its backbone network. However, due to the inconsistent image scales in the tea dataset and the variable external manifestations of the same disease spot, the original backbone network faces limitations, such as an inability to integrate global contextual information, which may lead to feature loss during the transmission process. In address these challenges, MSFFM is proposed, as shown in Fig. 5, to effectively extract information of tea leaf spots by acquiring feature images with different receptive fields. This module first applies standard convolution and dilated convolution of varying sizes to the input feature maps to generate feature maps with different receptive fields. Subsequently, it performs channel concatenation on each feature map using the concatenate operator, followed by refining the multi-receptive-field feature maps through double-layer 3×3 convolution, batch normalization (BN), and ReLU activation. Finally, the maximum pooling layer is employed to halve the size of the feature maps while doubling the number of channels, which further enhances the accurate aggregation of feature maps across different receptive fields.
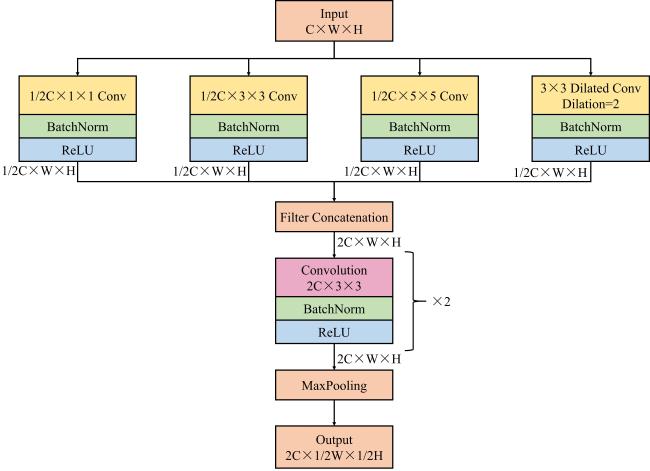
Fig. 5 The proposed structure of the multi-scale feature fusion module (MSFFM) |
1.2.3 Skip connection structure improvement using the DMSA module
The issue of insufficient exploitation of multi-scale information during direct feature aggregation in the skip connections of the U-Net3+ network, which leads to edge blurring is addressed. To mitigate this issue, DMSA is employed in the skip connection phase, as illustrated in Fig. 6. The input to this module is derived from feature maps of the smaller-scale and same-scale encoding layers, as well as the larger-scale decoding layer. Feature maps from the smaller-scale encoding layer preserve fine-grained detailed information of the disease, whereas those from the larger-scale decoding layer encapsulate coarse-grained semantic information. These two types of feature maps are fused to generate 320-channel feature maps, thereby enabling the initial integration of coarse-grained and fine-grained semantic information. The fused feature maps are processed through spatial and channel attention mechanisms to enhance the expressiveness of disease-related features by capturing the between channels and spatial positional relationships. Subsequently, local features are integrated with global information to achieve deep fusion of coarse-grained and fine-grained information. To further address the issue of blurred segmentation boundaries, the segmentation results are processed using a conditional random field(CRF), which evaluates the categories of pixel points to refine edges and improve segmentation accuracy.
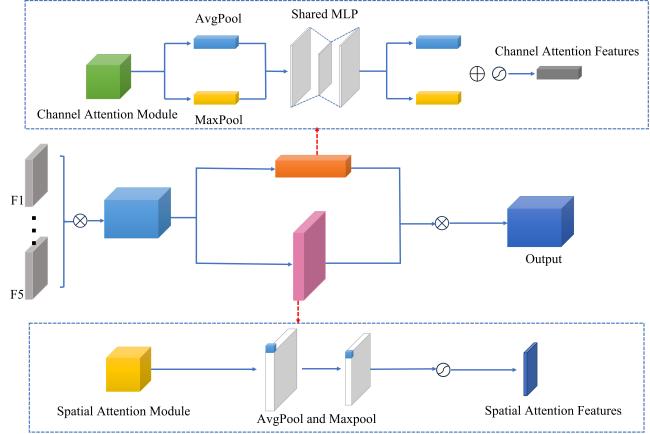
Fig. 6 The proposed structure of dual multi-scale attention (DMSA) |
1.2.4 Improvement of segmentation result with CRF
In the UNet3+ model, repeated down-sampling operations reduce the size of feature map while increasing network depth, which results in substantial loss of edge information loss. This loss contributes to blurred segmentation boundaries. To address this issue, CRF is employed to optimize the segmentation results. As a probabilistic model, CRF utilizes an energy function to represent segmentation results, with improved performance achieved by minimizing this function. To effectively minimize the energy function,it is essential to consider factors such as pixel distance and color similarity as well as to further assess the category of each pixel. This approach enables fine boundary segmentation, thereby optimizing the segmentation results. The energy function is defined by Equations (2) to Equation (4) .
Where is the pixel observations; is pixel label sequence; is the unary potential function, which measures the cost of labeling pixel as category ; is the pairwise potential function, representing the interaction between pixel and pixel ; is predicted results for given pixels; is potentials between different labels, which encourages neighboring pixel labels to be similar; is the potential between different observations, making consistent with labelling between neighboring pixels by observation similarity.
2 Results and discussions
2.1 Experimental setup and evaluation metrics
To accelerate model training and optimize parameters efficiently, experiments were conducted on the Ubuntu 20.04 operating system. The hardware configuration consisted an Intel Xeon E5-2690 V4 CPU and an NVIDIA GeForce RTX 3080 Ti with 12 GB of video memory. The software environment comprised Python 3.8.12, TensorFlow 2.8.0 for model construction and optimization, and CUDA 11.4.0 with cuDNN 8.2.4 for GPU acceleration.
The model input was a 3-channel RGB image, with a batch size of 2, a total of 100 training epochs, and the Adam optimizer was employed with a momentum parameter of 0.9 and an initial learning rate of 0.002. To improve training efficiency, a transfer learning strategy was employed, utilizing weights derived from training on the ImageNet dataset as the initial parameters. To further reduce training time, 50 rounds of freezing and unfreezing phases were implemented during model training. During the freezing phase, the model was initially loaded with parameters trained on ImageNet, after which the feature extraction network was rendered untrainable, allowing only the parameters of the tuning layer to be adjusted, followed by training the model to update the tuning layer parameters. In the unfreezing phase, all parameters of the feature extraction network were first set to a trainable state, allowing all model parameters to be trained, while the learning rate was adjusted to balance the training speed between the pre-trained model and the fine-tuning layer. Freezing the weights of the pre-trained model can expedite model convergence while reducing both training time and resource consumption. The unfreezing phase facilitates the inclusion of additional parameters in the training process, enabling the model to gradually adapt to task requirements and enhance performance through the fine-tuning of the pre-trained model's weights.
Fig. 7 shows the loss curves of the model for both the training and validation sets. Initially, during the freezing phase, the loss decreases rapidly, indicating that the model converges quickly to the dataset. Subsequently, the rate of decrease gradually slows as the model primarily focuses on learning generic features. At the onset of the unfreezing phase, the frozen weights must be readjusted to adapt to the dataset, resulting in a rapid increase in the losses of both the training and validation sets over a brief period. Finally, the increased number of updated parameters during the unfreezing phase necessitates additional training time to identify optimal weights, resulting in a more gradual decrease in the loss curve until it stabilizes.
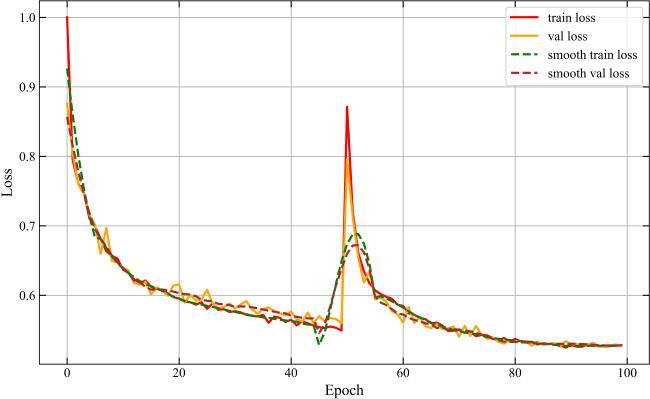
Fig. 7 Loss curves of MDC-U-Net3+ on training set and validation set |
The performances of semantic segmentation model are primarily evaluated using four indicators: mPA, mIoU, Precision and Dice. The lightweight nature of the models is assessed based on frames rate (FPS), average training time, and model size. mPA, or mean pixel accuracy, is a pixel-level performance evaluation metric that measures the average pixel classification accuracy of the model over the entire dataset. mIoU represents the average ratio of intersection to union, serving as a metric for evaluating the performance of segmentation models by quantifying the overlap between predicted and ground truth regions. Precision represents the ratio of correctly predicted positive regions to the number of predicted positive regions. The dice coefficient is used to calculate the similarity between predicted and the labeled region. All indicators are defined as shown in Equations (5) to Equation (8) .
Where is the number of target categories other than background; is the number of pixels with true value but predicted to be ; is the number of pixels with true value and predicted to be ; is the number of pixels with true value but predicted to be .
To analyze the impact of different dataset splitting ratios on the model further, the data was split into training, validation and test sets using the following ratios: 6:2:2, 7:2:1, 7:1:2, and 8:1:1. These were then enhanced and trained separately. The results are shown in Table 3. The model performed worst across all metrics when the dataset split ratio was 8:1:1. The 6:2:2 split ratio yielded the best performance, providing sufficient data volume in the training set while ensuring adequate sample sizes in the validation and test sets. This resulted in improved generalization capability and stability. Therefore, the split ratio of 6:2:2 was adopted for subsequent experiments across all category datasets.
Table 3 Segmentation experiment results of MDC-U-Net3+ on different dataset division ratios |
| Dataset division ratios | mPA/% | mIoU/% | Precision/% | Dice/% |
|---|---|---|---|---|
| 8∶1∶1 | 93.73 | 89.20 | 94.63 | 93.78 |
| 7∶2∶1 | 94.20 | 90.26 | 95.28 | 94.29 |
| 7∶1∶2 | 94.90 | 90.88 | 95.24 | 94.56 |
| 6∶2∶2 | 94.92 | 90.90 | 95.24 | 94.58 |
2.2 Backbone network selection experiment
To identify the most suitable backbone network, experiments were conducted to compare the effects of various backbone networks on the performance of the base model U-Net3+ in tea spot segmentation. The backbone networks utilized for the comparative experiments included VGG16[45], VGG19[46], ResNet50[47,48], ResNet101[49], and a 5-layer MSFFM, with the results presented in Table 4. The results indicate that the model utilizing ResNet as the backbone network outperforms the model employing VGG in terms of all indicators. This model utilizing the 5-layer MSFFM as the backbone network exhibits varying degrees of improvement in all indicators compared to U-Net3+ with the backbone networks. Specifically, the mPA improved by 1.22 percentage points, and the mIoU by 0.5 percentage points when compared to the optimal ResNet50. Conversely, when the least effective VGG19 was considered, the mPA was improved by 1.58 percentage points, and the mIoU by 0.24 percentage points.
Table 4 Performances comparison of different models as backbone networks for tea leaf disease segmentation models |
| Backbone network | mPA/% | mIoU/% |
|---|---|---|
| VGG16 | 93.35 | 88.84 |
| VGG19 | 92.71 | 89.04 |
| ResNet50 | 93.07 | 88.78 |
| ResNet101 | 93.69 | 88.92 |
| 5-layer MSFFM | 94.29 | 89.28 |
2.3 Performance comparison of semantic segmentation models
This study evaluated the effectiveness of the proposed model against four classical semantic segmentation models: DeepLab V3+[50], PSPNet[51], U-Net[40], and U-Net3+[32], using the tea leaf spot segmentation dataset. The performance comparison results were evaluated using mPA, mIoU, Precision, Dice, and three lightweight indicators. As shown in Table 5, compared to the performance of DeepLab V3+ and PSPNet, networks based on the U-Net architecture were more advantageous for tea leaf disease spot segmentation. MDC-U-Net3+ outperformed other networks across four evaluation metrics, achieving the optimal results in segmentation performance. Compared with U-Net3+ (which ranks second in performance), MDC-U-Net3+ demonstrates varying degrees of improvement across all four metrics. Its mPA value reached 94.92%, representing a 1.85 percentage point improvement over the baseline U-Net3+ model. The mIoU value increased by 2.12 percentage points, achieving 90.9%. This not only validated the effectiveness of the proposed optimization strategy but also confirmed its ability to achieve higher segmentation accuracy. In the lightweight evaluation, the U-Net model takes the lead overall, achieving 24.57 frames/s in FPS and 38.63 ms in average inference time. DeepLab V3+ performs best in terms of volume, at only 10.99 MB. While MDC-U-Net3+ excels in segmentation accuracy, it comes with high costs in lightweight performance.
Table 5 Performance comparison of tea leaf spot segmentation across different models |
| Model | mPA/% | mIoU/% | Precision/% | Dice/% | Frame rate/(f/s) | Average inference time/ms | Model size/MB |
|---|---|---|---|---|---|---|---|
| DeepLab V3+ | 88.59 | 84.38 | 94.67 | 89.85 | 22.476 2 | 44.898 6 | 10.987 4 |
| PSPNet | 91.91 | 84.81 | 86.71 | 88.78 | 9.601 5 | 44.499 6 | 9.601 5 |
| U-Net | 92.50 | 86.71 | 92.55 | 91.50 | 24.568 7 | 38.632 2 | 95.031 1 |
| U-Net3+ | 93.07 | 88.78 | 94.59 | 92.96 | 20.633 6 | 48.576 1 | 143.031 8 |
| MDC-U-Net3+ | 94.92 | 90.90 | 95.24 | 94.58 | 14.173 4 | 68.313 2 | 308.483 8 |
2.4 Ablation experiment
To better understand the proposal, ablation test was conducted to evaluate the practical results by comparing U-Net3+, MSFFM+U-Net3+, DMSA+MSFFM+U-Net3+, and MDC-U-Net3+ in terms of four indicators across identical datasets and testing environments. The performance of each model on the test set is shown in Fig. 8. The lightweight versions of the four models were also evaluated at the same time, and the results are shown in Table 6.
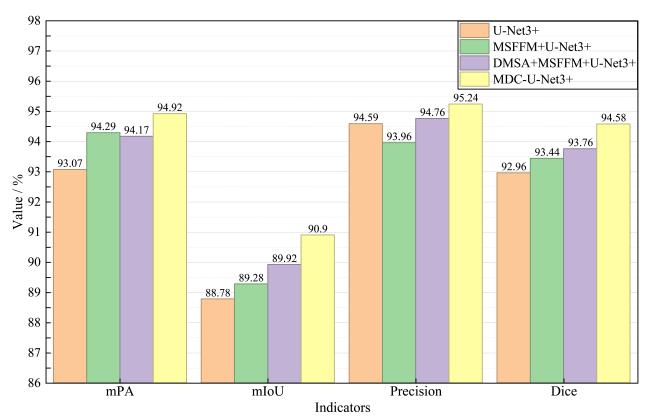
Fig. 8 Four indicators analysis for each model on test set of segmentation study |
Table 6 Lightweight ablation of MDC-U-Net3+ on test set of segmentation study |
| Model | Frame rate/(frames/s) | Average training time/ms | Model size/MB |
|---|---|---|---|
| U-Net3+ (Baseline) | 20.633 6 | 48.576 1 | 143.031 8 |
| MSFFM+ U-Net3+ | 20.102 2 | 49.984 4 | 308.008 4 |
| DMSA+MSFFM+ U-Net3+ | 16.813 7 | 57.489 6 | 308.483 8 |
| MDC-U-Net3+ | 14.173 4 | 68.313 2 | 308.483 8 |
Fig. 8 shows that U-Net3+ archieves an mPA of 93.07% and an mIoU of 88.78%. When the encoders in each layer of the U-Net3+ network are replaced with the MSFFM, the mPA of the resulting MSFFM+U-Net3+ model increases to 94.29%, reflecting an improvement of 1.22 percentage points compared to U-Net3+. This enhancement suggests that the MSFFM module mitigates the feature loss during down-sampling by capturing feature information across various receptive fields. However, it also causes slight background misclassification, leading to a drop precision to 93.96%. Moreover, the addition of extra convolutional layers and fusion operations triggers an exponential increase in the parameter count, resulting in a substantial increase of model size. Incorporating the DMSA module into MSFFM+U-Net3+ results in an mIoU of 89.92% for the DMSA+MSFFM+U-Net3+ model, 0.64 percentage points higher than that of MSFFM+U-Net3+, with a slight 0.32 percentage points rise in the Dice coefficient. This improvement indicates that the DMSA module effectively enhances the model's capacity to leverage spatial and channel information across all scales. This performance gain, however, comes with a 0.12 percentage point reduction in pixel classification accuracy in specific regions, along with degraded inference metrics such as frame rate and increased average training time due to higher computational complexity. Finally, refining segmentation results using CRF boosts the mPA of the MDC-U-Net3+ model by 0.75 percentage points compared to DMSA+MSFFM+U-Net3+, with more substantial improvements in mIoU and Dice, This is primarily due to the improved delineation of segmentation boundaries between the background and diseased tea leaves. These findings indicate that the optimized model significantly improves average pixel accuracy for tea disease diagnosis, with each improvement contributing positively to overall segmentation performance. Nevertheless, these improvements are accompanied by a trade-off in inference efficiency.
2.5 Visualization analysis
To visualize the segmentation effect of MDC-U-Net3+ on tea leaf spots and evaluate the practical efficacy of its edge processing module, the segmentation results are presented in Fig. 9. The results indicate that multi-scale disease-related features has been fully exploited, achieving fine segmentation of the edges of both diseased spots and tea leaves. This thus lays a foundation for the accurate calculation of diseased spot and leaf areas. Furthermore, as illustrated in Fig. 9, the model can achieve effective segmentation even when a single tea leaf is infected with multiple diseases, which allows for the independent assessment of the severity of each disease during diagnosis.
Fig. 9 Results of tea leaf disease segmentation of MDC-U-Net3+ |
| Original image | 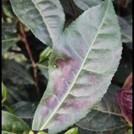 |  |  | 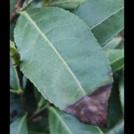 | 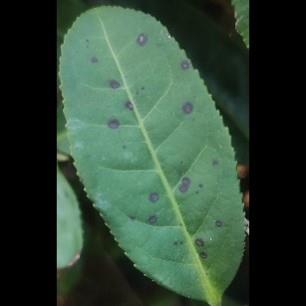 |
| Label | 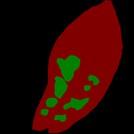 | 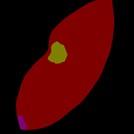 | 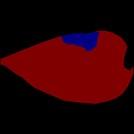 | 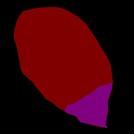 | 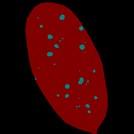 |
| Segmentation results of the proposed method | 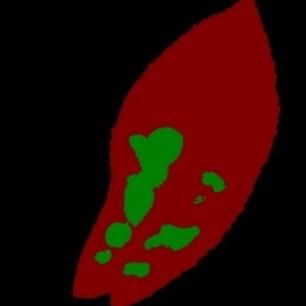 | 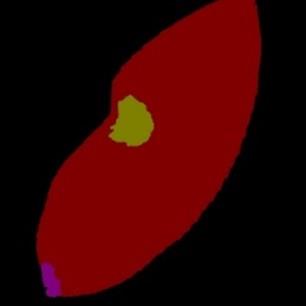 |  | 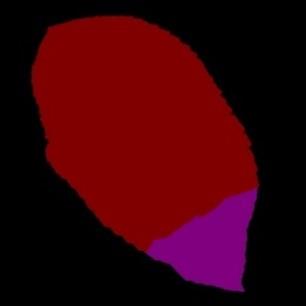 | 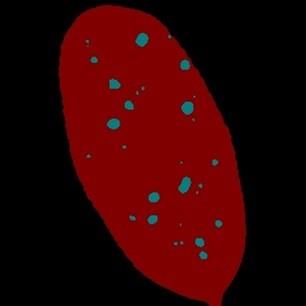 |
| Tea red leaf spot | Tea blister blight | Tea anthracnose | Tea leaf blight | Tea red scab |
2.6 Disease diagnosis
To assess the severity of the disease, the areas of disease spots and tea leaves were calculated. Distinct colors were used to represent different categories in the segmented images, and the number of pixels corresponding to each category was counted. Taking tea leaf blight in Fig. 9 as an example, the segmented image has a resolution of 512×512 pixels, with disease spots accounting for 14.22% of the total leaf area. According to the grading standards for tea leaf diseases presented in Table 2, this sample was classified as Grade 1 infection for disease severity.
In contrast to the other four disease types, the severity of tea red scab is determined by the number of spots present on the diseased leaves, in accordance with the established disease grading criteria. Consequently, the closed areas on the affected leaves were quantified, with each closed area corresponding to a single spot. For instance, as illustrated in Fig. 9, there are 26 closed areas in addition to the background. According to the disease grading standards for tea leaves presented in Table 2, the severity of tea red scab in this image is classified as Grade 2.
To conduct a comprehensive evaluation of the disease severity diagnosis accuracy, 100 images representing various disease categories were randomly selected from the dataset using stratified sampling. The experimental results indicate that image segmentation with MDC-U-Net3+ yields accuracy of disease severity diagnosis for five diseases, as presented in Table 7.
Table 7 Accuracy of tea leaf disease severity diagnosis wtih MDC-U-Net3+ |
| Disease types | Accuracy of disease severity diagnosis/% |
|---|---|
| Tea anthracnose | 90 |
| Tea leaf blight | 91 |
| Tea red scab | 70 |
| Tea blister blight | 85 |
| Tea red leaf spot | 89 |
| Average | 85 |
As indicated in Table 7, the diagnosis accuracy of disease severity for tea red scab was only 70%, with a substantial proportion of undiagnosed cases exhibiting underestimated severity level. This discrepancy can be attributed to the optimization of the segmented image using CRF, which resulted in certain pixel points being misclassified as diseased leaves. Consequently, the number of identified diseased pixels was lower than that in the manually labeled images, leading to an underestimation of disease severity and adversely affecting the statistical accuracy of this category. For tea blister blight, the final stage is characterized by brown discoloration surrounding the disease spots. This feature overlaps with a key symptom of tea anthracnose, which also exhibit brown circles around their lesions. This morphological similarity causes misclassification between the two diseases, thereby reducing mIoU in semantic segmentation. Moreover, background information significantly influences the accuracy of diagnosing disease severity. The presence of extraneous green leaves in the background of certain images results in an overcount of healthy lesf pixels (misclassified as diseased leaf tissue), which in turn results in an inflated denominators when calculating the damage degree using area ratios, thereby adversely impairing the accuracy of the subsequent statistical analysis.
3 Conclusion
In this study, an innovative semantic segmentation model, MDC-U-Net3+, is proposed for the diagnosis of tea leaf diseases. Based on the U-Net3+ architecture, this model integrates a MSFFM module and embeds a DMSA module, which is incorporated at the skip connection stage. These modifications are designed to alleviate the issues of feature loss and the segmentation edges blurring in the encoder stage. To further refine the segmentation results, CRF processing is applied to the the fully connected layer. Comparative experiments with state-of-the-art models demonstrate that the proposed model exhibits superior segmentation performance. Experimental results indicate that the improved MDC-U-Net3+ model increases the mean pixel accuracy and the mIoU by 1.85 and 2.12 percentage points, respectively, compared with U-Net3+. This improvement provides an effective technical solution to the key segmentation challenges in tea leaf disease spots.
While this study successfully achieves accurate segmentation of tea leaf diseased spots, it is crucial to acknowledge that certain infected leaves may exhibit morphological fragmentation due to disease tprogression or adverse environmental conditions. To alleviate this issue, the contour information of diseased leaf images can be leveraged to perform the image restoration and enhancement, thereby reducing diagnostic errors associated with the quantitative evaluation of disease severity.


