


0 引 言
1 材料与方法
1.1 层间特征表示相似性
1.2 CKA校正因子
1.3 秩分配算法
1.4 秩分配更新策略
| 算法: RRA |
|---|
| Input: Pre-trained model , dataset . Predefined: max rank , min rank , total epochs , calibration epochs , Importance weights , Bias weights , . # Initialization the LoRA parameters ( , alpha, dropout) for each target layer.lora_config ← ComputeInitialRanks( , ) by formula ( # Initialize the LoRA low-rank matrices according to lora_config, where follows a random Gaussian distribution and is initialized as a zero matrix. 0 Initialize optimizer for LoRA parameters # Initialize trigger threshold # Training Loop for epoch = 1 to do Update by minimizing loss on dataset . CalculateAvgParamChange( , ) by formula ( If == then . # Set initial threshold. else if and then # Trigger rank update // Merge LoRA weights for each target layer for each target layer l in M do
end for lora_config′ ← ComputeInitialRanks( ) # Initialize the new matrices and according to lora_config′. 0 Re-initialize optimizer for new LoRA parameters # Update threshold end if end for return |
2 结果与讨论
2.1 与全参数微调的对比
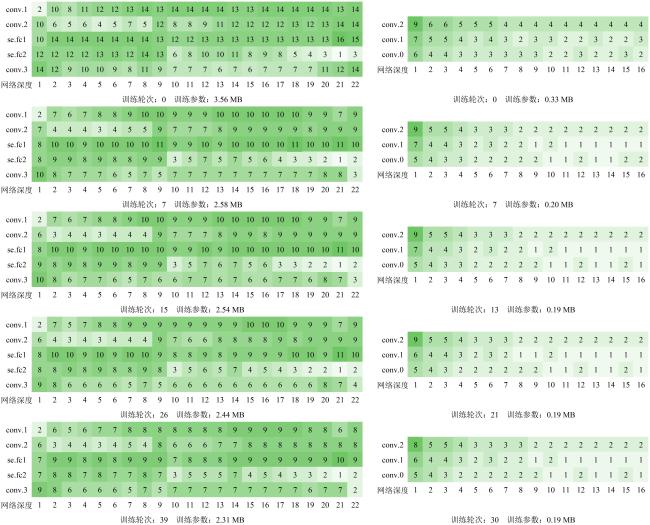
表1 AlexNet、MobileNetV2、RegNetY和ConvNeXt模型在各数据集上的准确率与训练参数对比Table 1 Comparison of the accuracy and the training parameters of AlexNet, MobileNetV2, RegNetY and ConvNeXt on each dataset |
| 模型 | 小麦病害数据集 | 植物病害数据集 | ||||||
|---|---|---|---|---|---|---|---|---|
| Full fine-tuning | DRA | Full fine-tuning | DRA | |||||
| mAP/% | Parm/M | mAP/% | Avg_Parm/M | mAP/% | Parm/M | mAP/% | Avg_Parm/M | |
| AlexNet | 81.75 | 217.62 | 80.09 | 0.90 | 90.41 | 217.62 | 89.42 | 0.66 |
| MobileNetV2 | 77.02 | 8.54 | 75.80 | 0.21 | 87.04 | 8.54 | 86.21 | 0.25 |
| RegNetY | 82.07 | 74.67 | 80.67 | 2.66 | 90.83 | 74.67 | 90.96 | 2.10 |
| ConvNeXt | 74.90 | 1 290 | 72.13 | 16.17 | 86.89 | 1 290 | 85.12 | 12.55 |
表2 AlexNet、MobileNetV2、RegNetY和ConvNeXt模型应用RRA策略在各数据集微调过程中的训练参数大小对比Table 2 Comparison of trainable parameter sizes during fine-tuning of AlexNet, MobileNetV2, RegNetY and ConvNeXt models with the RRA strategy on various datasets |
| 数据集 | 模型 | Epoch | Parm/M | Epoch | Parm/M | Epoch | Parm/M | Epoch | Parm/M | Epoch | Parm/M |
|---|---|---|---|---|---|---|---|---|---|---|---|
| 小麦病害数据集 | AlexNet | T0 | 1.35 | T7 | 1.01 | T17 | 0.76 | T29 | 0.72 | / | / |
| MobileNetV2 | T0 | 0.33 | T7 | 0.20 | T13 | 0.19 | T21 | 0.19 | T30 | 0.19 | |
| RegNetY | T0 | 3.56 | T7 | 2.58 | T15 | 2.54 | T26 | 2.44 | T39 | 2.31 | |
| ConvNeXt | T0 | 19.62 | T7 | 18.21 | T14 | 16.71 | T24 | 13.80 | T35 | 13.73 | |
| 植物病害数据集 | AlexNet | T0 | 1.38 | T7 | 0.62 | T19 | 0.49 | / | / | / | / |
| MobileNetV2 | T0 | 0.27 | T7 | 0.26 | T15 | 0.25 | T25 | 0.23 | T37 | 0.23 | |
| RegNetY | T0 | 3.64 | T7 | 1.83 | / | / | / | / | / | / | |
| ConvNeXt | T0 | 18.34 | T7 | 13.58 | T14 | 13.47 | T22 | 10.45 | T33 | 9.26 |
|
2.2 与LoRA方法的对比
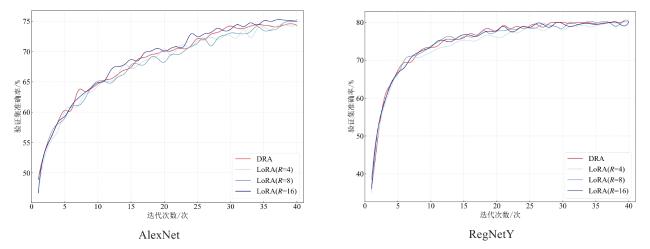
图4 AlexNet和RegNetY模型DRA与LoRA微调验证集准确率Fig. 4 Comparison of validation accuracy for AlexNet and RegNetY models under DRA and LoRA fine-tuning |
表3 AlexNet、MobileNetV2、RegNetY和ConvNeXt模型DRA与LoRA微调性能对比Table 3 Performance comparison of DRA and LoRA fine-tuning on various models |
| 模型 | LoRA(R=4) | LoRA(R=8) | LoRA(R=16) | DRA | ||||
|---|---|---|---|---|---|---|---|---|
| mAP/% | Parm/M | mAP/% | Parm/M | mAP/% | Parm/M | mAP/% | Parm/M | |
| AlexNet | 77.64 | 0.55 | 79.93 | 1.11 | 79.71 | 2.21 | 80.09 | 0.90 |
| MobileNetV2 | 75.54 | 0.41 | 75.51 | 0.83 | 75.40 | 1.66 | 75.80 | 0.21 |
| RegNetY | 79.67 | 1.34 | 80.79 | 2.69 | 80.86 | 5.37 | 80.91 | 2.66 |
| ConvNeXt | 70.26 | 6.29 | 71.42 | 12.57 | 72.64 | 25.14 | 72.13 | 16.17 |
2.3 消融实验
表4 不同 和 权重组合下AlexNet、MobileNetV2、RegNetY和ConvNeXt模型在小麦病害数据集上的消融实验准确率 ( %)Table 4 Accuracy of ablation experiments on AlexNet, MobileNetV2, RegNetY and ConvNeXt models under different and weight combinations on wheat disease dataset |
| 模型 | = 0, = 1 | = 0.15, = 0.85 | = 0.20, = 0.80 | = 0.25, = 0.75 | = 1, = 0 |
|---|---|---|---|---|---|
| AlexNet | 76.87 | 80.09 | 79.46 | 78.55 | 77.63 |
| MobileNetV2 | 74.58 | 75.80 | 76.79 | 76.94 | 74.73 |
| RegNetY | 73.76 | 80.67 | 80.38 | 80.99 | 79.24 |
| ConvNeXt | 65.65 | 72.13 | 71.26 | 70.81 | 69.66 |
表5 不同 和 权重组合下AlexNet、MobileNetV2、RegNetY和ConvNeXt模型在小麦病害数据集上的可训练参数量 ( M)Table 5 Trainable parameter count of AlexNet, MobileNetV2, RegNetY and ConvNeXt models under different and weight combinations on wheat disease dataset |
| 模型 | = 0, = 1 | = 0.15, = 0.85 | = 0.20, = 0.80 | = 0.25, = 0.75 | = 1, = 0 |
|---|---|---|---|---|---|
| AlexNet | 0.70 | 0.90 | 0.95 | 1.17 | 1.89 |
| MobileNetV2 | 0.15 | 0.18 | 0.18 | 0.21 | 1.16 |
| RegNetY | 0.67 | 2.66 | 2.88 | 3.42 | 4.30 |
| ConvNeXt | 10.26 | 16.17 | 17.53 | 19.3 | 24.12 |
2.4 鲁棒性分析
表6 ConvNeXt模型应用DRA方法在4种数据干扰下进行鲁棒性测试的准确率 ( %)Table 6 Accuracy of the ConvNeXt model with DRA method in robustness test under four data perturbations |
| 数据集 | DRA | Gaussian noise | Random crop | Color jitter | Random rotation |
|---|---|---|---|---|---|
| 植物病害数据集 | 85.12 | 83.02 | 83.98 | 79.10 | 80.01 |
| 小麦病害数据集 | 72.13 | 68.93 | 67.80 | 70.42 | 67.73 |
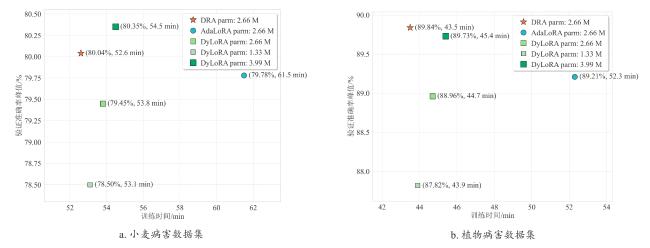
2.5 与先进低秩方法的对比
表7 DRA、AdaLoRA和DyLoRA方法的微调性能与参数预算对比Table 7 Comparison of fine-tuning performance and parameter budget among DRA, AdaLoRA, and DyLoRA methods |
| 模型 | 方法 | 小麦病害数据集 | 植物病害数据集 | ||
|---|---|---|---|---|---|
| Avg_Parm/M | mAP/% | Avg_Parm/M | mAP/% | ||
| AlexNet | DRA | 0.90 | 80.09 | 0.66 | 89.42 |
| AdaLoRA | 0.90 | 79.95 | 0.66 | 88.65 | |
| DyLoRA | 1.35 | 80.16 | 0.99 | 89.25 | |
| DyLoRA | 0.90 | 78.71 | 0.66 | 88.03 | |
| DyLoRA | 0.45 | 76.88 | 0.33 | 86.57 | |
| RegNetY | DRA | 2.66 | 80.67 | 2.10 | 90.96 |
| AdaLoRA | 2.66 | 80.55 | 2.10 | 90.41 | |
| DyLoRA | 3.99 | 80.81 | 3.15 | 90.75 | |
| DyLoRA | 2.66 | 79.83 | 2.10 | 90.02 | |
| DyLoRA | 1.33 | 78.52 | 1.05 | 88.94 | |


