


0 Introduction
Food security is crucial for the sustainable development of the world. In recent years, with the global population growth and the increasing exploitation of marine resources, marine net cage culture[1] is developing rapidly worldwide as an efficient and sustainable aquaculture method. However, with the expansion of aquaculture scale, rational use of natural resources to maximize the yield of net cage aquaculture faces many challenges. Traditional manual monitoring methods are inefficient and limited in coverage, so the introduction of remote sensing technology and object detection methods provides a new solution to rationalize the distribution of marine net cage aquaculture.
Remote sensing images have the characteristics of wide coverage, high resolution and real-time, which can quickly obtain the distribution information of farmed aquaculture net cages in large sea areas. Through the object detection technology of remote sensing images[2], the spatial distribution characteristics of the aquaculture net cages can be automatically identified and extracted to realize the monitoring of the position of the aquaculture net cages, which provides a solid database for the position distribution of marine net cages aquaculture, and also provides a scientific basis for the subsequent research. However, in the remote sensing image, the aquaculture net cage occupies few pixels, the resolution is relatively low, the appearance information is insufficient, and it is easy to miss detection during detection. Therefore, it is of high research significance and value to improve the detection accuracy of the aquaculture net cages in remote sensing images.
In recent years, with the rapid development of deep learning, object detection algorithms have experienced an evolution from traditional algorithms to two-stage and single-stage methods based on deep learning, with significant improvements in detection speed and accuracy. Traditional algorithms rely on hand-designed features and classifiers to classify and locate objects through candidate region generation, feature extraction, and the use of support vector machine (SVM)[3] or linear regression models. Two-stage algorithms based on deep learning divide the object detection task into two stages: candidate region generation and classification and regression, and the representative algorithms include region-based convolutional neural network (R-CNN) [4], fast regionbased convolutional neural network (Fast R-CNN)[5], and faster regionbased convolutional neural network (Faster R-CNN) [6]. Although the two-stage object detection algorithms are more advantageous in terms of accuracy and detection effect, they often involve complex models and run slower. Single-stage methods combine object localization and classification into a single process, representative algorithms include single shot multibox detector (SSD) [7] and YOLO (You Only Look Once) series[8-11], which have high speed but low detection accuracy, so researchers have focused on improving single-stage algorithms to balance speed and accuracy. GE et al.[12] proposed YOLOX on the basis of YOLOv5, which treats the classification task and the regression task separately to improve the detection accuracy and convergence speed. CBAM-YOLOv5[13] incorporates convolutional block attention module (CBAM) in the backbone network, which enhances the model's focus on the object region through channel and spatial attention mechanisms. FE-YOLOv5[14] model combines feature enhancement module (FEM) and spatial awareness module (SAM), which is used to capture finer semantic information and foreground features. KIM et al.[15] proposed an ECAP-YOLO model that enhances the YOLO backbone network with an efficient pyramid channel attention mechanism. LUO et al.[16] improved YOLOv5 by combining a feature extraction module containing three asymmetric convolutions to enhance the extraction of obscure features. The LCB-YOLOv5[17] model integrates a light-weight stabilization module (LSM) and a cross-level partial network with three convolutional structure modules for extracting multi-dimensional features of small objects. In addition, anchor-box-free object detection algorithms, such as fully convolutional one-stage (FCOS) [18] and FoveaBox[19], achieve object localization by predicting whether each pixel point in the image is the centroid of the object. Other approaches, such as CornerNet[20], Grid R-CNN[21], and RepPoints[22], are also based on centroids, but model the spatial structure of the object in a different way to improve the localization accuracy. In recent years, detection models such as detection transformer (DETR)[23], Deformable DETR[24], and Sparse R-CNN[25], on the other hand, propose a new end-to-end object detection paradigm that no longer relies on the traditional candidate frame generation process, thus achieving a breakthrough in methodology.
For the detection of small objects, many breakthroughs have also been made in recent years. BAI et al.[26] proposed a multi-task generative adversarial network, which improves the detection performance of small objects by introducing a super-resolution generator and a multi-task discriminator. The method not only performs high-quality super-resolution reconstruction of the small object region in the input image, but also designs the discriminator to simultaneously perform the tasks of true-false image recognition, object classification, and bounding box regression. By back-propagating the classification and regression losses to the generator, the model effectively recovers the detail information, which significantly enhances the detectability of small objects and achieves excellent performance on complex datasets such as common objects in context (COCO). BAI et al.[27] proposed a generative adversarial network (GAN) architecture that fuses super-resolution and detail recovery for the problem of blurry, low-resolution face detection in the field environment. The method combines an upsampling network with a detail-enhanced network to generate clear, high-resolution images. Additionally, a classification loss is incorporated during training to encourage the generator to produce facial images with more discriminative features, improving the distinguishability of different identities.
Moreover, the discriminator not only determines whether the image is true or false, but also determines whether it is a face at the same time. The method performs well on the WIDER FACE dataset and significantly outperforms existing methods, especially on the most challenging Hard subset. LI et al.[28] proposed perceptual generative adversarial network (Perceptual GAN), which aims to "super-resolve" the intermediate features of a small object. The inputs were "super-resolutionized" to better match the feature-space representation of large targets. The generator enhances the small object features through residual learning, and the discriminator combines perceptual and adversarial losses to not only determine whether the features are "real" but also to monitor whether they are useful for the detection task. This method significantly improves the performance of small target detection in traffic sign and pedestrian detection tasks, which validates the effectiveness of this strategy to enhance features at the feature level. However, these methods typically require a large number of medium- and large-sized samples, which poses a significant challenge when performing super-resolution on tiny objects with weak signals. In addition, these methods are prone to faking false textures and artifacts, which can degrade the detection performance. More notably, super-resolution architectures incur significant computational overhead, complicating end-to-end optimization and posing difficulties in practical applications of net cage aquaculture.
In addition to feature-level enhancement, recent methods have explored detection-aware image processing and architectural innovations. LI et al.[29] proposed density-map guided object detection network (DMNet), a density map guided detection framework for aerial images, which estimates object distributions using a multi-column convolutional network and generates non-uniform image crops based on density intensity. This approach effectively preserves contextual information and alleviates object truncation, thereby improving small object detection accuracy in high-resolution aerial datasets. Similarly, HUANG and LIU[30] proposed Libra EBox, a dense detector tailored for scale imbalance, which introduces libra ellipse sampling to increase sampling of small objects and residual low-level feature enhancement to fuse multi-scale low-resolution features with semantic information. A feature alignment module is also employed to reduce feature inconsistency across scales. Furthermore, ZHANG et al.[31] developed a cascade-based detection framework incorporating deformable convolutions, interleaved bounding box-mask refinement, cropping-based data augmentation, and model ensemble, effectively enhancing detection of small and densely distributed targets in unmanned aerial vehicle (UAV) imagery. These approaches highlight the importance of combining data-centric and structure-aware strategies to tackle the inherent challenges in small object detection.
In summary, deep learning based methods have shown broad application prospects in small object detection tasks in remote sensing images, and many results have been achieved. However, in the aquaculture net cage detection task, it is significantly more difficult and more challenging compared to general small object detection. First, the object size of aquaculture net cages is extremely small, occupying only a very small number of pixels in the remote sensing image, which leads to their being easily overwhelmed by the background information in the feature extraction process. Second, the spatial distribution of the aquaculture net cages is usually dense, and multiple objects are often gathered in the same area. This high-density distribution not only increases the overlap and occlusion problem in the detection task, but also easily causes mutual interference among the objects, which leads to omission and misdetection.
The large image area is land and contains a large amount of complex background information (e.g., vegetation, buildings), which poses a major challenge for accurate object detection in remote-sensing imagery. In addition, the aquaculture net cages are usually distributed in the darker ocean background, and their reflective signals are weaker compared to the brighter land areas, which not only increases the difficulty of distinguishing the object from the background, but also further compresses the range of the model's perception of the effective features. Accurate detection in remote sensing images with complex backgrounds, small objects, and dense distributions places high demands on the model's feature extraction, contextual perception, and fine-grained spatial reasoning capabilities.
To address the challenge of detecting densely distributed small aquaculture net cages, this study proposes the Cage-YOLO model incorporating three key components. Adaptive dense perception algorithm (ADPA) dynamically generates refined feature maps according to target distribution density, enabling focused perception in small-object-dense regions and adaptive multi-scale attention adjustment. Enhancement spatial pyramid pooling fast (ESPPF) optimizes the traditional SPPF[32] structure to enhance global semantic extraction and suppress background interference during multi-scale fusion. Mixed attention block (MAB) integrates spatial and channel attention for fine-grained feature enhancement, strengthening the network's ability to emphasize informative regions while maintaining a lightweight architecture.
1 Dataset and methods
1.1 Dataset and implementation details
In this study, a self-constructed, high-resolution remote sensing image dataset for marine net-cage aquaculture was utilized. The data were sourced from Google Earth satellite imagery and encompassed six representative marine aquaculture regions worldwide: Australia, Canada, Chile, Croatia, Greece, China, and the Faroe Islands. Specifically, the dataset included 50 samples from Australia, 173 from Canada, 233 from Chile, 56 from Croatia, 183 from Greece, 50 from China, and 33 from the Faroe Islands. All samples were collected from natural marine environments, as illustrated in Fig. 1. The original dataset comprised 778 high-resolution images, each with a spatial resolution of 7 168×7 168 pixels, providing detailed and fine-grained visual information.
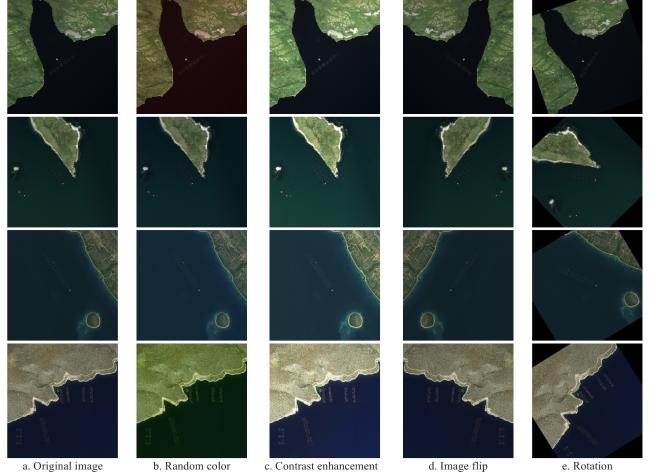
Fig. 1 Effect of aquaculture net cages image after data augmentation |
During the data preprocessing phase, various augmentation techniques were employed to improve the model's generalization ability and mitigate the risk of overfitting. Specifically, the dataset was expanded to 1 500 images through operations such as contrast enhancement, random rotations, color perturbations, and image flipping. These augmentations significantly increased data diversity and enhanced model robustness.
For annotation, the Labeling tool was utilized to meticulously annotate the aquaculture net cages within each image, ensuring high annotation accuracy and consistency. In the annotation process, both circular and rectangular aquaculture net cages were carefully labeled. Although the rectangular aquaculture net cages often appear as grids composed of multiple smaller units, from a practical perspective, these grids function as an integrated structure within the aquaculture system. Therefore, each rectangular aquaculture net cage was annotated as a single holistic bounding box, rather than marking each individual grid separately. The annotated bounding boxes for circular aquaculture net cages were approximately 100×100 pixels, and for rectangular aquaculture net cages approximately 220×120 pixels, while the resolution of each image was 7 168×7 168 pixels. Thus, each cage occupied only a very small portion of the overall image, typically less than 0.05% of the total pixel area. Fig. 2 presents representative annotated examples, showing that the aquaculture net cages are small in size and densely distributed, with many aquaculture net cages located close to each other. The close proximity and small object size pose inherent challenges for accurate detection within the images.
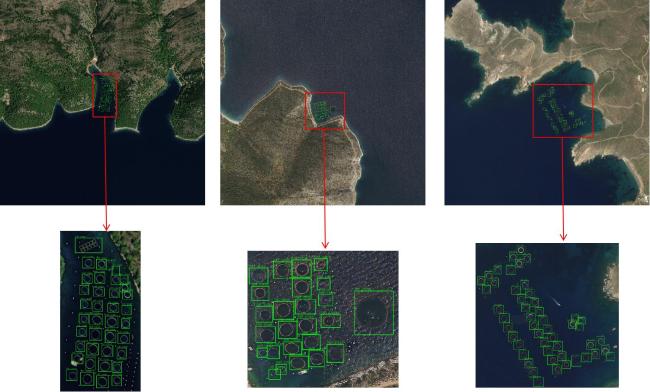
Fig. 2 Examples of figure annotations in the detection of aquaculture net cages study |
The dataset was initially stored in the Pascal VOC 2007 format and subsequently converted into the format required by the YOLO detection network. After data augmentation, the dataset was divided into training, validation, and test sets at a 7:2:1 ratio. To ensure consistency and prevent data leakage, the dataset splitting was conducted based on the original image identifiers prior to augmentation, ensuring that augmented images derived from the same source image were allocated to the same subset as their corresponding original image.
In the experimental setup, input images were resized to 640×640 pixels. The training was performed with a batch size of 32 for 300 epochs. The initial learning rate was set at 0.01, with a weight decay factor of 0.000 5 to regularize the learning process. Stochastic gradient descent (SGD) was adopted as the optimizer, and the learning rate was updated using a cosine annealing schedule to facilitate smooth convergence during training. For both the original YOLOv5 and the proposed model, the initial weights provided by the official YOLOv5 implementation, which had been pretrained on the COCO dataset, were utilized. The model structure used the standard YOLOv5 configuration, with a depth multiple of 0.33 and a width multiple of 0.50 to achieve a balance between detection performance and computational efficiency.
1.2 The structure of YOLOv5
YOLOv5 comprises four network variants, YOLOv5s, YOLOv5m, YOLOv5l, and YOLOv5x characterized by progressively increasing network width and depth. While recognition accuracy improves across these versions, this comes at the cost of reduced inference speed and increased hardware requirements. The different YOLOv5 versions have the same main structure but a few differences on some small modules. In this study, YOLOv5-6.0 was selected as the baseline model due to its favorable trade-off between computational efficiency and detection performance. The overall architecture of YOLOv5-6.0 is illustrated in Fig. 3.
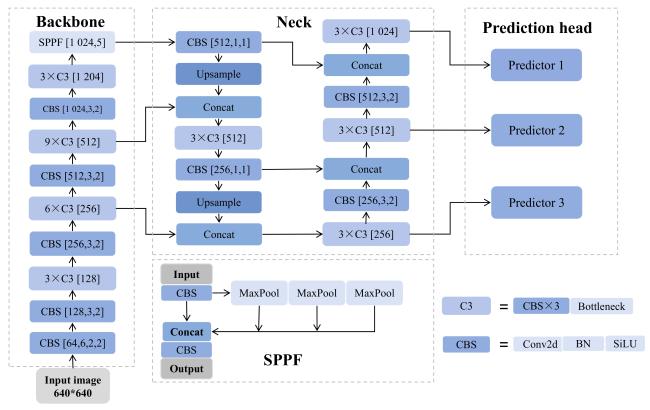
Fig. 3 The network structure of YOLOv5-6.0 |
The YOLOv5 network consists of four main components: image preprocessing, feature extraction (Backbone), multi-scale feature fusion (Neck), and object prediction (Head). During preprocessing, the Mosaic data augmentation strategy was employed, which randomly spliced, scaled, and cropped multiple images to generate diverse training samples, thereby enhancing the model's generalization capability. Additionally, adaptive anchor box calculation and adaptive image scaling were incorporated to optimize bounding box dimensions and input resolution, further improving detection accuracy and consistency across samples. The preprocessed images were then passed to the Backbone module, which performed initial feature extraction through a combination of the convolution + batch normalization + SiLU (CBS) structure, the CSPDarknet53 network and structure, and the SPPF module. The backbone network was composed of multiple Conv, CSPDarkNet53 (C3), and SPPF modules. Specifically, the Conv module consisted of Conv2d, followed by Batch Normalization and the sigmoid linear unit (SiLU) activation function. The C3 module, derived from CSPNet, served as the primary component for learning residual features. It adopted a dual-branch structure: one branch comprises three Conv modules and multiple Bottleneck layers, while the other branch contained only a single Conv module. The outputs of both branches were concatenated and subsequently forwarded to the following modules. At the end of the backbone, the SPPF module was introduced, which represents an enhanced variant of the spatial pyramid pooling (SPP) module. Unlike the conventional SPP that utilizes large-scale pooling kernels, SPPF employed a series of cascaded small-scale pooling kernels. This design choice aimed to improve computational efficiency while preserving the original capability of aggregating feature maps from different receptive fields, thereby enhancing the feature representation capacity of the network. For multi-scale feature fusion, the Neck module leveraged the path aggregation network (PANet)[33], which built upon the traditional feature pyramid network (FPN)[34] by introducing bottom-up path enhancement. This design facilitates more efficient information flow across different scales, thereby improving the detection of objects with varying sizes. In the final prediction stage, the Head module incorporated an improved complete intersection over union (CIoU) loss function[35] along with a weighted non-maximum suppression (NMS) strategy. CIoU extended the conventional IoU metric by including penalties for center point distance and aspect ratio discrepancies, thus enhancing bounding box localization accuracy. The weighted NMS further refined the detection output by preserving high-confidence candidate boxes while effectively suppressing redundant detections.
1.3 The structure of Cage-YOLO
Fig. 4 illustrates the network model of the proposed Cage-YOLO, and the improvements include: 1) The introduction of the ADPA to effectively identify the dense area of tiny aquaculture net cages. 2) The design of the feature enhancement block (FEBlock), which was integrated into the SPPF to form the ESPPF in the middle row, weakening the background noise and improving the global feature extraction. 3) Incorporating the MAB into the backbone network enhances feature representation and enables more accurate feature selection and information extraction.
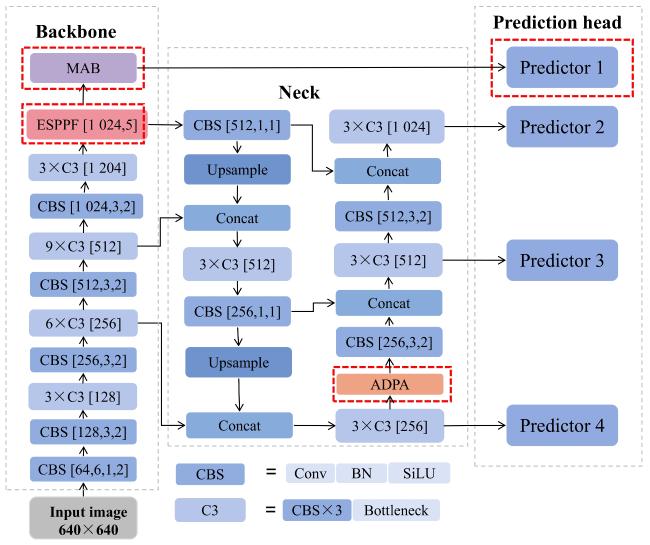
Fig. 4 The network structure of Cage-YOLO |
1.4 Adaptive dense sensing algorithm
In object detection within remote sensing imagery, it is difficult to detect effectively due to the wide image background and the small size and dense distribution of the aquaculture net cages. Therefore, the ADPA was proposed, in which an adaptive method of density estimation is employed to recognize and enhance high-density regions in the image.
The ADPA module was inserted after the multi-scale feature fusion and the second downsampling operation, specifically before the final C3 convolutional block. This design allowed the network to leverage feature maps that already contained rich semantic and spatial information, making it more suitable for performing adaptive density perception. By incorporating ADPA at this stage, the network could effectively highlight regions with higher object density through adaptive feature enhancement, thereby strengthening the model's sensitivity to dense, small-scale targets. This was particularly important for remote sensing scenarios where such targets were densely distributed and easily confused with background information. Furthermore, the enhanced feature maps were subsequently refined by the following convolutional layers and fed into the dedicated small-object detection branch (Predictor 4). This enabled the model to focus more precisely on dense regions, ultimately improving detection accuracy. Additionally, this placement struck a balance between detection effectiveness and computational efficiency, avoiding unnecessary overhead on high-resolution early-stage feature maps while maximizing the contribution of ADPA to small-object detection performance.
Firstly, the input feature map passes through convolutional layers to generate a single-channel density map , where is the batch size, is the number of input channels, and and are the height and width of the input feature map, respectively. The value at each location represents the density level of that area, calculated using the Equation (1) :
Where, and are the spatial coordinates of the density map; denotes the value at position in channel of the input feature map; denotes the weight of the convolutional kernel at channel and position ; represents the of the convolutionals kernel and represents the bias term.
After obtaining the density map, ADPA identifies high-density areas within it using the Equation (2) :
Where, denotes the position of the maximum density point in the density map .
A proposal is defined around the maximum response location in the density map , where and denote the row and column indices (i.e., vertical and horizontal coordinates) of the highest-density point, respectively.
The proposal box is defined using the top-left coordinate along with the width–height format, which is commonly employed in object detection tasks. The side length of the square box, denoted as , is determined by Equation (3) :
which ensures that the proposal adapts to the spatial resolution of the input feature map.
The coordinates of the proposal box are then calculated as Equation (4) :
ADPA cropped the corresponding region from the feature map and upsampled it to the same size as the original map by bilinear interpolation. The dense region feature map was fused with the original map in an element-by-element additive fusion to generate an enhanced feature map. Such fusion enhanced the dense region response while retaining the global context information to improve small object detection. The specific process is shown in Fig. 5.
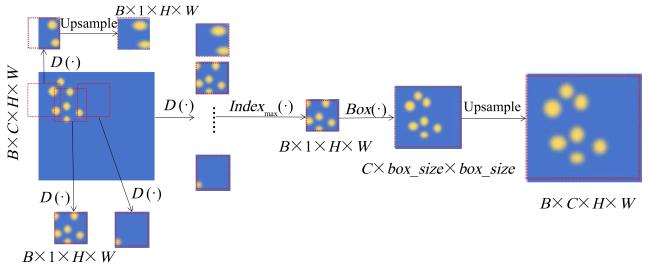
Fig. 5 The work flow of ADPA |
1.5 Enhancement spatial pyramid pooling fast
YOLOv5s adopts the SPPF structure, which, compared with SPP, accelerates the network's computation speed by changing the three parallel maximum pooling layers to a serial mode, effectively avoiding repetitive operations. However, the structure performs poorly in detection accuracy when dealing with small and dense objects. In order to solve this problem, a novel spatial pyramid pooling method based on SPPF was proposed in this study.
First, the feature enhancement block (FEBlock) is designed, which enables the effective integration of information from different channels without increasing the depth of the network. The FEBlock generates adaptive weights through convolutional operations for fusing the features from different sensory fields to enhance the representation of the features, and the structure of the block is shown in Fig. 6.
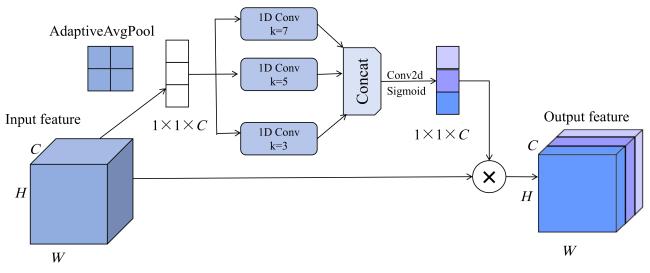
Fig. 6 The network structure of FEBlock |
First, the features are compressed into scalars of size in spatial dimension by global average pooling to generate a feature map of shape . Subsequently, one-dimensional convolutions with three different convolutional kernel sizes were used for processing, and the interaction between some of the channels is realized through a parallel mechanism. This design not only effectively realizes cross-channel interaction, but also avoids the model complexity problem that may be caused by the fully connected layer. Next, the weights of each channel were generated by 2D convolutional feature transformation and Sigmoid activation function, and the corresponding features were weighted and fused. Traditional convolutional operations usually synthesize the input feature maps of all channels, making it difficult to highlight the role of key feature channels. In contrast, FEBlock can dynamically adjust the distribution of channel weights to strengthen key features while suppressing redundant information. When inputting feature maps of different scales, it can also adaptively adjust the sensing field size to optimize for the characteristics of small objects in remote sensing images, thus significantly improving the performance of object detection.
Next, the FEBlock was introduced based on the original SPPF module, and the generated adaptive weights were applied to feature maps at different scales, thereby resulting in the proposed ESPPF module. The ESPPF module first generated feature maps with different sensory fields by pooling branches at a fixed scale, and then utilized FEBlock to compress the channels and embed the spatial information into the spatial attention map, thus generating new features containing multi-scale information. By weighted fusion of contextual features, the ESPPF module can effectively extract contextual information. When inputting feature maps of different scales, the model can adaptively adjust the size of the receiving region to highlight the region related to the objects. Consequently, compared to the original SPPF module, the ESPPF module, as shown in Fig.7, demonstrates stronger feature representation capabilities and enhanced robustness.
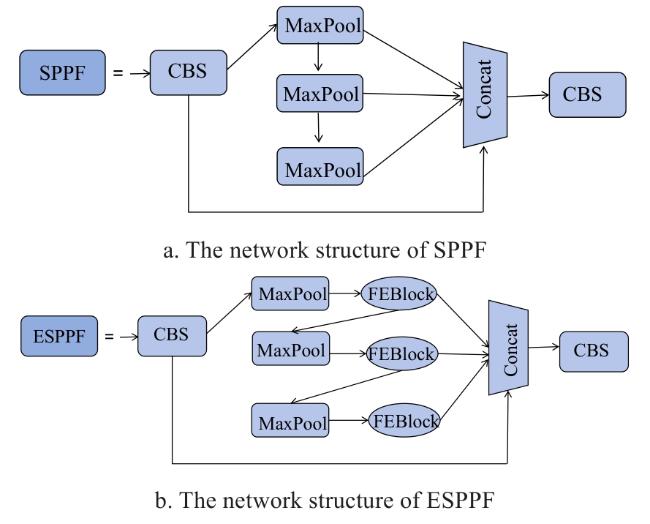
Fig. 7 Comparison between SPPF and ESPPF |
1.6 Mixed attention block
The incorporation of attention mechanisms in object detection aims to enhance detection accuracy without compromising inference speed[36]. Numerous studies[37] have demonstrated that mixed attention mechanisms can significantly improve performance in remote sensing object detection by enhancing both accuracy and robustness[38]. Motivated by these findings, a lightweight MAB was proposed, whose structural design is illustrated in Fig. 8c. The MAB integrates the complementary strengths of coordinate attention (CA)[39] and efficient channel attention (ECA)[40]. Specifically, the outputs of CA and ECA were fused via element-wise multiplication to realize multidimensional attention feature integration. A residual connection was subsequently applied to preserve the original input features, thereby enhancing salient feature representation and improving the model's overall perceptual capability.
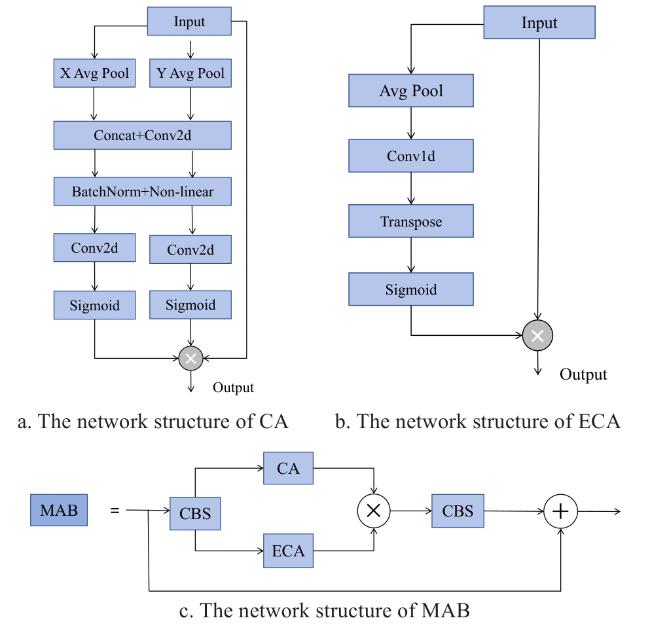
Fig. 8 Composition of MAB |
The CA mechanism captures both channel-wise dependencies and precise positional information, enabling the network to focus on spatially important regions with minimal computational overhead. As illustrated in Fig. 8a, CA consists of two key stages: coordinate information embedding and coordinate attention generation. It first applied global average pooling along the horizontal and vertical spatial dimensions, using window sizes of and , respectively, to produce a pair of direction-aware feature maps. These were then fused via channel compression, followed by nonlinear activation and a Sigmoid function to generate orientation-sensitive attention maps.
In contrast, the ECA mechanism emphasized efficient modeling of inter-channel relationships and long-range dependencies with low computational cost, as shown in Fig.8b. ECA comprises two main steps: global information aggregation and efficient attention generation. Initially, global average pooling compressed the spatial dimensions of the input to produce a compact descriptor for each channel. A one-dimensional convolution was then applied, with its kernel size adaptively determined to capture local channel dependencies without introducing the overhead of fully connected layers. The resulting features were passed through a transpose operation and Sigmoid activation to generate attention weights, which were used to reweight the input feature maps on a per-channel basis, thereby enhancing discriminative channel responses.
By combining CA and ECA, the proposed MAB was capable of accurately capturing critical target features while reducing inter-target feature interference. In the proposed network architecture, the MAB module was deliberately positioned at the final stage of the backbone to fully exploit the high-level semantic features extracted by the backbone and further refine these features through multi-scale attention mechanisms. While the deep features at this stage contain abundant semantic information, they inevitably included redundant details and background noise, which may hinder detection accuracy if directly utilized. By incorporating the MAB module at this point, the network could enhance its focus on potential target regions through a combination of global and local attention, thereby suppressing irrelevant information and strengthening the representation of critical features. This design effectively mitigates the deficiency of deep features in capturing fine-grained details, providing a more discriminative feature foundation for subsequent feature fusion and detection stages. Unlike attention mechanisms introduced at earlier stages, embedding MAB at the end of the backbone was more suitable for further optimizing features that already contain high-level semantics, thereby improving the robustness and accuracy of detection, particularly in remote sensing scenarios characterized by densely distributed small targets and complex backgrounds.
2 Results and analysis
2.1 Experimental platform
The hardware environment for this experimental platform included a CPU processor: Intel(R) Xeon(R) Platinum 8474C with 15 vCPUs, a GPU processor: NVIDIA RTX 4090D (24 GB) * 1, and the operating system was Ubuntu 18.04. The CUDA version was 11.1, and the deep learning framework was PyTorch 1.9.
2.2 Network performance evaluation indicators
In this study, precision (P), recall (R), mean average precision (mAP) and model size are used as evaluation metrics to assess the performance of the object detection model. P refers to the proportion of correctly predicted positive instances among all instances predicted as positive. R refers to the proportion of correctly detected positive instances among all actual positive instances. They are calculated using the Equation (5) and Equation (6) .
Where, (True Positive) denotes the number of instances where the model correctly predicts the presence of an object; (False Positive) denotes the number of instances where the model incorrectly predicts the presence of an object; and (False Negative) denotes the number of instances where the model fails to detect an object that is actually present.
The intersection over union (IoU) is a commonly used evaluation metric in object detection tasks, which measures the degree of overlap between the predicted bounding box A and the ground truth bounding box B. It is defined as the ratio of the intersection area between A and B to the union area of the two, as shown in the Equation (7) .
The value of IoU ranges from 0 to 1, where a higher IoU indicates a more accurate prediction. Specifically, a smaller numerator reflects poor overlap with the ground truth, while a larger denominator typically results from an excessively large predicted region, both leading to a lower IoU score.
Average precision (AP) represents the average detection performance of the model, defined as the area under the precision-recall curve. It is calculated as Equation (8) .
The mean average precision (mAP) is the mean of AP values across all object categories, and it reflects the overall performance of the model in terms of both precision and recall. A higher mAP value indicates better model performance. It is calculated as Equation (9) .
Where, is the number of object categories, and .
Specifically, mAP@0.5 denotes the mAP when the IoU threshold is fixed at 0.5, while mAP@0.5:0.95 represents the average mAP over multiple IoU thresholds ranging from 0.5 to 0.95.
The model size, measured in megabytes (MB), reflects the storage requirement of the trained network and directly affects its applicability in resource-constrained environments.
2.3 Experimental results
To validate the effectiveness of the proposed improved algorithm in object detection, a comparative experiment was conducted between the baseline model YOLOv5 and the improved model Cage-YOLO. The training results are illustrated in Fig.9, depicting the evolution of P, R, and mAP across training epochs. As shown in Fig. 9a, YOLOv5 exhibits rapid convergence during the initial 50 epochs, with precision increasing quickly and stabilizing around epoch 80, ultimately reaching approximately 86%. In contrast, Cage-YOLO demonstrates a relatively slower start, with some training lag observed in the first 60 epochs. However, the precision improved significantly thereafter, surpassing YOLOv5 after epoch 100 and stabilizing at around 94%. This indicated that although Cage-YOLO converges more slowly initially, it possessed a stronger learning capacity and could achieve superior accuracy given sufficient training, demonstrating improved positive sample recognition and enhanced false positive suppression capabilities. In Fig. 9b, it was observed that the recall of YOLOv5 gradually increased and stabilized at approximately 68%. Cage-YOLO, despite a slower improvement in the early stages, rapidly surpasses YOLOv5 around epoch 70 and ultimately reaches a recall of about 92%. This significant improvement in recall highlights Cage-YOLO's advantage in reducing missed detections, making it highly effective for applications where comprehensive object coverage is critical. Fig. 9c presents the mAP results, where YOLOv5 stabilizes at approximately 75%. In contrast, Cage-YOLO quickly surpasses this benchmark after epoch 100 and ultimately achieves an mAP of about 95%, representing a 17.4% improvement over YOLOv5. As mAP was a comprehensive metric reflecting the model's performance across varying IoU thresholds, this result clearly demonstrated the superior accuracy and robustness of the proposed method. Overall, the comparative results clearly indicate that Cage-YOLO exhibits superior convergence properties relative to the baseline YOLOv5. Despite a slower improvement during the initial training stages, the model eventually converges to substantially higher P, R, and mAP values. This behavior reflected a more stable optimization trajectory, reduced susceptibility to local minima, and enhanced learning capacity in complex detection scenarios. The ability of Cage-YOLO to consistently achieved a higher-performance equilibrium across multiple evaluation metrics provides strong empirical evidence of its improved convergence characteristics.
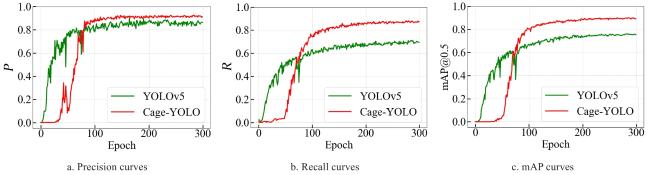
Fig. 9 Model training results of Cage-YOLO |
To further assess detection performance under complex visual conditions, qualitative comparisons were conducted by inputting test images into both YOLOv5s and Cage-YOLO. Representative detection results are shown in Fig. 10. It can be seen that YOLOv5 exhibits noticeable missed detections and false positives in scenes with dense object distribution, blurred boundaries, or occlusions-conditions typical of closely spaced aquaculture net cages. Its detection performance significantly degraded under these challenging scenarios. In contrast, Cage-YOLO demonstrated more robust and consistent object recognition performance. It effectively detected multiple aquaculture net cages in densely populated regions and maintained high detection accuracy even under conditions involving substantial scale variation and partial occlusion. Notably, Cage-YOLO showed strong capabilities in object separation and boundary localization, significantly reducing both false negatives and false positives. These results indicated that Cage-YOLO not only outperformed YOLOv5s across all evaluation metrics but also exhibited superior adaptability and robustness in complex environmental conditions, confirming its practical value for detecting densely distributed aquaculture structures in remote sensing imagery.
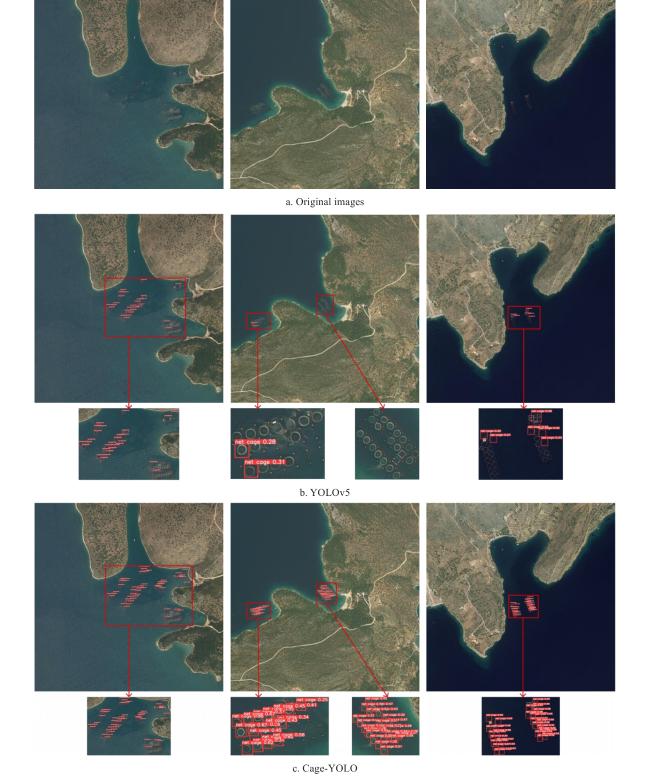
Fig. 10 Comparison of detection results in the detection of aquaculture net cages |
To further assess the robustness and limitations of the approach, several representative failure cases were analyzed to determine the common sources of error, illustrated in Fig. 11. These examples illustrated the types of visual challenges that our model currently struggles to overcome. In Fig. 11a, the failure appears to be primarily caused by background clutter. The visual scene contained complex textures and objects with appearance characteristics similar to the target, which introduced ambiguity and distracted the model during feature extraction. As a result, the model misidentified background regions as part of the target, leading to inaccurate localization. Fig. 11b illustrates a case of heavy occlusion. A large portion of the target object was obstructed by other elements in the scene, leaving only partial visual cues for the model to rely on. Since our method does not explicitly incorporate mechanisms to reason about occluded or invisible parts, the incomplete representation resulted in failure to correctly detect or segment the target. In Fig. 11c, the issue lies not with the model itself but rather with the ground truth annotation. Upon inspection, the labeling was either ambiguous or inconsistent with the visual content possibly due to human error or subjective interpretation of object boundaries. This led to a discrepancy between the model's prediction and the provided label, which was technically counted as a failure, even though the model's output may be semantically plausible. These cases underscored the importance of addressing real-world visual complexity including background distractors and partial occlusion, as well as ensuring high-quality, consistent annotations. Future work could explore integrating occlusion-aware modules, enhancing the model's ability to disambiguate visually similar contexts, and applying automated tools to detect and correct annotation errors.
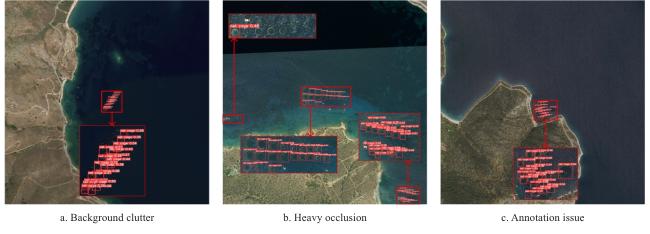
Fig. 11 Examples of Cage-YOLO detection failures in the detection of aquaculture net cages |
To further interpret the models' decision-making processes and identify their regions of interest during detection, the Gradient-weighted class activation mapping (Grad-CAM) technique was employed. Grad-CAM visualizations were generated by backpropagating the class-specific confidence gradients to the final convolutional feature maps, thereby highlighting the spatial regions contributing most to the model's predictions. In the resulting heatmaps, regions of high model attention are shown in dark red, while less significant regions are marked in dark blue. As depicted in Fig. 12, Cage-YOLO focuses more accurately and intensively on the aquaculture net cage objects and their surrounding areas, whereas YOLOv5s exhibits substantial attention drift, often responding to background noise or non-target regions. This discrepancy was especially evident in scenarios involving dense object distribution or blurred/occluded object boundaries. Cage-YOLO's attention maps align more precisely with object boundaries, aiding in accurate bounding box regression. These visualization results validated the effectiveness of the improved feature extraction and spatial attention mechanisms integrated into Cage-YOLO, which enhanced the model's capability to distinguish critical regions and improved detection performance under complex background conditions. In particular, Cage-YOLO exhibited superior discriminatory power when object details were subtle or submerged in background noise, providing a strong foundation for precise detection of aquaculture net cages in high-resolution remote sensing imagery.
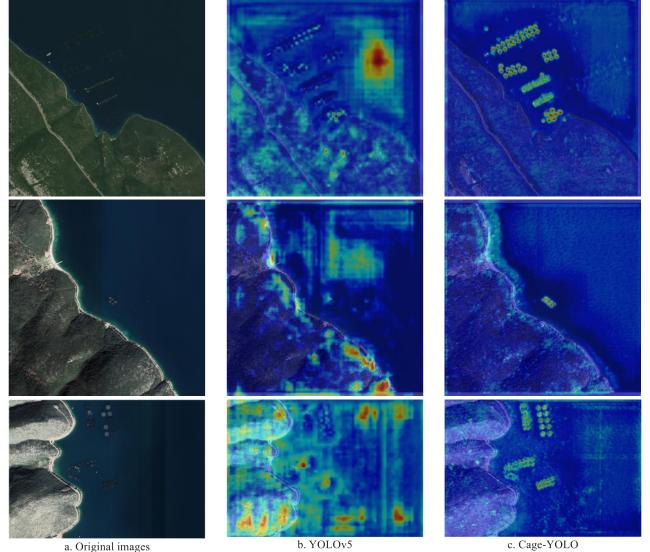
Fig. 12 Comparison of heat maps in the detection of aquaculture net cages |
2.4 Comparison with other models
To comprehensively evaluate the effectiveness of the proposed Cage-YOLO model, comparative experiments were conducted against several state-of-the-art object detection algorithms on the same high-resolution marine net cage dataset. The selected baseline methods include YOLOv5, YOLOv6s, YOLOv7, YOLOv8s, YOLOv9s, YOLOv10s, YOLOv11s, and Faster R-CNN, DERT. The performance metrics for comparison are summarized in Table 1.
Table 1 Results of comparison with other methods in the detection of aquaculture net cages |
| Method | P/% | R/% | mAP@0.5/% | mAP@0.5:0.95/% | Model size/MB |
|---|---|---|---|---|---|
| YOLOv5 | 89.9 | 71.5 | 77.8 | 41.5 | 14.4 |
| YOLOv6s | 84.8 | 68.7 | 71.5 | 35.3 | 38.1 |
| YOLOv7 | 90.8 | 81.3 | 87.9 | 47.4 | 72.0 |
| YOLOv8s | 91.5 | 77.7 | 84.7 | 47.6 | 22.5 |
| YOLOv9s | 84.8 | 73.7 | 77.7 | 41.0 | 26.7 |
| YOLOv10s | 88.6 | 77.8 | 82.7 | 45.9 | 28.8 |
| YOLOv11s | 90.0 | 78.1 | 84.4 | 48.2 | 37.6 |
| YOLOv12s | 87.7 | 79.4 | 83.2 | 47.2 | 19.1 |
| Faster R-CNN | 69.3 | 77.0 | 69.3 | 35.5 | 108.0 |
| DERT | 89.3 | 77.1 | 83.2 | 45.3 | 158.0 |
| Cage-YOLO | 95.5 | 93.3 | 95.2 | 54.9 | 16.9 |
The results demonstrated that, although Cage-YOLO introduced a slight increase in the number of parameters, it achieved substantial improvements in both mAP@0.5 and mAP@0.5∶0.95, outperforming the compared models across these key metrics. This indicated the enhanced capability of Cage-YOLO in accurately detecting small and densely distributed objects within complex backgrounds.
Moreover, despite the improvements in detection accuracy, Cage-YOLO maintained a compact model size of only 16.9 MB. This lightweight design made it particularly well-suited for deployment in real-world marine aquaculture monitoring scenarios, where computational resources may be limited. The balance between high accuracy and model efficiency highlights the practical applicability of Cage-YOLO in remote sensing-based detection tasks.
2.5 Ablation experiments
Verifying the practical role of each module proposed in this study in enhancing the model performance, ablation experiments were designed and conducted based on YOLOv5 as the baseline model. A total of 8 sets of model combinations were constructed for the experiments, introducing the ADPA, ESPPF and MAB, respectively, including various configurations of single module and multi-module combinations. The experimental results are shown in Table 2.
Table 2 Results of the ablation studies in the detection of aquaculture net cages |
| Baseline | ADPA | ESPPF | MAB | P/% | R/% | mAP@0.5/% | mAP@0.5:0.95/% |
|---|---|---|---|---|---|---|---|
| √ | — | — | — | 89.9 | 71.5 | 77.8 | 41.5 |
| √ | √ | — | — | 90.6 | 83.9 | 87.1 | 48.2 |
| √ | — | √ | — | 95.3 | 88.2 | 92.9 | 54.9 |
| √ | — | — | √ | 89.6 | 72.8 | 78.2 | 40.6 |
| √ | √ | — | √ | 94.4 | 90.5 | 93.2 | 54.6 |
| √ | — | √ | √ | 95.9 | 88.7 | 91.9 | 54.1 |
| √ | √ | √ | — | 93.9 | 85.3 | 90.7 | 51.0 |
| √ | √ | √ | √ | 95.5 | 93.3 | 95.2 | 54.9 |
|
From the experimental results, it can be seen that all three modules bring different degrees of improvement to the detection performance when they are introduced individually. Compared with the baseline model, the introduction of ADPA alone improved the P to 90.6%, R significantly to 83.9%, and mAP@0.5 and mAP@0.5∶0.95 to 87.1% and 48.2%, respectively, which indicated that the module was effective in improving the model's ability to perceive high-density small object regions; the introduction of the ESPPF module improved P, R, mAP@0.5 and mAP@0.5:0.95 to 95.3%, 88.2%, 92.9% and 54.9%, respectively, showing excellent feature expression and background suppression ability; while the MAB module achieved a small increase in recall rate from 71.5% to 72.8%, indicating that it had a positive effect in strengthening the allocation of attention to the key areas.
The multi-module combination experiments further validated the synergistic effects among the different modules. Among them, the combination of ADPA and MAB performed particularly well in terms of recall and mAP@0.5, achieving 90.5% and 93.2%, respectively. The combination of ESPPF and MAB showed the best performance in precision, reaching 95.9%, indicating that this pairing was more advantageous in improving detection accuracy. The combination of ADPA and ESPPF also outperformed the baseline model across all metrics, especially in mAP@0.5, where it achieved 90.7%. Ultimately, the Cage-YOLO model, which integrated all modules, achieved the best overall performance in recall, mAP@0.5, and mAP@0.5∶0.95, with scores of 93.3%, 95.2%, and 54.9%, respectively. Although its precision was 95.5%, slightly lower than that of the ESPPF and MAB combination, it demonstrated a more balanced performance overall, showcasing the strongest comprehensive detection capability.
In addition to the overall ablation analysis, comparative experiments were further conducted on circular and rectangular cages to evaluate the effects of the proposed modules on targets with different shapes and densities, as shown in Table 3. The experimental results indicated that each module contributes differently depending on the spatial characteristics of the targets. For circular aquaculture net cages, which were smaller and more densely distributed, the introduction of the ADPA module brought a notable improvement in detection accuracy, with mAP@0.5 increasing from 76.4% to 83.1%, demonstrating the model's strong ability to enhance feature perception in high-density small-object regions. The ESPPF module further improved multi-scale feature aggregation, achieving mAP@0.5 values of 92.2% and 96.3% for circular and rectangular aquaculture net cages, respectively, indicating its effectiveness in extracting key spatial information and suppressing background interference. The MAB module provided moderate gains, particularly improving recall for both cage types, showing its positive contribution to enhancing contextual awareness.
Table 3 Results of the ablation studies on different net-cages shapes in the detection of aquaculture net cages |
| Baseline | ADPA | ESPPF | MAB | circle mAP@0.5/% | rectangular mAP@0.5/% | circle mAP@0.5:0.95/% | rectangular mAP@0.5:0.95/% |
|---|---|---|---|---|---|---|---|
| √ | — | — | — | 76.4 | 95.4 | 40.8 | 53.2 |
| √ | √ | — | — | 83.1 | 96.2 | 45.1 | 54.0 |
| √ | — | √ | — | 92.2 | 96.3 | 55.0 | 52.6 |
| √ | — | — | √ | 77.2 | 95.4 | 40.6 | 52.2 |
| √ | √ | — | √ | 90.7 | 95.3 | 51.5 | 53.6 |
| √ | — | √ | √ | 90.8 | 96.4 | 54.8 | 52.1 |
| √ | √ | √ | — | 90.6 | 93.7 | 53.4 | 50.2 |
| √ | √ | √ | √ | 93.1 | 95.5 | 55.0 | 53.4 |
|
In the combined module experiments, synergistic effects among ADPA, ESPPF, and MAB became evident. The combination of ADPA and MAB performed well for dense circular aquaculture net cages, improving mAP@0.5 to 95.3%, while the ESPPF and MAB combination maintains high accuracy for larger rectangular aquaculture net cages, achieving 96.4%. When all three modules were integrated, the model achieved the best overall performance, with mAP@0.5 reaching 93.1% and 95.5% for circular and rectangular aquaculture net cages, respectively. These findings highlight that the proposed modules achieved a balanced improvement, strengthening small-object detection while preserving high accuracy for larger, sparsely distributed targets.
Four attention mechanisms—CA, ECA, CBAM, and the proposed MAB—were evaluated by embedding each into the common YOLOv5+ESPPF+ADPA backbone, and P, R, mAP@0.5, and mAP@0.5:0.95 were reported. The results are summarized in Table 4.
Table 4 Comparison of different attention mechanisms in the ablation study of aquaculture net cages |
| YOLOv5+ESPPF+ADPA | CA | ECA | CBAM | MAB | P/% | R/% | mAP@0.5/% | mAP@0.5:0.95/% |
|---|---|---|---|---|---|---|---|---|
| √ | √ | — | — | — | 96.1 | 88.0 | 91.5 | 53.0 |
| √ | — | √ | — | — | 96.4 | 88.6 | 92.0 | 53.9 |
| √ | — | — | √ | — | 95.5 | 89.6 | 92.4 | 54.0 |
| √ | — | — | — | √ | 95.5 | 93.3 | 95.2 | 54.9 |
|
CA attained a precision of 96.1%, but its recall remains at 88.0%, leading to an mAP@0.5:0.95 of 53.0%. ECA further pushes the precision to 96.4%, the highest among all contenders, yet recall only slightly increases to 88.6%, and the resulting mAP@0.5:0.95 reached 53.9%, indicating that the model still fails to retrieve a non-negligible portion of hard samples. CBAM exhibited a more favorable trade-off, achieving 95.5% precision and 89.6% recall, which raised mAP@0.5:0.95 to 54.0%. In contrast, MAB secured the highest recall at 93.3%, which was a 3.7 percentage points absolute gain over CBAM, the second-best method in terms of recall. Its precision reached 95.5%, slightly below that of CA and ECA, but the improved balance between precision and recall translated into the best overall detection quality: mAP@0.5 reached 95.2% and mAP@0.5:0.95 reached 54.9%, both the highest among all tested mechanisms. These results suggested that the hybrid design of MAB—integrating complementary spatial and channel cues inspired by CA and ECA-enhances the model's sensitivity to difficult or less salient targets without substantially sacrificing precision. Taken together, while MAB did not dominate every isolated metric, its markedly higher recall and the resulting gained in the more comprehensive mAP@0.5:0.95 metrics indicate that it offerred a more robust overall improvement in detection performance.
In summary, ADPA, ESPPF, and MAB each played a critical role in small and dense objects detection. Their combined usage significantly improved detection P, R, and overall model robustness, fully validating the effectiveness and practical value of each module's design.
2.6 Baseline model analysis
To determine a suitable baseline for the proposed optimization, the designed modules were integrated into a series of recent lightweight detection frameworks, YOLOv8s, YOLOv10s, YOLOv11s, and YOLOv12s, and their performance was evaluated on the Aquaculture Net Cage dataset. The results are summarized in Table 5, the introduction of the optimization module into YOLOv8~YOLOv12 did not yield performance improvements; instead, in most cases the detection accuracy and recall even deteriorated. This observation highlighted that the effectiveness of the optimization was closely tied to the backbone characteristics of the baseline model.
Table 5 Performance comparison of baseline models on the Cage dataset in the detection of aquaculture net cages |
| Method | P/% | R/% | mAP@0.5/% | mAP@0.5:0.95/% |
|---|---|---|---|---|
| Cage-YOLO | 95.5 | 93.3 | 95.2 | 54.9 |
| Cage-YOLOv8s | 87.8 | 78.5 | 82.7 | 46.7 |
| Cage-YOLOv10s | 87.8 | 77.4 | 81.1 | 46.5 |
| Cage-YOLOv11s | 89.5 | 77.9 | 83.9 | 47.0 |
| Cage-YOLOv12s | 87.9 | 72.3 | 78.9 | 43.8 |
To more clearly reveal the differences, the feature maps at the SPPF layer of YOLOv5 and YOLOv11 were compared, as shown in Fig.13. The backbone of YOLOv11 employed the C3K2 module, which significantly enlarged the receptive field. While such an architectural design enhanced the model's ability to capture large-scale objects and global semantic information, it came at the expense of spatial resolution in deeper feature maps. For dense small objects, such as aquaculture net cages, this enlarged receptive field tends to dilute or suppress fine-grained local details. Consequently, in the final stage of the backbone, much of the discriminative information relevant to small targets had already been weakened or lost. Under these circumstances, subsequent optimization modules, such as the ESPPF and ADPA, can not effectively recover or strengthen the missing features. In contrast, YOLOv5 preserved a greater degree of local detail within its high-level features, as evidenced by the clearer responses to cage structures in the SPPF layer. This retention of fine-grained information provided a favorable foundation for the optimization module to further emphasize the relevant features, thereby improving detection performance in complex marine backgrounds.
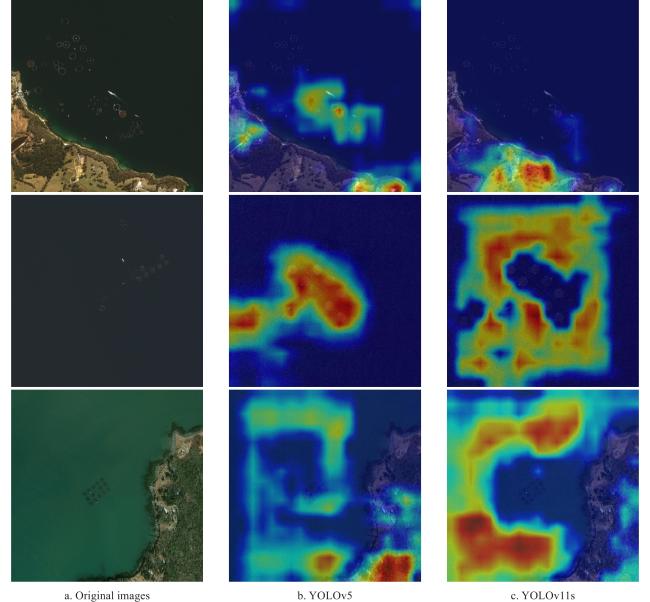
Fig. 13 Comparison of backbone output heatmaps |
Therefore, although YOLOv11 and its successors demonstrated strong performance on general detection benchmarks due to their larger receptive fields and enhanced global representation capacity, they were less suited for tasks dominated by dense small objects. In this context, YOLOv5 proved to be a more appropriate baseline model, as it maintained the essential feature representations of marine cages and allowed the proposed optimization module to fully exploit its potential.
3 Discussion
The Cage-YOLO model proposed in this study demonstrates significant advantages in the detection of dense small objects in aquaculture net cages in complex remote sensing contexts. First, the ADPA can effectively extract key features reflecting the high-density distribution of small objects; second, the enhancement module based on spatial pyramid pooling strengthens the ability to extract global contextual information while suppressing the interference of background noise; and lastly, the introduction of the MAB further strengthens the model's ability of focusing on dense small objects. Relative to the base model YOLOv5, Cage-YOLO exhibited substantial performance gains, demonstrating increases of 5.6 percentage points in precision, 21.8 percentage points in recall, 17.4 percentage points in mAP@0.5, and 13.4 percentage points in mAP@0.5:0.95. While achieving the performance improvement, the model size was kept at 16.9 MB, which has good deployment potential. The effectiveness of the proposed optimization method was highly dependent on the backbone characteristics of the baseline model. In the newer YOLO detection frameworks, architectural modifications significantly enlarge the receptive field, which enhances the modeling of large-scale objects and global semantic information but simultaneously weakens the fine-grained feature representations of small targets, making it difficult for subsequent optimization modules to compensate for the missing information. In contrast, YOLOv5 preserved a greater amount of local detail in its high-level features, providing a solid foundation for the optimization modules to operate effectively.
Despite the good performance of the model, there were still some influencing factors that need to be further investigated. First, the resolution and quality of the input remote sensing image directly determined the model's ability to recognize small objects. Image noise or low resolution may mask key details and reduce the detection effect. Second, the density and spatial distribution of the aquaculture net cages posed a challenge to the detection model, and the traditional model was prone to miss detection or misdetection when facing small object spacing and high overlap, although ADPA can effectively alleviate this problem, it still has certain limitations in extreme high-density scenarios. Third, the diversity of training data directly affected the generalization ability of the model, and there were significant differences in the appearance of aquaculture net cages under different sea areas, seasons, and lighting conditions, which required the model to have strong robustness. In addition, the balance between model complexity and computational efficiency was also a key consideration in the design, especially in resource-constrained deployment environments.
Future research may extend Cage-YOLO along several promising directions to enhance its performance, adaptability, and application potential in aquaculture net cage detection under complex marine environments.
1) Future improvements could focus on expanding data diversity and integrating multimodal information to enhance model robustness and generalization. Datasets could include images from diverse regions, seasons, and observation platforms to capture variations in illumination, water transparency, and tidal conditions. Additionally, incorporating multispectral and synthetic aperture radar (SAR) data can provide complementary spatial and spectral cues, thereby improving detection performance under cloud cover or glare. These heterogeneous data sources can be fused using transformer-based cross-modal modules or attention mechanisms, which dynamically weight features from different modalities. Furthermore, synthetic data generated via GAN-based augmentation or domain randomization can simulate adverse conditions such as fog or sun glint, strengthening the model's adaptability to diverse marine environments.
2) Environmental interference remains a key limitation for marine-scene applications. To mitigate this, auxiliary environmental variables, such as wind speed, precipitation, cloud fraction, and tidal level, can be explicitly integrated into the model as additional input channels. The introduction of a spatiotemporal fusion module is expected to enable dynamic feature adjustment in response to these changing conditions, thereby strengthening detection stability in complex marine environments.
3) To achieve real-time detection on edge devices, UAVs, and onboard monitoring systems, future work could focus on optimizing model architecture to reduce computational complexity while maintaining accuracy. This can be achieved through network pruning to remove redundant layers and channels, quantization to lower the precision of model parameters, and knowledge distillation to transfer discriminative representations from a large teacher network to a compact student model. Additionally, lightweight backbone networks and efficient feature extraction blocks can be incorporated to balance performance and resource constraints, enabling faster inference and lower power consumption in practical deployment scenarios.
4) Building an intelligent aquaculture management system based on Cage-YOLO could integrate automated detection, monitoring, and early-warning capabilities. Such a system may support marine resource management and be validated through pilot applications in collaboration with fisheries authorities.
4 Conclusions
In this study, Cage-YOLO, a high-precision detection model specifically designed for marine net-cage aquaculture, was introduced. The model introduces several key innovations: 1) the ADPA module, which adaptively focuses on dense regions of aquaculture cages to enhance feature representation; 2) an optimized SPPF structure that strengthens key spatial features and improves information aggregation; and 3) the MAB module to enhance the model's overall perceptual capability across complex marine backgrounds.
Experimental results demonstrated that Cage-YOLO achieves significant improvements over YOLOv5, with increases of 5.6, 21.8, 17.4, and 13.4 percentage points in P, R, mAP@0.5, and mAP@0.5:0.95, respectively. Compared with other classical detection models, Cage-YOLO also achieves competitive results in both accuracy and model efficiency.
The results indicate that Cage-YOLO provides a reliable technical foundation for automated marine net-cage detection. The improved detection accuracy and robustness enable more precise identification and localization of net cages in high-resolution remote sensing imagery, supporting consistent monitoring of aquaculture scale and spatial configuration. Furthermore, the model's ability to capture temporal variations in cage distribution demonstrates its potential to aid in early detection of deformation, displacement, or loss, thereby facilitating timely maintenance and risk mitigation.
Future work will extend Cage-YOLO to multi-temporal and multimodal datasets to build a more adaptive and intelligent monitoring framework for large-scale aquaculture under dynamic marine environments.


