


1 Introduction
Effective foxtail millet breeding will increase food production and ensure food security. Thus, the estimation of foxtail millet production has become a research issue since it plays an important role in its breeding. Foxtail millet production is mainly determined by three factors, namely the number of ear, the number of grains per ear, and the quality of grains[1]. The contributions of these three factors to production are: grain number per ear>ear number>grain quality[2]. Therefore, accurate estimation of ear is of key importance to foxtail millet production. However, the traditional manual estimation approach is subjective and inefficient. The deep neural networks can be utilized to detect foxtail millet ear efficiently and accurately, and the detected boxes of foxtail millet ear can be further employed to facilitate the estimation of foxtail millet production.
For wheat ear detection[3,4],in recent year, benefiting from the rapid development of deep learning and the great improvement in the performance of hardware devices, neural networks have received a lot of attention in the fields of target detection[5], semantic segmentation, and instance segmentation[6]. Lu[7] proposed a wheat ear recognition approach based on back propagation (BP) neural network. In 2013, Shi[8] first extracted the color, shape and texture parameters of wheat grains, and then utilized BP neural network to classify wheat grains. Further, mean error square (MES) and mean impact val (MIV)-BP were employed to optimize the BP neural network. Their experimental results showed that the recognition rate had increased by 11.45% when compared with models without optimization. Zhang et al.[9] designed a winter wheat ear detection and counting system based on a convolutional neural network. Gao[10] utilized YOLOv3 and Mask Region-Convolutional Neural Networks (R-CNN) to directly detect wheat ear in the field and achieve mAP 87.12%. Alkhudaydi et al.[11] developed a fully convolutional model to estimate wheat ear from high-resolution RGB images. Xie et al.[12] developed a Feature Cascade SVM (FCS R-CNN) wheat ear detection method and obtain mAP 81.22%.
Although deep learning based detection methods have been applied to the wheat ear detection filed and achieved good result, there are few approaches developed for foxtail millet ear detection. Thus, in this research, the foxtail millet ear detection work was explored and an effective method was proposed.
Considering the promising detection capacity, YOLOv4[5] was employed to perform foxtail millet ear detection and further facilitate the foxtail millet ear counting. Furthermore, in order to make the YOLOv4 model applicable for the specific foxtail millet ear detection task effectively, the size of the anchor boxes in the model via K-means method based on the foxtail millet ear detection dataset was adjusted. Through the adjustment, the performance of the foxtail millet ear detection has been enhanced. Millet ear detection dataset was collected from the farmland, which contains about 784 images and with about 10,000 foxtail millet ear samples in total. Among them, 588 images were utilized for training and the rest for testing.
2 Data set
The data was collected from the foxtail millet experimental field,the varieties including Male sterile line GBS, Datong 27 and Dragon Claw, at Shanxi Agricultural University in Taigu county, Jinzhong city, Shanxi province.
2.1 Data collection
The duration of data collection was one month, starting in August 10th and ending in September 10th, 2020. To make the samples diverse and rich, the data were collected every other day at 10 a.m., and 3 kinds of foxtail millet samples including Male sterile line GBS, Datong27 and Dragon Claw were collected. Therefore, the collected data contains samples under different light conditions and different weather.
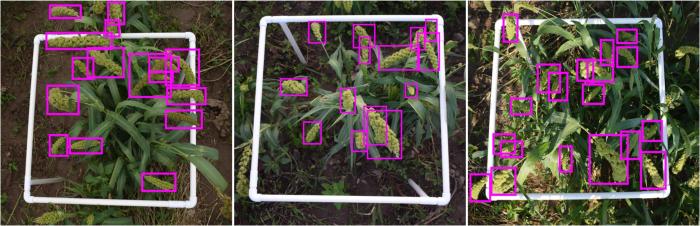
A white box on foxtail millet ear was added in a specific area, and it was taken as one original data sample. Considering the weight, deformation and convenience, the white box was made of PVC pipes, the size was 0.5 m (width) × 0.6 m (length) ×0.5 m (height). Among them, the white box was 0.5 m from the ground. The camera was Canon EOS 70D with 35 mm focal length since it could obtain high-resolution sample images, and the distance between the camera lens and the white frame was 1.5-2 m.
The storage format of the collected data was *.jpg and the resolutions were 4864×3648 px. Fig.1 shows several foxtail millet ear samples.
Fig. 1
2.2 Data cleaning
In order to achieve a promising training model, the images with blurry foxtail millet ear and excessive weeds were eliminated, to reduce the impact of the background and degradation of the images on the accuracy of network detection.
Effective models usually depend on accurate data annotation. To achieve well data annotation, labelImg[13] was employed to label the dataset. Specifically, each foxtail millet ear in the corresponding white box in one image was annotated by using a rectangular box which represented by the coordinates of its four vertices. After all foxtail millet ears in the corresponding white box in one image were labeled, a corresponding XML file was generated.
In the XML file, all information was stored in the annotation tag, which contained the size of the image, the name of the label frame, and the location of the target frame. Subsequently, the XML file generated by the corresponding image was converted into a text file as a network input.
Finally, the foxtail millet ear detection dataset contained 784 images and 10,000 foxtail millet ear samples in total. Among them, 80% were adopted as the training set, and the rest were adopted as the test set. Specifically, 588 training images and 196 test images were contained in the dataset.
3 Methods and experiment
3.1 The YOLO models
YOLO[14] is an excellent model for object detection, which can well balance the detection speed and the accuracy. YOLO belongs to the one-stage detection approach, which can detect objects directly without generating candidate proposals.
YOLO performs foxtail millet ear detection through the following steps. First, the features are extracted from the input foxtail millet ear's image via the feature extraction network to obtain a N×N px feature map. Then, the input image is divided into N×N grid cells. If the center coordinate of an object in ground-truth falls into one grid cell, this grid cell can be employed to predict the object. The grid cell will predict M bounding boxes with different sizes, and the bounding box with the largest Intersection over Union (IOU) was utilized to predict the object. Specifically, each bounding box contains 5 prediction values: tx, ty, tw, th, and confidence. tx, ty, tw, th denote the center coordinates and width and height of the model prediction; confidence denotes the trust level and prediction accuracy of the predicted box. Based on
Where,
3.2 Structure of YOLOv4 model
The network structure of the YOLOv4 model is shown in Fig.2 The backbone of YOLOv4 is CSPDarknet-53, which integrates 5 CSP modules into the Darknet-53 model. Specifically, CSPDarknet53 includes 29 convolutional layers with kernel size of 3×3, and a receptive field of 725×725. In total, it has 27.6 M parameters. Benefiting from the advantages of CSPNet in reducing computational costs, maintaining high accuracy, and reducing memory consumption while light weighting the model, YOLOv4 adds CSP to each large residual block of Darknet-53. Meanwhile, the feature mapping of the basic layer is separated into two parts and then merged through the cross-stage hierarchical structure to guarantee accuracy while reducing the amount of calculation[15,16].
Fig. 2
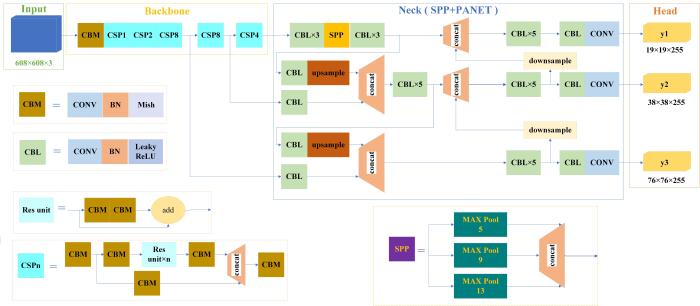
The current object Fig.2 detector is mainly composed of 4 modules, including Input, Backbone, Neck, and Head, respectively. The Input of YOLOv4 employs Mosaic data augmentation.
The neck of YOLOv4 is the spatial pyramid pooling and the path aggregation network (PANet). Specifically, the spatial pyramid pooling block is added over the CSPDarknet53 backbone. Spatial Pyramid Pooling (SPP) can markedly increase the receptive field and extracts the most important context features, without reducing the operating speed of the network. The maximum pooling sizes of spatial pyramid pooling are 5×5, 9×9, and 13×13. Moreover, the PANet is utilized to aggregate the parameters from different backbone levels[4].
In order to detect foxtail millet ear individuals of different sizes, the idea of anchor box[4] was presented. The anchor gave an initial value of the target width and height, which was often utilized to make a rough judgment on the size of the target individual, to avoid the model to blindly learn the target position and target scale in the training process. Since the foxtail millet ear object is smaller than the general object, the K-means algorithm[17] was employed to adaptively obtain the anchor box based on the foxtail millet ear detection dataset. The regression task operation with high relative offset could predict the target width and height more accurately. Specifically, the YOLOv4 model utilizes the K-means algorithm to generate a total of 9 anchor boxes, the sizes of which are (5, 7), (6, 12), (9, 8), (7, 18), (10, 13), (13, 10), (10, 21), (14, 15) and (17, 25), where the coordinates (X, Y) represent the width and height of the anchor box respectively, and the first 3 anchor point boxes were used to detect smaller foxtail millet ear individual, the middle 3 anchor boxes were employed to detect medium-sized foxtail millet ear individuals, the last 3 anchor boxes were suitable for detecting larger foxtail millet ear individuals.
3.3 The loss function
YOLOv4 utilizes the following loss function to train the model, including 3 items, namely localization loss, confidence loss, and classification loss respectively.
The confidence loss denotes the confidence of the prediction box on the detected object. The confidence loss is formulated as:
Where, S2and B indicate the scale of the feature map and the priority box.
The localization loss indicates the error between the real box and the predicted bounding box, which is only for the target box responsible for detection. The localization loss (Complete Intersection Over Union Loss, CIOU Loss) of YOLOv4 is expressed as:
Where, IOU can be denoted as:
Where, C and D indicate the ground truth and predicted bounding box; IOU denotes the ratio of intersection and union corresponding of these two boxes. IOU is a indicator to measure the accuracy of the predicted box. The larger the IOU, the more accurate the position of the predicted box; where, d( )
The classification loss is represented as:
Where, Lcls is the classification loss, which is utilized to identify whether the object in box is the target object (foxtail millet ear).
Thus, the whole loss of YOLOv4 is:
3.4 Experiments setup
The hardware configurations for the experiments were GTX TITANXP 12G graphics card and the I7 7800 X processor. The software configurations were demonstrated as follows: CUDA10.1, CUDNN7.6.4, python3.6.9. The experiments were processed based on PyTorch.
The parameters for experiments were set up as follows: the learning rate was 0.001, the number of training iterations was 12,000, and the momentum was 0.949.
3.5 Evaluation criteria
To validate the performance of the model, several important evaluation criteria were employed, including Precision, Recall, F1-score, and mean Average Precision (mAP).
Among them, precision evaluates the accuracy of the model prediction; Recall indicates whether the model was completely searching for the target; F1-score is a promising measurement of classification tasks, which is the harmonic mean of Precision and Recall. The maximum and the minimum of F1-score are 1 and 0, respectively. MAP refers to the average detection accuracy of the model. When calculating the mAP, its definition is consistent with that of Pattern Analysis, Statical Modeling and Computational Learning, Visual Object Classes 2007 (PASCAL VOC2007)[18], and the detection is correct when the IOU threshold of the detection box and the manual labeling box exceeds a certain value and the category prediction confidence score exceeds a certain value[19].
The definitions of Precision, Recall, F1-score, and mAP are shown in Equations (
Where, TP, FP, FN indicates the number of True Positive, false positive and false-negative samples.
4 Results and analysis
4.1 Evaluation of three models
To verify the effectiveness of YOLOv4 on foxtail millet ear detection, three models of Faster-RCNN, YOLOv2, and YOLOv3 were utilized to compare with it. Table 1 shows the comparison results of Precision, Recall,F1-score, and mAP. These three models used the same training parameters. During the test, the confidence and IOU thresholds were set as 0.35 and 0.5, respectively. It implies that when the prediction confidence score is greater than 0.35 and the predicted IOU is greater than 0.5, the corresponding sample is considered to be correct.
Table 1 Comparison results of different models with parameters score = 0.35 and IOU = 0.5
| Models | Precision/% | Recall/% | F1-score/% | mAP |
|---|---|---|---|---|
| Faster-RCNN | 85.34 | 75.66 | 80.85 | 76.00 |
| YOLOv2 | 77.00 | 73.00 | 75.00 | 71.52 |
| YOLOv3 | 86.00 | 77.00 | 81.00 | 76.96 |
| YOLOv4 | 87.00 | 79.00 | 83.00 | 78.99 |
Results in Table 1 reveals that YOLOv4 obtained significantly better results than Faster-RCNN, YOLOv2 and YOLOv3 on all four criteria of Precision, Recall, F1-score, and mAP. Specifically, the Precision of YOLOv4 beats Faster-RCNN, YOLOv2 and YOLOv3 by 1.9%, 13% and 1%, the Recall of YOLOv4 surpasses Faster-RCNN, YOLOv2 and YOLOv3 by 4.4%, 8.2% and 2.6%, the F1-score of YOLOv4 better than Faster-RCNN, YOLOv2 and YOLOv3 by 2.6%, 10.6% and 2.4%. Furthermore, YOLOv4 acquires 3.9%, 10.4% and 2.6% better mAP than those of Faster-RCNN, YOLOv2 and YOLOv3.
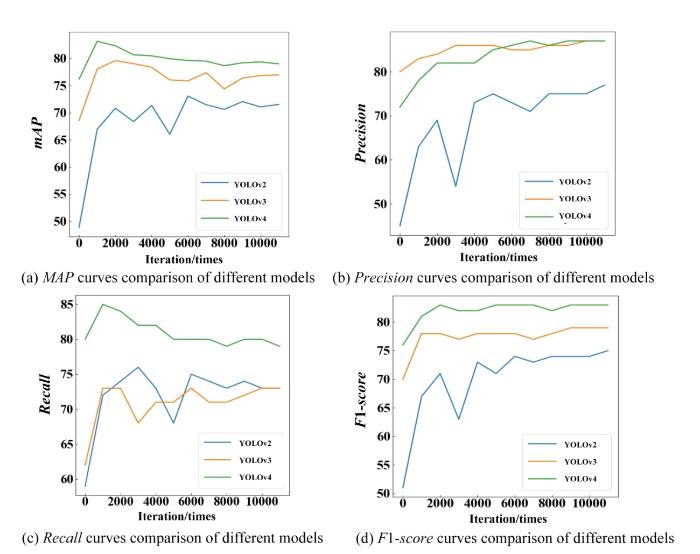
Moreover, Fig.3 shows the comparison results of different models under different iterations. In Fig.3, the curves of mAP, Precision, Recall and F1-score of YOLOv4 are all above those of YOLOv2 and YOLOv3, which indicates that the performance of YOLOv4 is superior to YOLOv2 and YOLOv3 in mAP, Precision, Recall and F1-score. Clearly, the results validate the effectiveness of the YOLOv4 throughout the whole training phase.
Fig. 3
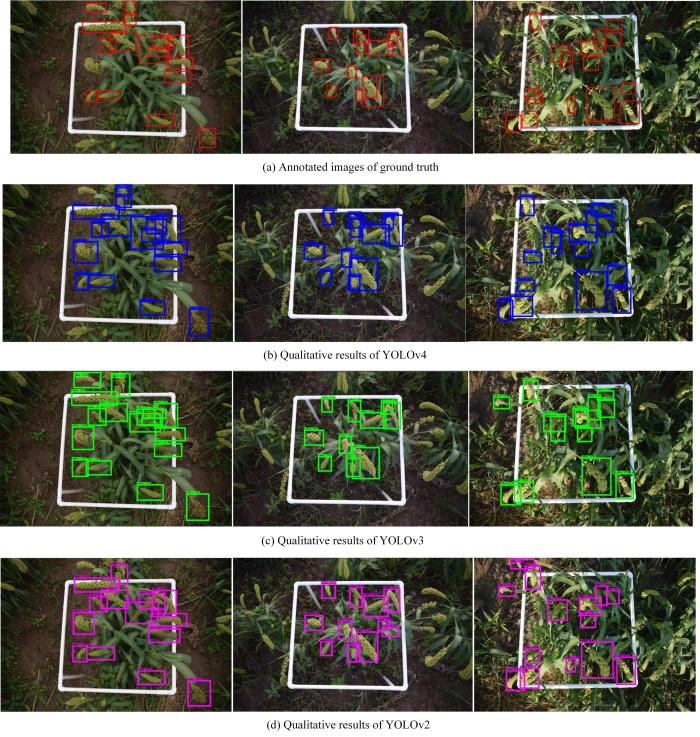
Besides, the qualitative comparison results of different models, including YOLOv2, YOLOv3, and YOLOv4 are shown in Fig.4 Obviously, the YOLOv4 obtains more accurate predicted boxes than YOLOv2 and YOLOv3 in the case of occlusion and other situations.
Fig. 4
There are several reasons that YOLOv4 obtained better results.
(1) YOLOv4 has integrated Mosaic data augmentation. Specifically, 4 training images were mixed by using Mosaic, and thus 4 different contexts were merged. This permits the objects outside of their normal context to be detected, which will enhance the detection performance. Further, activation statistics based on 4 distinct images on each layer can be calculated by using batch normalization. This greatly reduces the requirement for large mini-batch size in the training phase.
(2) The backbone of YOLOv4 leverages CSPDarknet53, Mish activation function, and Dropblock strategies. Specifically, CSPDarknet53 added a Cross Stage Partial structure to each group of blocks, which will significantly improve the performance of the model. Mish activation is smooth, which allows better information to be passed into the deep neural network, and leads to better accuracy and generalization. The dropblock strategy allows the number of dropout units to be gradually increased during the training process, thereby improving the accuracy of training and the robustness to hyperparameter selection.
(3) YOLOv4 employs Complete Intersection Over Union (CIOU) loss and Distance Intersection over Union-Non Maximum Suppression (DIOU-NMS), which will further improve the convergence speed and regression accuracy.
4.2 Evaluation of different IOU thresholds
Different from the common object detection, the foxtail millet ears in the image in this research were small and densely distributed. In order to find the most suitable specific IOU value for the foxtail millet ear detection dataset, the performance of the model with different IOU values were explored. Specifically, the confidence score was fixed as 0.35, and then the IOU was set to 0.2, 0.35, 0.5, and 0.65 on the test set, respectively. The comparison results are shown in Table 2.
Table 2 The impact of IOU values on the performance of different models
| model | IOU | Precision/% | Recall/% | F1/-score% | mAP/% |
|---|---|---|---|---|---|
| YOLOv2 | 0.20 | 85.00 | 81.00 | 83.00 | 84.05 |
| 0.35 | 83.00 | 80.00 | 81.00 | 81.03 | |
| 0.50 | 77.00 | 73.00 | 75.00 | 71.52 | |
| 0.65 | 53.00 | 51.00 | 52.00 | 40.64 | |
| YOLOv3 | 0.20 | 91.00 | 81.00 | 86.00 | 84.05 |
| 0.35 | 90.00 | 81.00 | 85.00 | 82.36 | |
| 0.50 | 86.00 | 77.00 | 81.00 | 76.96 | |
| 0.65 | 65.00 | 59.00 | 62.00 | 48.55 | |
| YOLOv4 | 0.20 | 92.00 | 84.00 | 87.00 | 85.01 |
| 0.35 | 91.00 | 83.00 | 87.00 | 83.69 | |
| 0.50 | 87.00 | 79.00 | 83.00 | 78.99 | |
| 0.65 | 70.00 | 64.00 | 67.00 | 56.38 |
With the increase of the IOU threshold, the evaluation criteria changed significantly. That is, all the evaluation criteria of the three models showed a downward trend as the IOU increased. Although the evaluation criteria were higher when the IOU was 0.2 and 0.3, the IOU of the predicted box and the ground-truth box was too small, thus the prediction of foxtail millet ear was not convincing. On the other hand, when the IOU was 0.65, the performance of the model dropped sharply by 20%-30%. The detection performance is too poor, which means that many ears can not be detected. Therefore, in balanced, the IOU was choosen as 0.5, which has a good IOU and detection performance.
4.3 Evaluation of the foxtail millet ear detection with/without anchor boxes adjustment
Models were compared in order to evaluated the foxtail millet ear detection with/without anchor box adjustment, including YOLOv3 and YOLOv3_adj, YOLOv4 and YOLOv4_adj respectively. Among them, YOLOv3_adj and YOLOv4_adj indicated the corresponding models with adaptively adjusted anchor boxes based on K-means algorithm. Specifically, the anchor boxes for YOLOv3 were (3, 5), (4, 8), (6, 5), (5, 12), (7, 9), (9, 7), (7, 14), (10, 10), (11, 17) and for YOLOv4 were (5, 7), (6, 12), (9, 8), (7, 18), (10, 13), (13, 10), (10, 21), (14, 15) and (17, 25), respectively. The comparison results are shown in Table 3.
Table 3 Comparison results of models with/without anchor boxes adjustment
| Model | Precision/% | Recall/% | F1-score/% | mAP |
|---|---|---|---|---|
| YOLOv3 | 86.00 | 77.00 | 81.00 | 76.90 |
| YOLOv3_adj | 87.00 | 78.00 | 81.00 | 77.16 |
| YOLOv4 | 87.00 | 79.00 | 83.00 | 78.99 |
| YOLOv4_adj | 87.00 | 80.00 | 83.00 | 80.87 |
Table 3 shows that YOLOv3_adj and YOLOv4_adj are superior to those of YOLOv3 and YOLOv4 respectively, which verify the effectiveness of the adaptively anchor boxes. The reasons are that the adjusted anchor boxes have high relative offset on foxtail millet ear, which allows the model to predict the width and height of object more accurately.
4.4 Evaluation of the changing reasons of model criteria
Equations (
Table 4 TP and FP values predicted by the experimental models for the ear target
| Model | TP | FP | TP increment | FP increment | mAP increment |
|---|---|---|---|---|---|
YOLOv2 YOLOv3 | 2052 2157 | 623 352 | 0 105 | 0 -271 | 0 5.44 |
| YOLOv4 | 2220 | 329 | 168 | -294 | 7.47 |
The test results indicated that the higher the TP value, the better the model performs. As can be seen from Table 4, the YOLOv4 model is better than other models, and YOLOv3 is superior to YOLOv2. Specifically, the TP value of the YOLOv4 model is 63 higher than that of YOLOv3 (increased by 2.92%), the FP value is 23 smaller than that of YOLOv3 (decreased by 6.53%), and mAP increased by 2.63%. Furthermore, the TP value of the YOLOv4 model is 168 higher than that of YOLOv2 (increased by 8.19%), the FP value is 294 smaller than that of YOLOv2 (decreased by 47.19%), and mAP increased by 10.44%. Moreover, the TP value of the YOLOv3 model is 105 more than that of YOLOv2 (increased by 5.12%), the FP value is 271 less than that of YOLOv2 (decreased by 43.50%), and mAP increased by 7.60%. From the above description, it could be concluded that the change ratio of mAP was similar to those of TP. Better detection results require a higher number of TP.
4.5 Evaluation of the foxtail millet ear detection with different input original image size
As the collected original foxtail millet ear image with size of 4864×3648 px and the input dimension for YOLOv4 model was 608×608 px, this was a large resize ratio and required the foxtail millet ear to be very small. Consequently, the foxtail millet ear detection with small input original image size by cutting the original image through removing the unnecessary parts were studied. Specifically, the size of cutting foxtail millet ear images are 2000×1500 px. The comparison results are shown in Table 5.
Table 5 The impact of different original image size on the foxtail millet ear detection
| Original image size/px | YOLOv4 input size/px | Precision/% | Recall/% | F1-score/% | mAP |
|---|---|---|---|---|---|
| 4864×3648 | 608×608 | 87 | 79.00 | 83.00 | 78.99 |
| 2000×1500 | 608×608 | 92 | 84.00 | 88.00 | 83.50 |
Table 5 shows that the cutting foxtail millet ear image obtained better results than that of foxtail millet ear image without cutting preprocessing, it is because that the images with cutting preprocessing by removing the unnecessary parts could reduce the resize ration before the image inputting into the corresponding detection model. Thus, the enhanced the foxtail millet ear detection performance could be achieved.
5 Conclusions
In this research, an adaptive anchor adjustment foxtail millet ear detection approach based on YOLOv4 was proposed, which has obtained promising detection results. Firstly, a novel relatively large foxtail millet ear detection dataset collected from the farmland was established, which contained 784 images and 10,000 ear samples in total. Then, the detection model YOLOv4 with proposed adaptive anchor adjustment was applied to perform the task of foxtail millet ear detection. Extensive experiments have been performed to validate the availability of the established dataset and the effectiveness of YOLOv4. Experimental results revealed that YOLOv4 obtained best detection performance for foxtail millet ear detection than other models (YOLOv2, YOLOv3) in terms of all evaluation criteria.
The detection of other millet ear categories elsewhere in the world were not been explored. Furthermore, the scale of foxtail millet ear detection dataset in this research was medium-sized, which should be increased in the future. And more effective approaches for detecting foxtail millet ear will be explored.


