| [1] |
YANG J, ZHANG S J, ZHANG J H, et al. Incorporating crop rotation into the winter wheat-summer maize system to enhance soil multifunctionality and sustainable grain production in the North China Plain[J]. Field crops research, 2025, 325: ID 109834.
|
| [2] |
陈仲新, 郝鹏宇, 刘佳, 等. 农业遥感卫星发展现状及我国监测需求分析[J]. 智慧农业, 2019, 1(1): 32-42.
|
|
CHEN Z X, HAO P Y, LIU J, et al. Technical demands for agricultural remote sensing satellites in China[J]. Smart agriculture, 2019, 1(1): 32-42.
|
| [3] |
ZHANG M, WU B F, ZENG H W, et al. GCI30: A global dataset of 30 m cropping intensity using multisource remote sensing imagery[J]. Earth system science data, 2021, 13(10): 4799-4817.
|
| [4] |
ESTEL S, KUEMMERLE T, ALCÁNTARA C, et al. Mapping farmland abandonment and recultivation across Europe using MODIS NDVI time series[J]. Remote sensing of environment, 2015, 163: 312-325.
|
| [5] |
GUMMA M K, THENKABAIL P S, PANJALA P, et al. Multiple agricultural cropland products of South Asia developed using Landsat-8 30 m and MODIS 250 m data using machine learning on the Google Earth Engine (GEE) cloud and spectral matching techniques (SMTs) in support of food and water security[J]. GIScience & remote sensing, 2022, 59(1): 1048-1077.
|
| [6] |
CHIANG S H, TON M B. Mapping rice phenology using MODIS products in an giang province, Mekong River Delta, Vietnam[J]. Remote sensing, 2025, 17(9): ID 1583.
|
| [7] |
QIU B W, LU D F, TANG Z H, et al. Mapping cropping intensity trends in China during 1982–2013[J]. Applied geography, 2017, 79: 212-222.
|
| [8] |
LIU L, XIAO X M, QIN Y W, et al. Mapping cropping intensity in China using time series Landsat and Sentinel-2 images and Google Earth Engine[J]. Remote sensing of environment, 2020, 239: ID 111624.
|
| [9] |
李卓, 刘淑亮, 孙然好, 等. 黄淮海地区耕地复种指数的时空格局演变[J]. 生态学报, 2018, 38(12): 4454-4460.
|
|
LI Z, LIU S L, SUN R H, et al. Identifying the temporal-spatial pattern evolution of the multiple cropping index in the Huang-Huai-Hai region[J]. Acta ecologica sinica, 2018, 38(12): 4454-4460.
|
| [10] |
MENG L L, LI Y F, SHEN R Q, et al. Large-scale and high-resolution paddy rice intensity mapping using downscaling and phenology-based algorithms on Google Earth Engine[J]. International journal of applied earth observation and geoinformation, 2024, 128: ID 103725.
|
| [11] |
HE Y L, DONG J W, LIAO X Y, et al. Examining rice distribution and cropping intensity in a mixed single- and double-cropping region in South China using all available Sentinel 1/2 images[J]. International journal of applied earth observation and geoinformation, 2021, 101: ID 102351.
|
| [12] |
TAO J B, ZHANG X Y, LIU Y Q, et al. Estimating agricultural cropping intensity using a new temporal mixture analysis method from time series MODIS[J]. Remote sensing, 2023, 15(19): ID 4712.
|
| [13] |
李宇, 邱炳文, 何玉花, 等. 基于MODIS数据的2001—2018年中国耕地复种指数反演研究[J]. 地理科学进展, 2020, 39(11): 1874-1883.
|
|
LI Y, QIU B W, HE Y H, et al. Cropping intensity based on MODIS data in China during 2001-2018[J]. Progress in geography, 2020, 39(11): 1874-1883.
|
| [14] |
KONTGIS C, SCHNEIDER A, OZDOGAN M. Mapping rice paddy extent and intensification in the Vietnamese Mekong River Delta with dense time stacks of Landsat data[J]. Remote sensing of environment, 2015, 169: 255-269.
|
| [15] |
WANG J, XIAO X M, LIU L, et al. Mapping sugarcane plantation dynamics in Guangxi, China, by time series Sentinel-1, Sentinel-2 and Landsat images[J]. Remote sensing of environment, 2020, 247: ID 111951.
|
| [16] |
许利洋. 2000—2018年江汉平原耕地复种时空格局变化及其驱动机制研究[D]. 武汉: 华中师范大学, 2020.
|
|
XU L Y. Study on the spatial-temporal patterns and driving mechanisms of multiple cropping in Jianghan plain from 2000 to 2018[D]. Wuhan: Central China Normal University, 2020.
|
| [17] |
PAN L, XIA H M, YANG J, et al. Mapping cropping intensity in Huaihe basin using phenology algorithm, all Sentinel-2 and Landsat images in Google Earth Engine[J]. International journal of applied earth observation and geoinformation, 2021, 102: ID 102376.
|
| [18] |
TAO J B, JIANG Q Y, ZHANG X Y, et al. From frequency to intensity-A new index for annual large-scale cropping intensity mapping[J]. Computers and electronics in agriculture, 2023, 215: ID 108428.
|
| [19] |
QIU B W, HU X, CHEN C C, et al. Maps of cropping patterns in China during 2015–2021[J]. Scientific data, 2022, 9: ID 479.
|
| [20] |
葛中曦, 黄静, 赖佩玉, 等. 耕地复种指数遥感监测研究进展[J]. 地球信息科学学报, 2021, 23(7): 1169-1184.
|
|
GE Z X, HUANG J, LAI P Y, et al. Research progress on remote sensing monitoring of cultivated land cropping intensity[J]. Journal of geo-information science, 2021, 23(7): 1169-1184.
|
| [21] |
鄂海林, 周德成, 李坤. 基于Sentinel 1/2和GEE的水稻种植面积提取方法: 以杭嘉湖平原为例[J]. 智慧农业(中英文), 2025, 7(2): 81-94.
|
|
E H L, ZHOU D C, LI K. Extracting method of the cultivation aera of rice based on sentinel-1/2 and google earth engine(GEE): A case study of the hangjiahu plain[J]. Smart agriculture, 2025, 7(2): 81-94.
|
| [22] |
ZHANG X, LIU L Y, ZHAO T T, et al. GLC_FCS10: A global 10 m land-cover dataset with a fine classification system from Sentinel-1 and Sentinel-2 time-series data in Google Earth Engine[J]. Earth system science data, 2025, 17(8): 4039-4062.
|
| [23] |
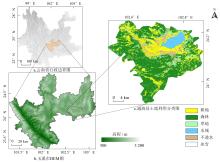
通海县人民政府. 走进通海[EB/OL]. 通海县人民政府门户网站, 综合发布于2024—2025年. [2025-11-08].
|
|
Tonghai County People's Government. Explore Tonghai [EB/OL]. Tonghai County People's Government Portal, publishedbetween 2024 and 2025 [2025-11-08].
|
| [24] |
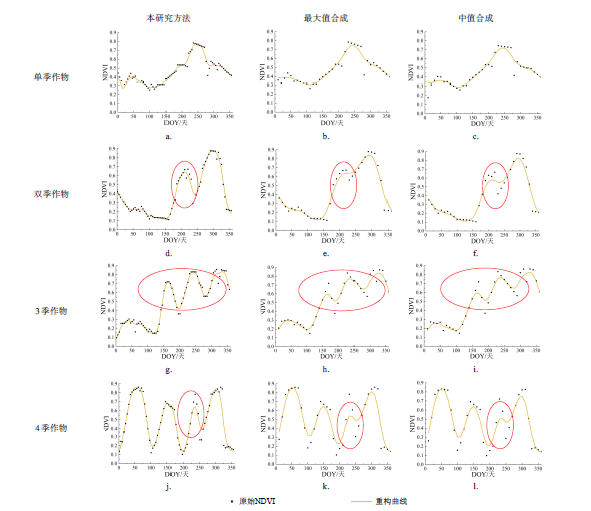
LIANG J Y, REN C, LI Y, et al. Using enhanced gap-filling and Whittaker smoothing to reconstruct high spatiotemporal resolution NDVI time series based on Landsat 8, Sentinel-2, and MODIS imagery[J]. ISPRS international journal of geo-information, 2023, 12(6): ID 214.
|
| [25] |
QIU B W, FENG M, TANG Z H. A simple smoother based on continuous wavelet transform: Comparative evaluation based on the fidelity, smoothness and efficiency in phenological estimation[J]. International journal of applied earth observation and geoinformation, 2016, 47: 91-101.
|
| [26] |
QIU B W, LIU B L, TANG Z H, et al. National-scale 10 m maps of cropland use intensity in China during 2018-2023[J]. Scientific data, 2024, 11: ID 691.
|
| [27] |
ZHANG P, DU P J, GUO S C, et al. A novel index for robust and large-scale mapping of plastic greenhouse from Sentinel-2 images[J]. Remote sensing of environment, 2022, 276: ID 113042.
|
| [28] |
HAN J C, ZHANG Z, LUO Y C, et al. Annual paddy rice planting area and cropping intensity datasets and their dynamics in the Asian monsoon region from 2000 to 2020[J]. Agricultural systems, 2022, 200: ID 103437.
|
| [29] |
郭佳炜, 叶回春, 聂超甲, 等. 基于Sentinel-2的海南耕地复种指数监测及时空变化分析[J]. 遥感技术与应用, 2022, 37(5): 1128-1139.
|
|
GUOJIA W, YE H C, NIE C J, et al. Monitoring and spatial-temporal variation of multiple cropping index based on Sentinel-2 in Hainan[J]. Remote sensing technology and application, 2022, 37(5): 1128-1139.
|
| [30] |
申健, 常庆瑞, 李粉玲, 等. 2000—2013年关中地区耕地复种指数遥感动态监测[J]. 农业机械学报, 2016, 47(8): 280-287.
|
|
SHEN J, CHANG Q R, LI F L, et al. Dynamic monitoring of cropping index in Guanzhong area using remote sensing in 2000—2013[J]. Transactions of the Chinese society for agricultural machinery, 2016, 47(8): 280-287.
|
| [31] |
QIU B W, HU X, YANG P, et al. A robust approach for large-scale cropping intensity mapping in smallholder farms from vegetation, brownness indices and SAR time series[J]. ISPRS journal of photogrammetry and remote sensing, 2023, 203: 328-344.
|
 ), 何勇林, 马俊伟