Smart Agriculture ›› 2025, Vol. 7 ›› Issue (3): 143-159.doi: 10.12133/j.smartag.SA202502015
• Information Processing and Decision Making • Previous Articles Next Articles
WANG Yuxi1, HUANG Lyuwen1,2( ), DUAN Xiaolin1
Received:2025-02-20
Online:2025-05-30
Foundation items:National Key R&D Program of China(2020YFD1100601)
About author:WANG Yuxi. E-mail: 2023056150@nwafu.edu.cn
corresponding author:
CLC Number:
WANG Yuxi, HUANG Lyuwen, DUAN Xiaolin. Dynamic Prediction Model of Crop Canopy Temperature Based on VMD-LSTM[J]. Smart Agriculture, 2025, 7(3): 143-159.
Add to citation manager EndNote|Ris|BibTeX
URL: https://www.smartag.net.cn/EN/10.12133/j.smartag.SA202502015
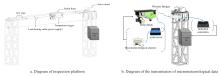
Fig. 1
Composition diagram of agricultural inspection robot system

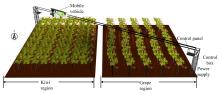
Fig. 2
Diagram of plantation area plotted by Unity software
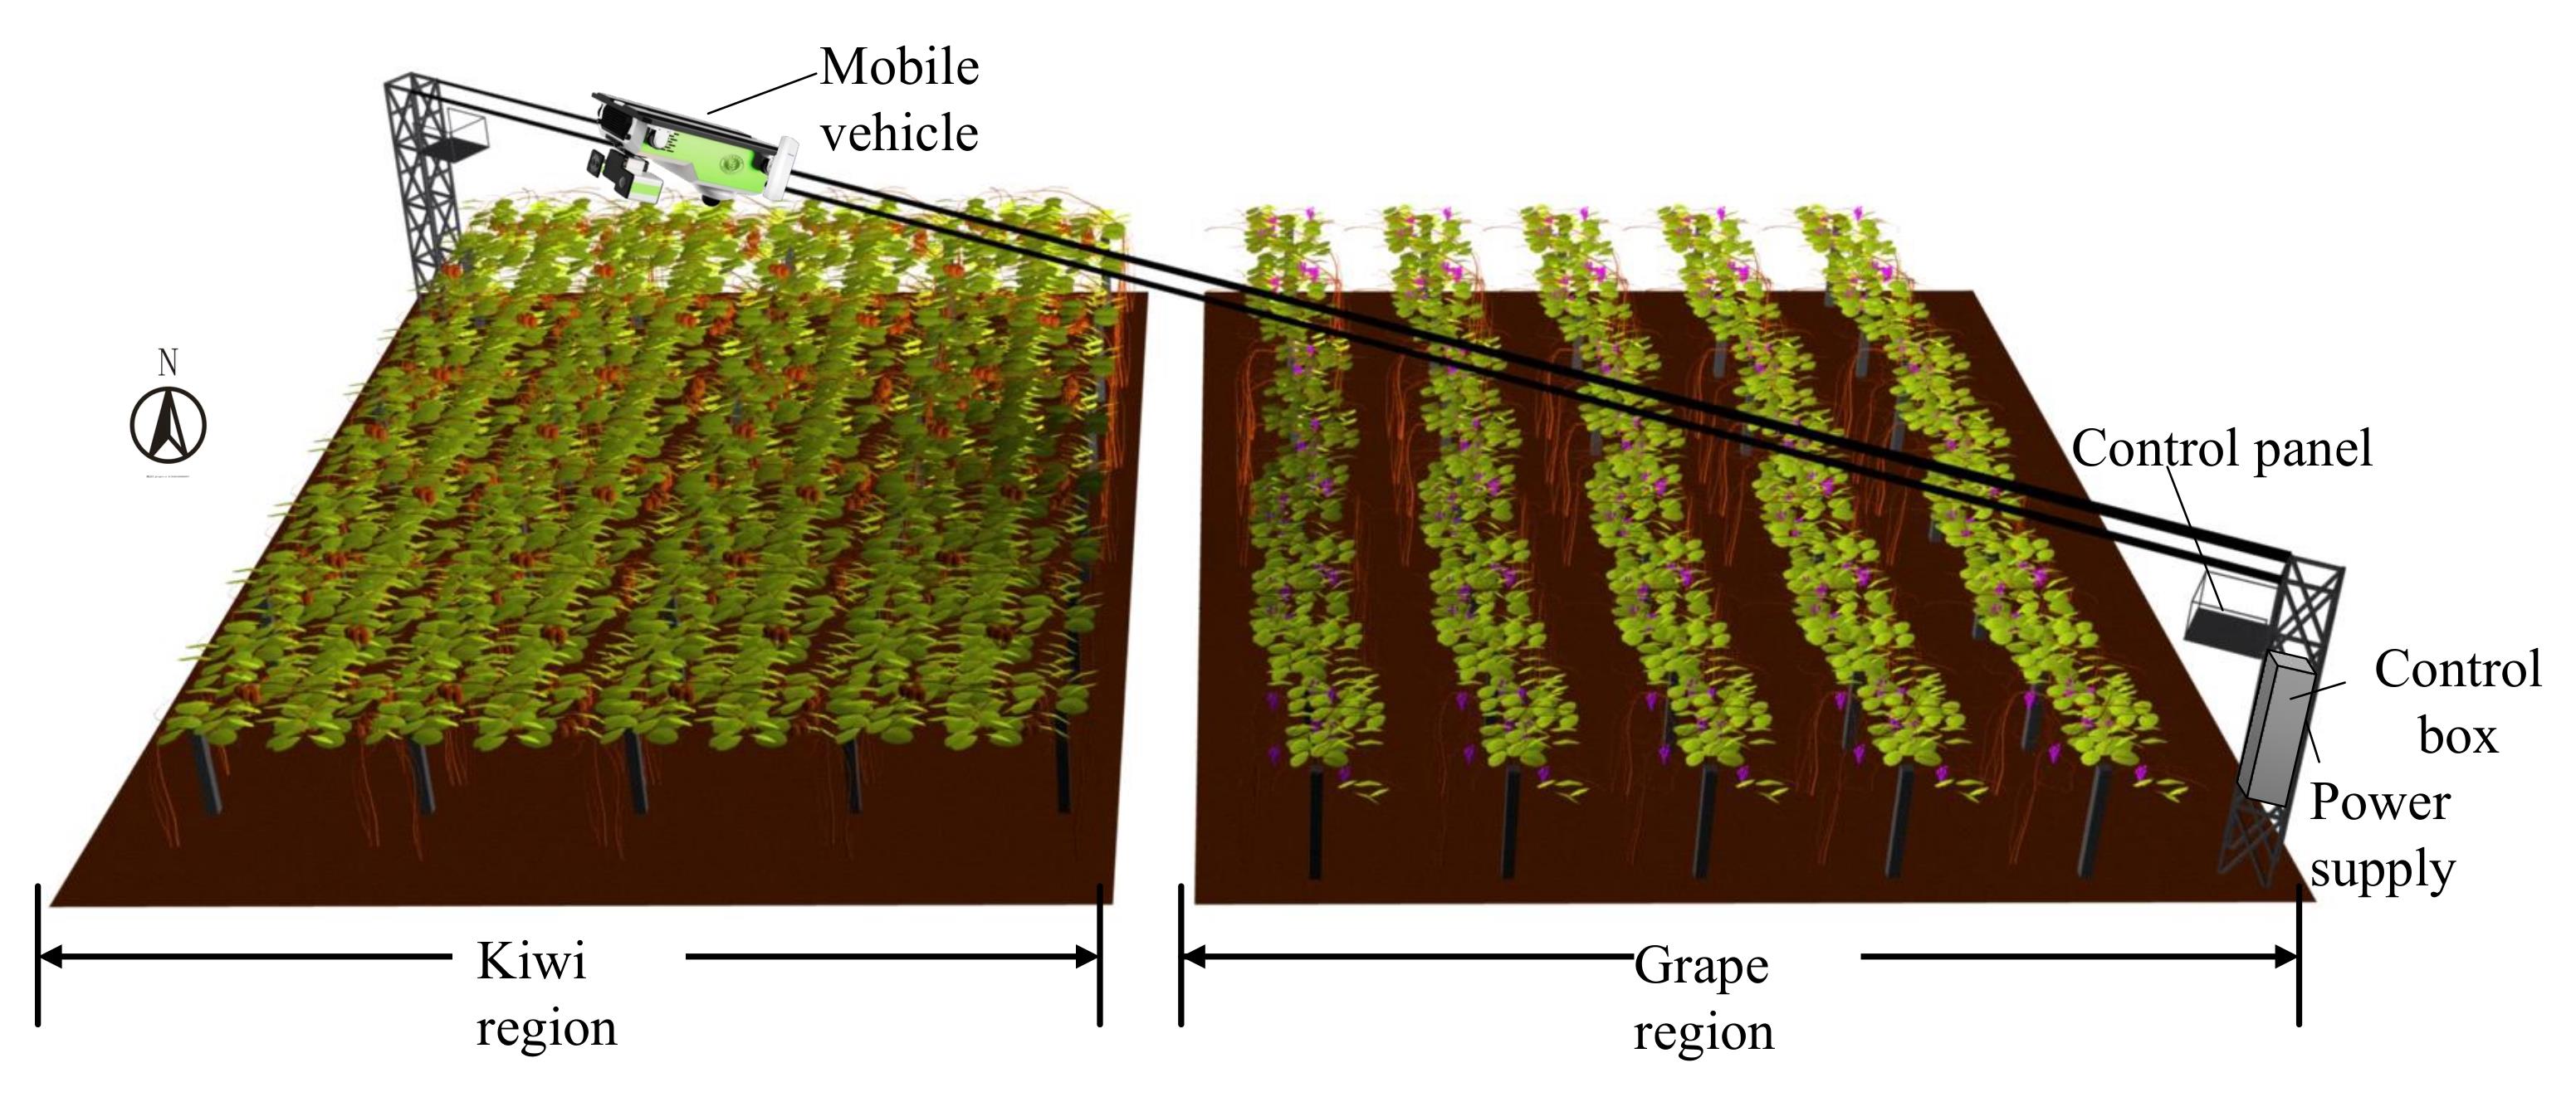
Table 1
Parameters of temperature recorder of data preprocessing study
| Parameter | Specification |
|---|---|
| Measurement range | -20~80 ℃ |
| Measurement accuracy | ±0.5 ℃ |
| Response time | ≤1 s |
| Operating environment | -40~85 ℃, Humidity ≤95%RH |
| Data storage frequency | Every 10 minutes |
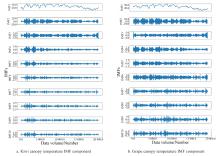
Fig. 3
Results of VMD decomposition

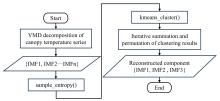
Fig. 4
Flowchart of reconstruction with K-means
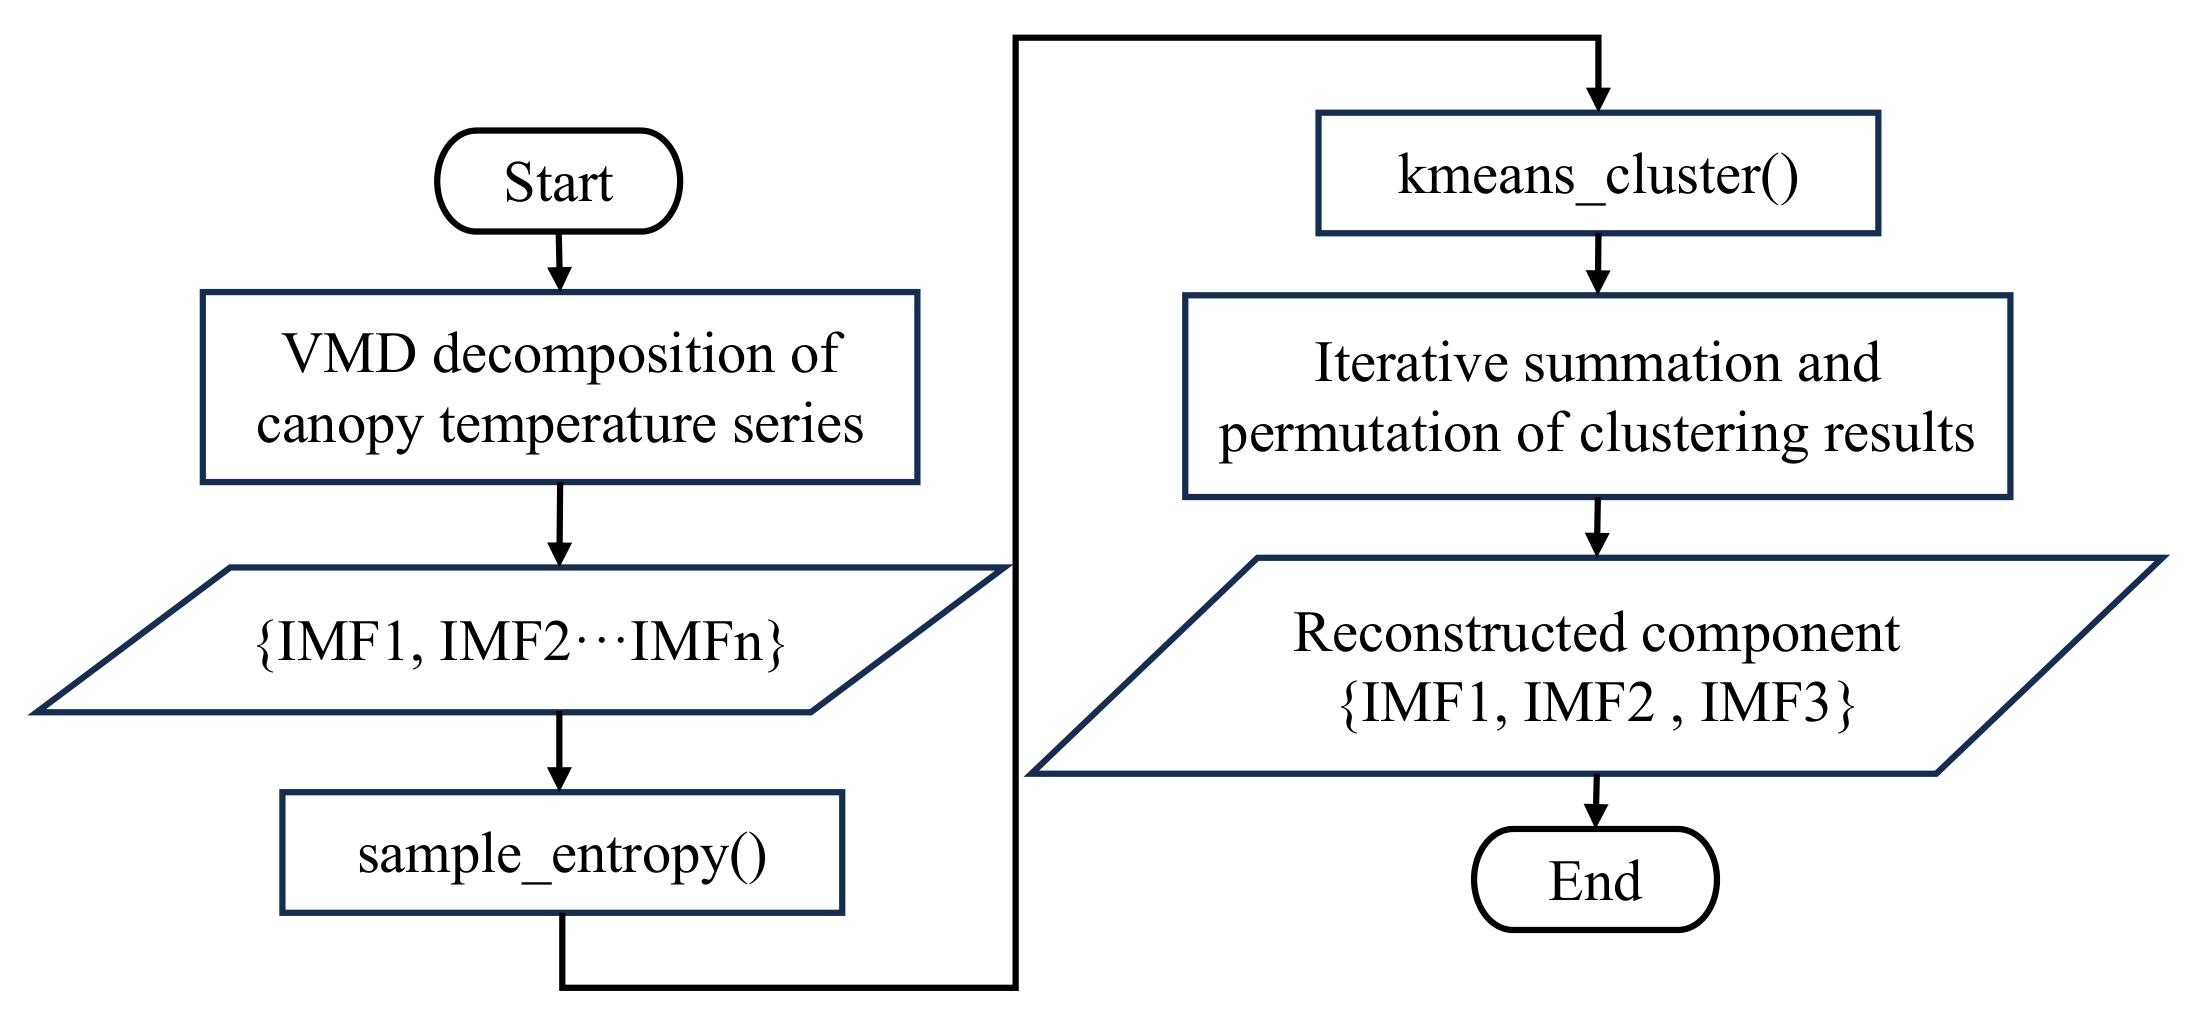

Fig. 5
Results of reconstruction with K-means
Fig. 6
Framework of RIME2-VMD-LSTM model
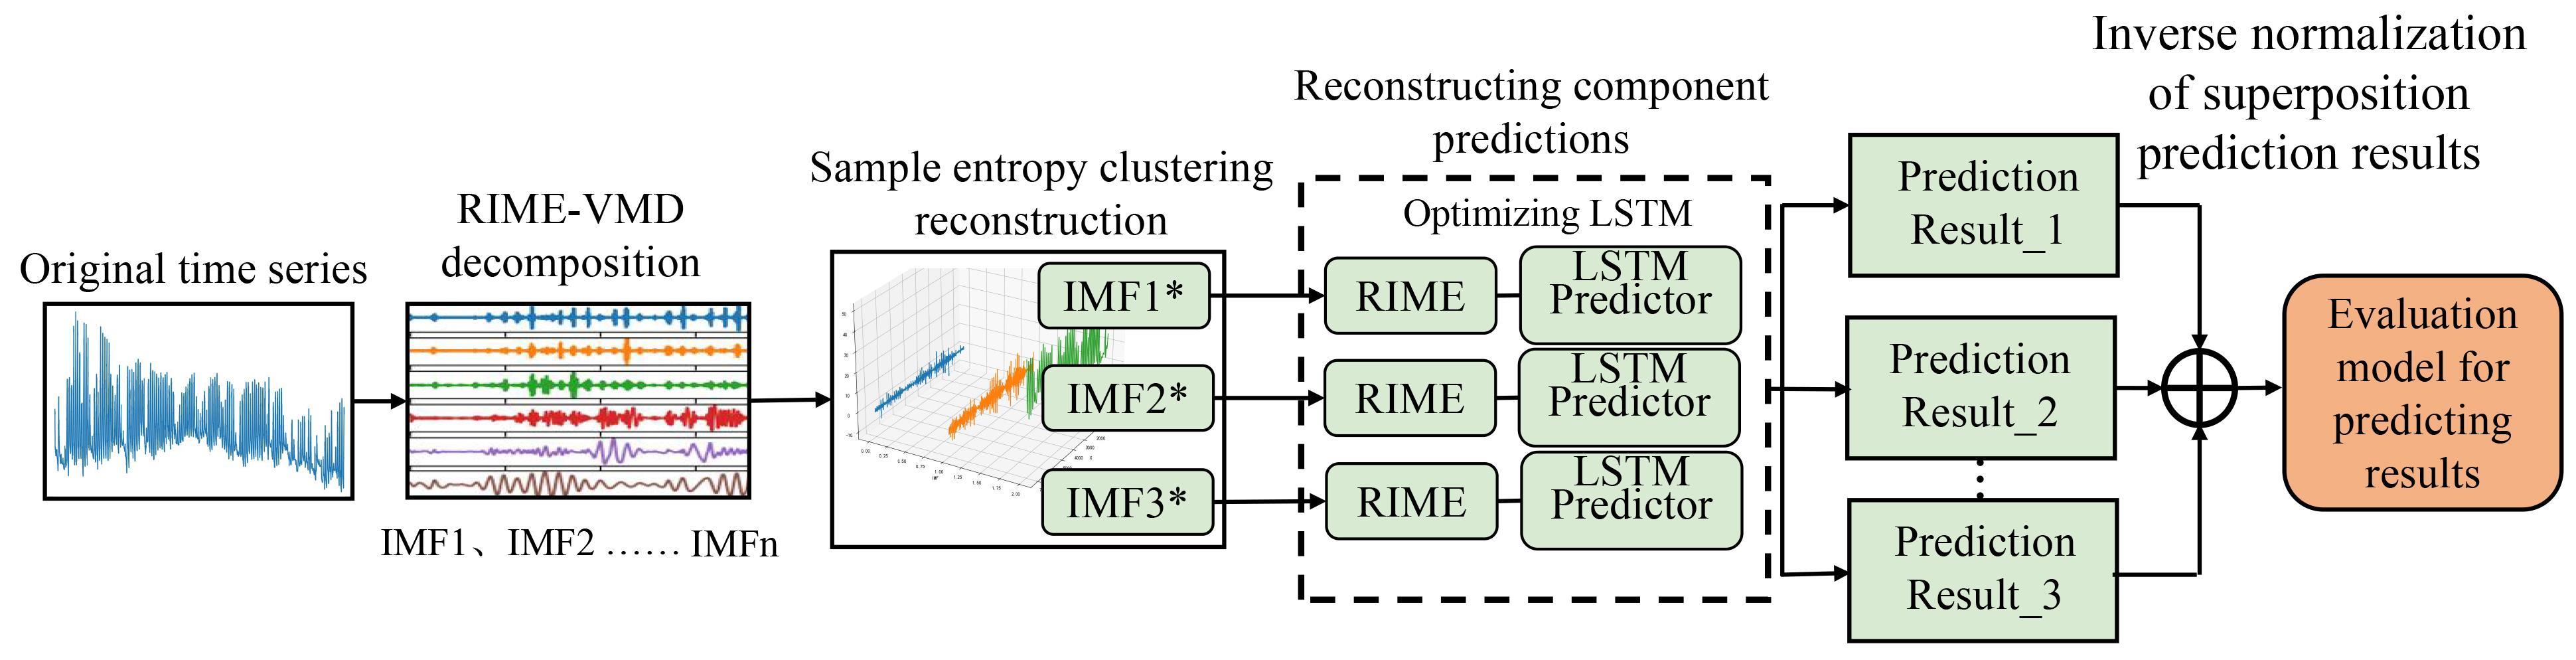
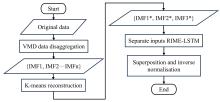
Fig. 7
Flowchart of VMD-RIME-LSTM model

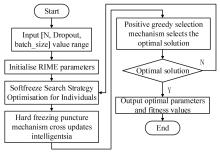
Fig. 8
Flowchart of optimizing LSTM parameters with RIME algorithm
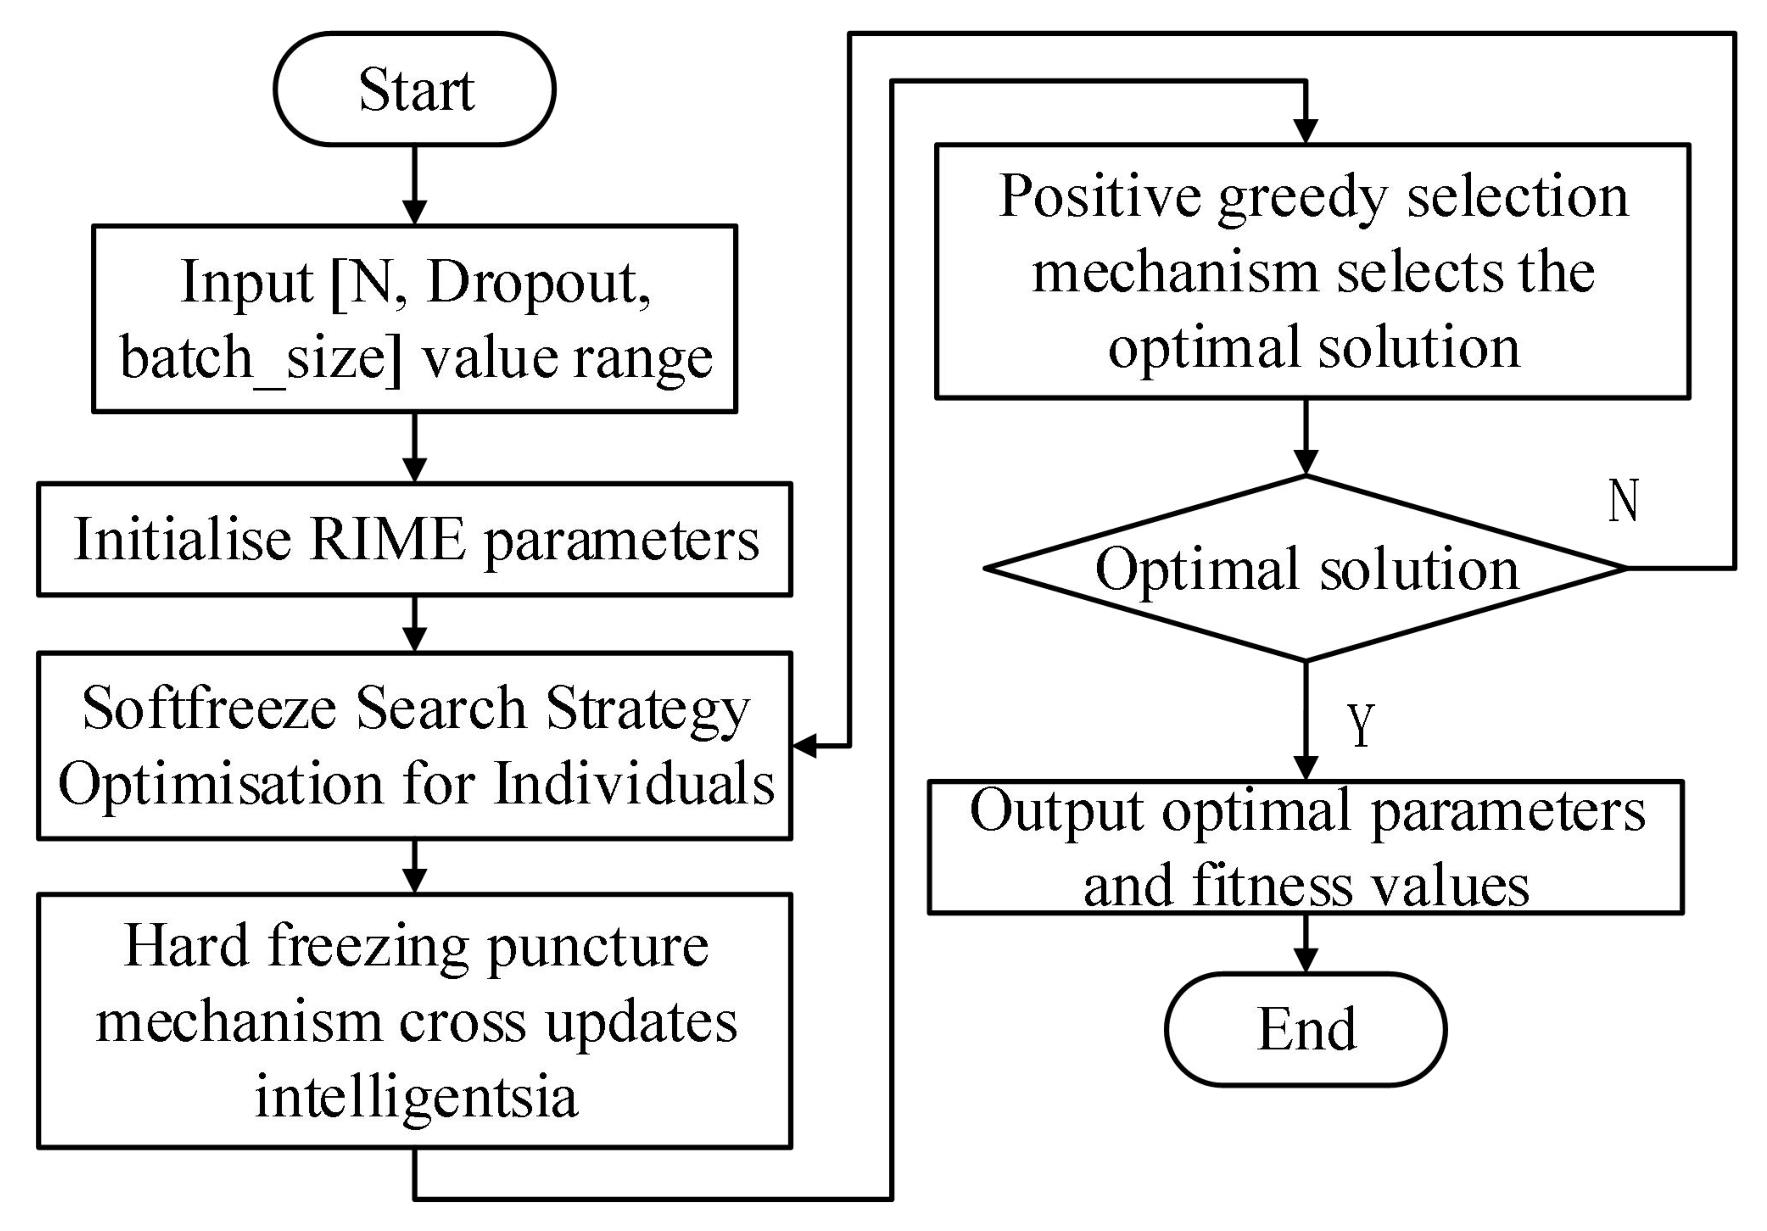
Table 2
Results of ADF tested of data preprocessing study
| Inspection parameters | Inspection results | 1% Threshold | 5% Threshold | 10% Threshold | |
|---|---|---|---|---|---|
| Kiwi canopy temperature | -14.401 | 0.000 0 | -3.960 | -3.410 | -3.120 |
| Grape canopy temperature | -11.700 | 0.000 0 | -3.430 | -2.860 | -2.570 |
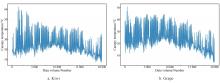
Fig. 9
Tendency of canopy temperature

Table 3
Prediction results of decomposition combination models with L in=8 of model forecasting study
| Number of neurons/cell | LSTM | EMD-LSTM | CEEMDAN-LSTM | |||
|---|---|---|---|---|---|---|
| MSE/℃ | MAE/℃ | MSE/℃ | MAE/℃ | MSE/℃ | MAE/℃ | |
| 50 | 0.479 0 | 0.535 0 | 0.215 0 | 0.303 5 | 0.216 5 | 0.280 5 |
| 100 | 0.456 5 | 0.473 0 | 0.148 0 | 0.278 0 | 0.329 0 | 0.348 0 |
| 150 | 0.909 5 | 0.786 5 | 0.188 5 | 0.304 0 | 0.169 5 | 0.272 0 |
| 200 | 0.327 0 | 0.389 0 | 0.249 5 | 0.310 5 | 0.215 5 | 0.302 5 |
| 250 | 0.405 5 | 0.447 5 | 0.233 0 | 0.326 5 | 0.289 5 | 0.337 0 |
| Number of neurons/cell | VMD-LSTM | SGMD-LSTM | TVF-EMD-LSTM | |||
| MSE/℃ | MAE/℃ | MSE/℃ | MAE/℃ | MSE/℃ | MAE/℃ | |
| 50 | 0.101 5 | 0.192 5 | 0.185 0 | 0.262 5 | 0.178 5 | 0.242 5 |
| 100 | 0.095 0 | 0.195 0 | 0.464 0 | 0.380 0 | 0.186 5 | 0.261 5 |
| 150 | 0.100 5 | 0.203 0 | 0.675 5 | 0.432 5 | 0.175 0 | 0.252 5 |
| 200 | 0.127 0 | 0.213 0 | 0.409 5 | 0.398 0 | 0.205 0 | 0.299 0 |
| 250 | 0.114 5 | 0.225 0 | 0.261 5 | 0.335 0 | 0.209 5 | 0.299 5 |
Table 4
Prediction results of decomposition combination models with L in=16 of model forecasting study
| Number of neurons/cell | LSTM | EMD-LSTM | CEEMDAN-LSTM | |||
|---|---|---|---|---|---|---|
| MSE/℃ | MAE/℃ | MSE/℃ | MAE/℃ | MSE/℃ | MAE/℃ | |
| 50 | 0.563 0 | 0.548 5 | 0.336 5 | 0.402 5 | 0.318 0 | 0.325 0 |
| 100 | 0.414 0 | 0.427 5 | 0.270 0 | 0.368 5 | 0.487 0 | 0.481 0 |
| 150 | 0.568 0 | 0.529 0 | 0.481 0 | 0.495 5 | 0.367 0 | 0.427 5 |
| 200 | 0.323 5 | 0.405 5 | 0.380 5 | 0.477 0 | 0.421 0 | 0.425 0 |
| 250 | 0.502 0 | 0.477 5 | 0.601 5 | 0.510 5 | 0.380 0 | 0.413 0 |
| Number of neurons/cell | VMD-LSTM | SGMD-LSTM | TVF-EMD-LSTM | |||
| MSE/℃ | MAE/℃ | MSE/℃ | MAE/℃ | MSE/℃ | MAE/℃ | |
| 50 | 0.273 5 | 0.325 5 | 0.282 5 | 0.369 5 | 0.416 5 | 0.415 5 |
| 100 | 0.282 0 | 0.390 5 | 0.437 0 | 0.475 5 | 0.348 0 | 0.440 5 |
| 150 | 0.257 0 | 0.320 0 | 0.930 5 | 0.604 0 | 0.273 5 | 0.370 0 |
| 200 | 0.250 0 | 0.326 5 | 0.713 5 | 0.543 5 | 0.267 0 | 0.357 0 |
| 250 | 0.278 0 | 0.325 0 | 0.662 5 | 0.524 5 | 0.249 0 | 0.315 5 |
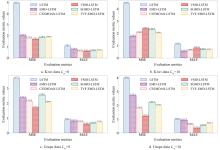
Fig. 10
Comparison chart of the average crease in evaluation metrics of model performance comparison study

Table 5
Predicted results with different optimization algorithms of model forecasting study
| Temp | comparison models | Next 1 hour | Next 2 hours | Next 3 hours | Average | ||||
|---|---|---|---|---|---|---|---|---|---|
| RMSE/℃ | MAE/℃ | RMSE/℃ | MAE/℃ | RMSE/℃ | MAE/℃ | RMSE/℃ | MAE/℃ | ||
| Kiwi canopy | VMD-PSO-LSTM | 1.498 0 | 0.943 8 | 2.958 7 | 1.818 0 | 4.251 3 | 2.604 3 | 2.902 7 | 1.788 7 |
| VMD-SSA-LSTM | 1.478 2 | 0.903 2 | 2.912 4 | 1.756 9 | 4.170 3 | 2.502 7 | 2.853 6 | 1.720 9 | |
| VMD-GWO-LSTM | 1.481 3 | 0.915 8 | 2.897 2 | 2.302 2 | 4.186 4 | 2.549 6 | 2.855 0 | 1.922 5 | |
| VMD-SAO-LSTM | 1.504 5 | 0.919 1 | 3.041 4 | 1.850 3 | 4.397 6 | 2.680 5 | 2.981 2 | 1.816 6 | |
| VMD-RIME-LSTM | 1.465 8 | 0.900 7 | 2.873 9 | 1.732 1 | 4.196 3 | 2.522 8 | 2.845 3 | 1.718 5 | |
| Grapes canopy | VMD-PSO-LSTM | 1.371 2 | 0.882 4 | 2.620 0 | 1.770 5 | 3.685 6 | 2.581 5 | 2.558 9 | 1.744 8 |
| VMD-SSA-LSTM | 1.401 1 | 0.879 7 | 2.580 0 | 1.774 3 | 3.667 4 | 2.570 0 | 2.549 5 | 1.741 3 | |
| VMD-GWO-LSTM | 1.418 7 | 0.902 8 | 2.664 6 | 1.756 5 | 3.744 4 | 2.514 0 | 2.609 2 | 1.724 4 | |
| VMD-SAO-LSTM | 1.357 5 | 0.876 6 | 2.564 9 | 1.733 8 | 3.632 2 | 2.526 8 | 2.518 2 | 1.712 4 | |
| VMD-RIME-LSTM | 1.378 6 | 0.897 3 | 2.611 8 | 1.731 0 | 3.635 7 | 2.459 3 | 2.542 0 | 1.695 9 | |
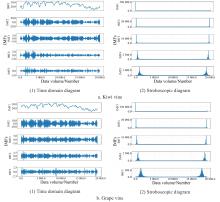
Fig. 11
Time-domain graph and frequency-domain graph of VMD decomposition

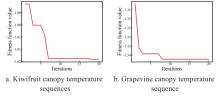
Fig. 12
Convergence curve of fitness values
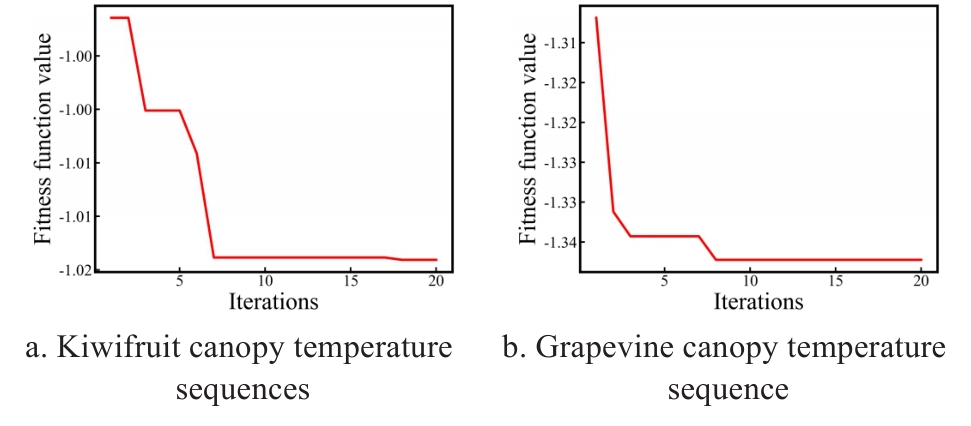
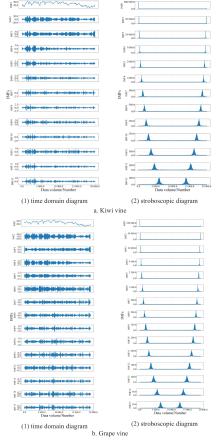
Fig. 13
Time and frequency domain plots of RIME-VMD decomposition

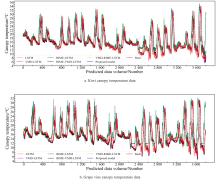
Fig. 14
Prediction performance chart of different models of ablation study

Table 6
Results of ablation experiment of model forecasting study
| Temp | Comparison models | Next 1 hour | Next 2 hours | Next 3 hours | ||||||
|---|---|---|---|---|---|---|---|---|---|---|
| RMSE/℃ | MAE/℃ | R 2 | RMSE/℃ | MAE/℃ | R 2 | RMSE/℃ | MAE/℃ | R 2 | ||
| Kiwi canopy | LSTM | 1.926 3 | 1.195 8 | 0.829 5 | 2.819 4 | 1.871 4 | 0.731 9 | 4.717 0 | 2.564 3 | 0.412 1 |
| VMD-LSTM | 1.734 1 | 1.200 3 | 0.876 5 | 2.805 2 | 1.760 6 | 0.769 4 | 4.437 4 | 2.976 8 | 0.491 2 | |
| RIME-LSTM | 1.933 3 | 1.234 3 | 0.849 1 | 2.842 6 | 1.930 9 | 0.890 1 | 4.196 3 | 2.522 8 | 0.477 7 | |
| RIME-VMD-LSTM | 1.708 5 | 1.174 5 | 0.879 8 | 3.205 2 | 2.125 6 | 0.756 9 | 4.548 9 | 3.005 0 | 0.347 7 | |
| VMD-RIME-LSTM | 1.465 8 | 0.937 9 | 0.911 7 | 2.912 4 | 1.756 9 | 0.761 6 | 4.096 6 | 2.613 6 | 0.509 6 | |
| Proposed model | 1.446 6 | 0.900 7 | 0.963 9 | 1.734 1 | 2.116 0 | 0.906 3 | 3.678 9 | 2.547 1 | 0.655 9 | |
| Grape canopy | LSTM | 1.860 6 | 1.259 0 | 0.841 7 | 2.997 6 | 2.099 4 | 0.648 7 | 4.038 2 | 2.926 3 | 0.425 3 |
| VMD-LSTM | 1.610 8 | 1.194 9 | 0.923 2 | 2.734 0 | 1.936 2 | 0.663 5 | 3.753 1 | 2.611 0 | 0.465 9 | |
| RIME-LSTM | 1.810 8 | 1.250 5 | 0.884 8 | 2.772 0 | 1.837 6 | 0.653 0 | 3.937 5 | 2.666 9 | 0.299 9 | |
| RIME-VMD-LSTM | 1.574 5 | 1.125 0 | 0.888 1 | 2.686 4 | 1.852 2 | 0.674 1 | 3.731 2 | 2.598 4 | 0.371 4 | |
| VMD-RIME-LSTM | 1.465 8 | 0.924 6 | 0.914 4 | 2.611 8 | 1.731 0 | 0.692 9 | 4.196 3 | 2.522 8 | 0.476 7 | |
| Proposed model | 1.378 6 | 0.897 3 | 0.973 0 | 1.810 8 | 1.250 5 | 0.914 8 | 1.810 8 | 1.250 5 | 0.644 8 | |
Table 7
Average results of ablation experiments on two kinds of datasets of model forecasting study
| Comparison models | Next 1 hour | Next 2 hours | Next 3 hours | ||||||
|---|---|---|---|---|---|---|---|---|---|
| RMSE/℃ | MAE/℃ | R 2 | RMSE/℃ | MAE/℃ | R 2 | RMSE/℃ | MAE/℃ | R 2 | |
| LSTM | 1.893 5 | 1.227 4 | 0.835 6 | 2.908 5 | 1.985 4 | 0.690 3 | 4.377 6 | 2.745 3 | 0.418 7 |
| VMD-LSTM | 1.672 4 | 1.197 6 | 0.899 8 | 2.769 6 | 1.848 4 | 0.716 5 | 4.095 2 | 2.793 9 | 0.478 6 |
| RIME-LSTM | 1.872 1 | 1.242 4 | 0.867 0 | 2.807 3 | 1.884 2 | 0.771 6 | 4.066 9 | 2.594 8 | 0.388 8 |
| RIME-VMD-LSTM | 1.641 5 | 1.149 8 | 0.883 9 | 2.945 8 | 1.988 9 | 0.715 5 | 4.140 0 | 2.801 7 | 0.359 5 |
| VMD-RIME-LSTM | 1.465 8 | 0.931 3 | 0.913 1 | 2.762 1 | 1.744 0 | 0.727 3 | 4.146 4 | 2.568 2 | 0.493 2 |
| Proposed model | 1.412 6 | 0.899 0 | 0.968 4 | 1.772 4 | 1.683 2 | 0.910 5 | 2.744 9 | 1.898 8 | 0.650 4 |
Table 8
Increase/decrease of indicators between the proposed model and the comparative models of model forecasting study
| Comparison models | Next 1 hour | Next 2 hours | Next 3 hours | ||||||
|---|---|---|---|---|---|---|---|---|---|
| RMSE/% | MAE/% | R 2/% | RMSE/% | MAE/% | R 2/% | RMSE/% | MAE/% | R 2/% | |
| LSTM | -25.39 | -26.75 | 15.90 | -39.06 | -15.22 | 31.91 | -37.30 | -30.84 | 55.33 |
| VMD-LSTM | -15.53 | -24.93 | 7.62 | -36.00 | -8.93 | 27.09 | -32.97 | -32.04 | 35.90 |
| RIME-LSTM | -24.54 | -27.64 | 11.71 | -36.86 | -10.67 | 18.01 | -32.51 | -26.82 | 67.28 |
| RIME-VMD-LSTM | -13.94 | -21.81 | 9.56 | -39.83 | -15.37 | 27.26 | -33.70 | -32.23 | 80.89 |
| VMD-RIME-LSTM | -3.63 | -3.46 | 6.06 | -35.83 | -3.48 | 25.20 | -33.80 | -26.07 | 31.87 |
Table 9
Comparison of indicators between the proposed model and the comparative models (kiwi)
| Models | Original data | Uniform noise | Gaussian noise | ||||||
|---|---|---|---|---|---|---|---|---|---|
| RMSE/℃ | MAE/℃ | R 2 | RMSE/℃ | MAE/℃ | R 2 | RMSE/℃ | MAE/℃ | R 2 | |
| CNN | 0.497 2 | 0.316 2 | 0.990 0 | 3.347 3 | 2.794 1 | 0.657 6 | 5.548 9 | 4.416 5 | 0.372 4 |
| GRU | 0.946 0 | 0.586 6 | 0.963 7 | 3.669 9 | 3.017 0 | 0.588 4 | 7.056 5 | 5.617 2 | -0.015 0 |
| LSTM | 0.529 8 | 0.457 0 | 0.978 5 | 13.896 2 | 3.034 6 | 0.575 3 | 6.320 2 | 5.138 7 | 0.237 4 |
| ConvLSTM | 1.150 7 | 1.521 4 | 0.798 0 | 4.003 4 | 3.246 3 | 0.510 2 | 7.170 9 | 5.696 1 | -0.048 1 |
| PC-LSTM | 0.779 1 | 0.601 0 | 0.975 4 | 4.050 9 | 3.271 2 | 0.498 5 | 7.592 3 | 6.008 1 | -0.174 9 |
| Proposed model | 0.360 1 | 0.254 3 | 0.994 7 | 1.501 0 | 1.214 2 | 0.929 7 | 3.885 5 | 3.080 7 | 0.678 9 |
Table 10
Comparison of indicators between the proposed model and the comparative models (grape)
| Models | Original data | Uniform noise | Gaussian noise | ||||||
|---|---|---|---|---|---|---|---|---|---|
| RMSE/℃ | MAE/℃ | R 2 | RMSE/℃ | MAE/℃ | R 2 | RMSE/℃ | MAE/℃ | R 2 | |
| CNN | 0.525 4 | 0.344 4 | 0.987 8 | 3.999 9 | 3.230 0 | 0.486 5 | 5.860 3 | 4.663 9 | 0.297 0 |
| GRU | 1.092 1 | 0.730 6 | 0.947 2 | 4.221 0 | 3.409 7 | 0.428 2 | 7.484 9 | 6.001 6 | -0.146 8 |
| LSTM | 3.321 1 | 1.029 0 | 0.853 1 | 18.878 4 | 3.516 5 | 0.394 1 | 54.543 2 | 5.919 4 | -0.116 5 |
| ConvLSTM | 1.646 0 | 1.145 8 | 0.880 2 | 6.559 2 | 5.034 7 | -0.380 9 | 7.622 9 | 6.137 6 | -0.189 5 |
| PC-LSTM | 0.889 3 | 0.669 8 | 0.965 0 | 4.778 1 | 3.864 1 | 0.267 3 | 8.596 2 | 6.878 1 | -0.512 7 |
| Proposed model | 0.287 0 | 0.185 7 | 0.996 3 | 1.029 4 | 0.817 9 | 0.961 3 | 2.065 0 | 1.656 8 | 0.903 4 |
| [1] |
|
| [2] |
|
| [3] |
|
| [4] |
|
| [5] |
|
| [6] |
|
| [7] |
|
| [8] |
|
| [9] |
|
| [10] |
|
| [11] |
|
| [12] |
|
| [13] |
|
| [14] |
|
| [15] |
|
| [16] |
|
| [17] |
|
| [18] |
|
| [19] |
|
| [20] |
|
| [21] |
|
| [22] |
|
| [23] |
|
| [24] |
|
| [25] |
|
| [1] | LIU Enqi, LIU Miao, WANG Tuo, ZHU Yaohui, CHEN Riqiang, XU Bo, GAO Meiling, ZHANG Jing, YANG Yun, YANG Guijun. A Bi-LSTM Prediction Method for Apple First Flowering Date Based on Enhanced Time-Series Temperature Features [J]. Smart Agriculture, 2026, 8(2): 86-97. |
| [2] | SUN Rong, GAO Han, JIANG Yujie, LI Qiaochu, WU Haoyu, WU Shangrong, YU Shan, XU Lei, YU Liangliang, ZHANG Jie, BAO Yuhai. Progress in Soil Moisture Retrieval under Crop Canopy Cover Based on Multi-polarization SAR Data [J]. Smart Agriculture, 2025, 7(6): 75-95. |
| [3] | ZHANG Yu, LI Xiangting, SUN Yalin, XUE Aidi, ZHANG Yi, JIANG Hailong, SHEN Weizheng. Real-Time Monitoring Method for Cow Rumination Behavior Based on Edge Computing and Improved MobileNet v3 [J]. Smart Agriculture, 2024, 6(4): 29-41. |
| [4] | SHI Jiefeng, HUANG Wei, FAN Xieyang, LI Xiuhua, LU Yangxu, JIANG Zhuhui, WANG Zeping, LUO Wei, ZHANG Muqing. Yield Prediction Models in Guangxi Sugarcane Planting Regions Based on Machine Learning Methods [J]. Smart Agriculture, 2023, 5(2): 82-92. |
| [5] | ZUO Min, HU Tianyu, DONG Wei, ZHANG Kexin, ZHANG Qingchuan. Forecast and Analysis of Agricultural Products Logistics Demand Based on Informer Neural Network: Take the Central China Aera as An Example [J]. Smart Agriculture, 2023, 5(1): 34-43. |
| [6] | XU Yulin, KANG Mengzhen, WANG Xiujuan, HUA Jing, WANG Haoyu, SHEN Zhen. Corn and Soybean Futures Price Intelligent Forecasting Based on Deep Learning [J]. Smart Agriculture, 2022, 4(4): 156-163. |
| [7] | ZHUANG Jiayu, XU Shiwei, LI Yang, XIONG Lu, LIU Kebao, ZHONG Zhiping. Supply and Demand Forecasting Model of Multi-Agricultural Products Based on Deep Learning [J]. Smart Agriculture, 2022, 4(2): 174-182. |
| [8] | LI Liangde, WANG Xiujuan, KANG Mengzhen, HUA Jing, FAN Menghan. Agricultural Named Entity Recognition Based on Semantic Aggregation and Model Distillation [J]. Smart Agriculture, 2021, 3(1): 118-128. |
| [9] | Zhu Hang, Li Hongze, Huang Yu, Yu Haitao, Dong Yunzhe, Li Junxing. Effects of technical operation parameters on spray characteristics of rotor plant protection UAV [J]. Smart Agriculture, 2019, 1(3): 113-122. |
| Viewed | ||||||
|
Full text |
|
|||||
|
Abstract |
|
|||||


