Smart Agriculture ›› 2025, Vol. 7 ›› Issue (1): 97-110.doi: 10.12133/j.smartag.SA202410032
• Topic--Intelligent Agricultural Knowledge Services and Smart Unmanned Farms (Part 2) • Previous Articles Next Articles
GONG Yu1,2, WANG Ling1,2, ZHAO Rongqiang1,2,4( ), YOU Haibo3, ZHOU Mo3, LIU Jie1,2,4
Received:2024-10-20
Online:2025-01-30
Foundation items:The Fundamental Research Funds for the Central Universities in China(2023FRFK06013); The Key Research and Development Program of Heilongjiang Province(2023ZX01A24); Harbin Institute of Technology Horizontal Project(MH20240081)
About author:GONG Yu, E-mail: 2419336982@qq.com
corresponding author:
CLC Number:
GONG Yu, WANG Ling, ZHAO Rongqiang, YOU Haibo, ZHOU Mo, LIU Jie. Tomato Growth Height Prediction Method by Phenotypic Feature Extraction Using Multi-modal Data[J]. Smart Agriculture, 2025, 7(1): 97-110.
Add to citation manager EndNote|Ris|BibTeX
URL: https://www.smartag.net.cn/EN/10.12133/j.smartag.SA202410032
Table 1
Comparison on fertilization methods of different tomato groups
| KNO3/g | NH4H2PO4/g | KH2PO4/g | K2SO4/g | MgSO4·7H2O/g | CaCl2/g | CaNO3·4H2O/g | |
|---|---|---|---|---|---|---|---|
| CK | 0.0 | 0.0 | 27.2 | 52.3 | 24.6 | 44.4 | 0.0 |
| T1 | 13.4 | 7.7 | 0.0 | 34.8 | 24.6 | 44.4 | 0.0 |
| T2 | 26.9 | 7.7 | 0.0 | 17.4 | 24.6 | 44.4 | 0.0 |
| T3 | 40.4 | 7.7 | 0.0 | 0.0 | 24.6 | 44.4 | 0.0 |
| T4 | 40.4 | 7.7 | 0.0 | 0.0 | 24.6 | 29.6 | 11.8 |
| T5 | 40.4 | 7.7 | 0.0 | 0.0 | 24.6 | 14.8 | 23.6 |
| T6 | 40.4 | 7.7 | 0.0 | 0.0 | 24.6 | 0.0 | 35.4 |
Table 2
Micronutrient application of tomato
| Molecular | Molecular weight standard concentration/(mg/L) |
|---|---|
| FeSO4·7H2O | 13.206 |
| EDTA·H2O | 17.679 |
| EDTA·3H2O | 20.000 |
| MnSO4·H2O | 1.614 |
| MnSO4· 4H2O | 2.130 |
| H3BO3 | 2.860 |
| ZnSO4·7H2O | 0.220 |
| CuSO4·5H2O | 0.080 |
| Na2MO4·2H2O | 0.020 |
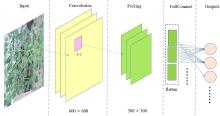
Fig. 1
Architecture of simple CNN
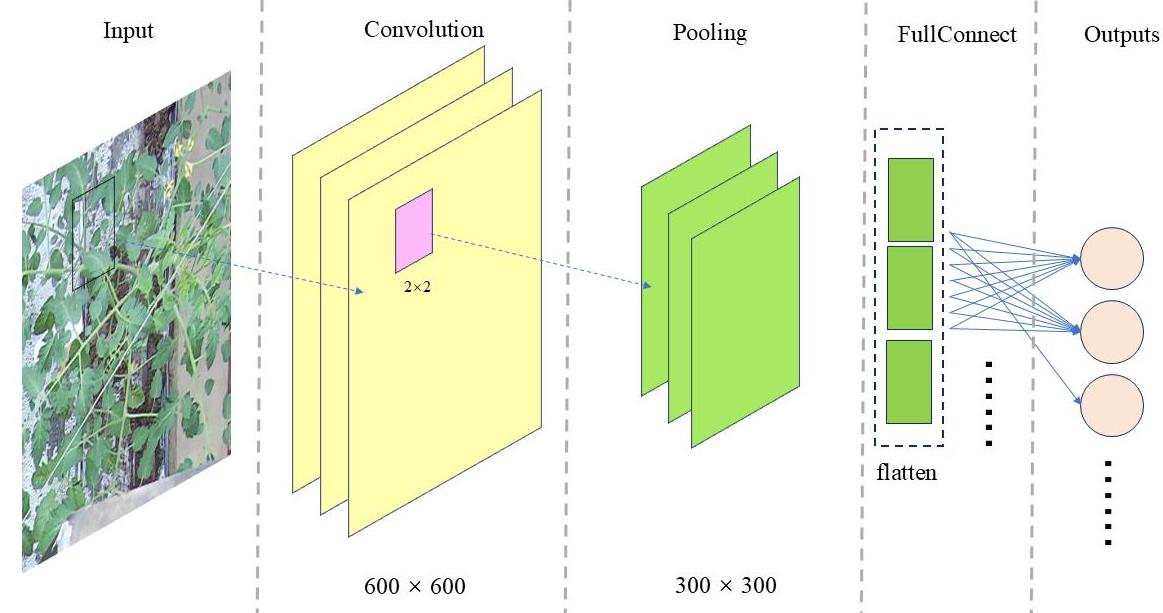
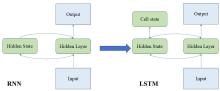
Fig. 2
Architecture of RNN and LSTM
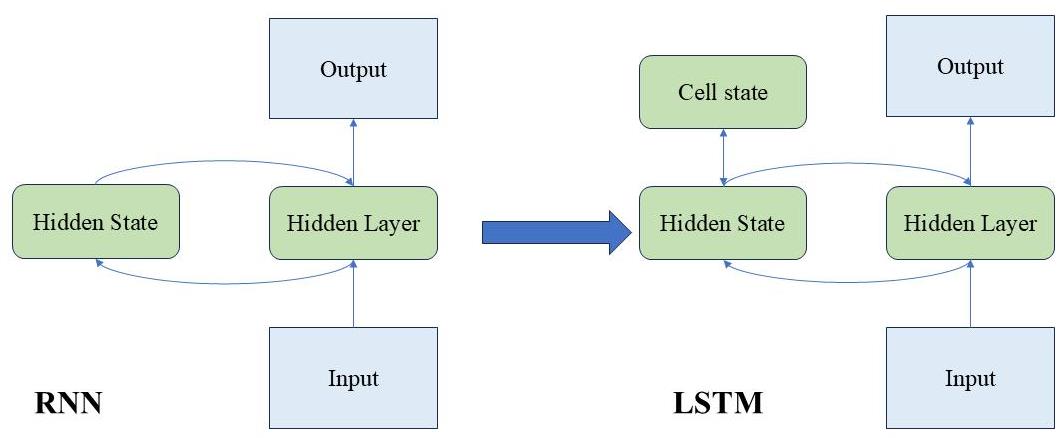
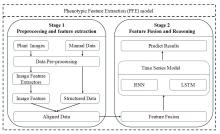
Fig. 3
Process flow of tomato growth height prediction method by phenotypic feature extraction using multi-modal data study
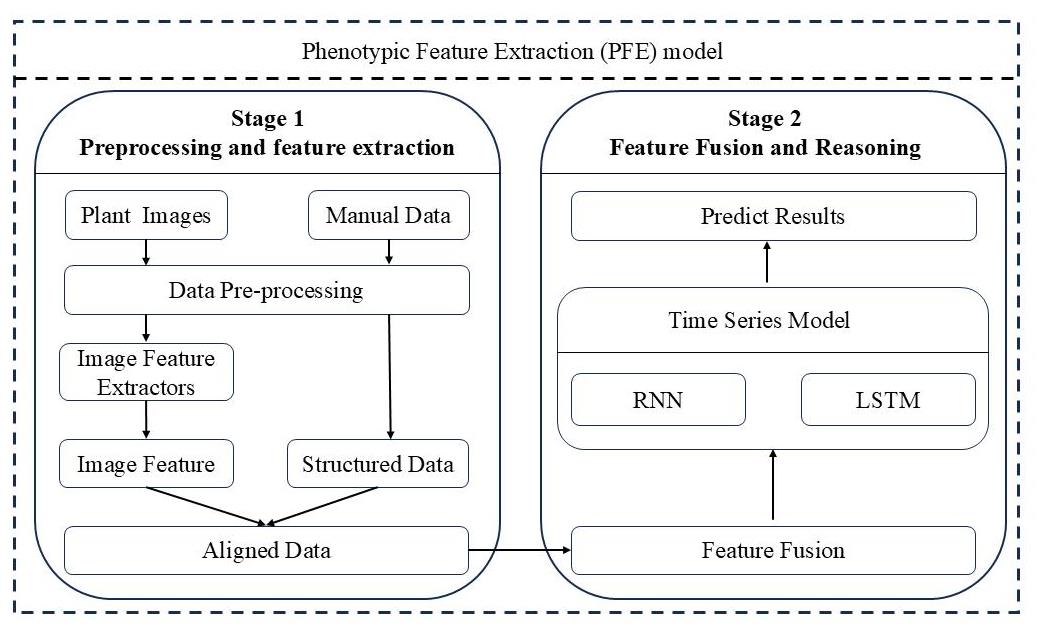
Table 3
Parameters for CNN operation of extract image features
| Network Structure | Parameters |
|---|---|
| Convolutional kernel | 3×3 |
| Convolutional stride | 1 |
| Convolutional padding | 1 |
| Pooling kernel | 2×2 |
| Pooling stride | 2 |
| Fully connected input | 16×300×300 |
| Fully connected output | 16 |
Table 4
Parameters for RNN operation of tomato height prediction
| Network structure | Parameters |
|---|---|
| Input features | 34 |
| RNN hidden size | 30 |
| RNN layers | 2 |
| Learning rate | 0.001 |
| Loss function | MSELoss |
| Optimizer | Adam |
Table 5
Results of multi-modal prediction using RNN under different hyperparameters in tomato height prediction study
| RNN network layers | Hidden layer size | Prediction scenario | |||||
|---|---|---|---|---|---|---|---|
| Short-term prediction | Mid-term prediction | Long-term prediction | |||||
| MSE | MAPE/% | MSE | MAPE/% | MSE | MAPE/% | ||
| 2 | 15 | 6.89 | 2.16 | 55.21 | 6.03 | 113.17 | 6.74 |
| 20 | 1.89 | 1.25 | 68.13 | 6.87 | 288.93 | 10.81 | |
| 25 | 2.11 | 1.11 | 56.51 | 5.41 | 297.91 | 10.85 | |
| 30 | 3.09 | 1.87 | 56.78 | 4.83 | 236.51 | 10.12 | |
| 3 | 15 | 6.03 | 2.01 | 21.09 | 2.82 | 388.68 | 11.26 |
| 20 | 1.52 | 1.07 | 27.53 | 4.11 | 180.16 | 7.14 | |
| 25 | 3.07 | 1.74 | 46.15 | 6.36 | 165.09 | 6.51 | |
| 30 | 2.49 | 1.50 | 60.96 | 6.71 | 203.26 | 8.26 | |
Table 6
Results of mono-modal prediction using RNN under different hyperparameters in tomato height prediction study
| RNN network layers | Hidden layer size | Prediction scenario | |||||
|---|---|---|---|---|---|---|---|
| Short-term prediction | Mid-term prediction | Long-term prediction | |||||
| MSE | MAPE/% | MSE | MAPE/% | MSE | MAPE/% | ||
| 2 | 15 | 10.26 | 2.61 | 25.04 | 3.18 | 386.39 | 10.01 |
| 20 | 10.82 | 2.62 | 126.04 | 7.70 | 354.20 | 8.61 | |
| 25 | 10.38 | 2.5 | 30.03 | 3.88 | 546.32 | 11.57 | |
| 30 | 12.99 | 2.36 | 18.98 | 2.99 | 425.85 | 11.87 | |
| 3 | 15 | 6.83 | 1.64 | 37.67 | 3.79 | 405.23 | 10.71 |
| 20 | 8.14 | 2.13 | 1 532.62 | 22.76 | 1 140.67 | 17.18 | |
| 25 | 31.33 | 5.41 | 144.03 | 8.28 | 432.18 | 10.94 | |
| 30 | 14.63 | 2.95 | 16.78 | 2.27 | 672.64 | 13.62 | |

Fig. 4
Variation of loss with training epochs under different prediction horizons in tomato height prediction study
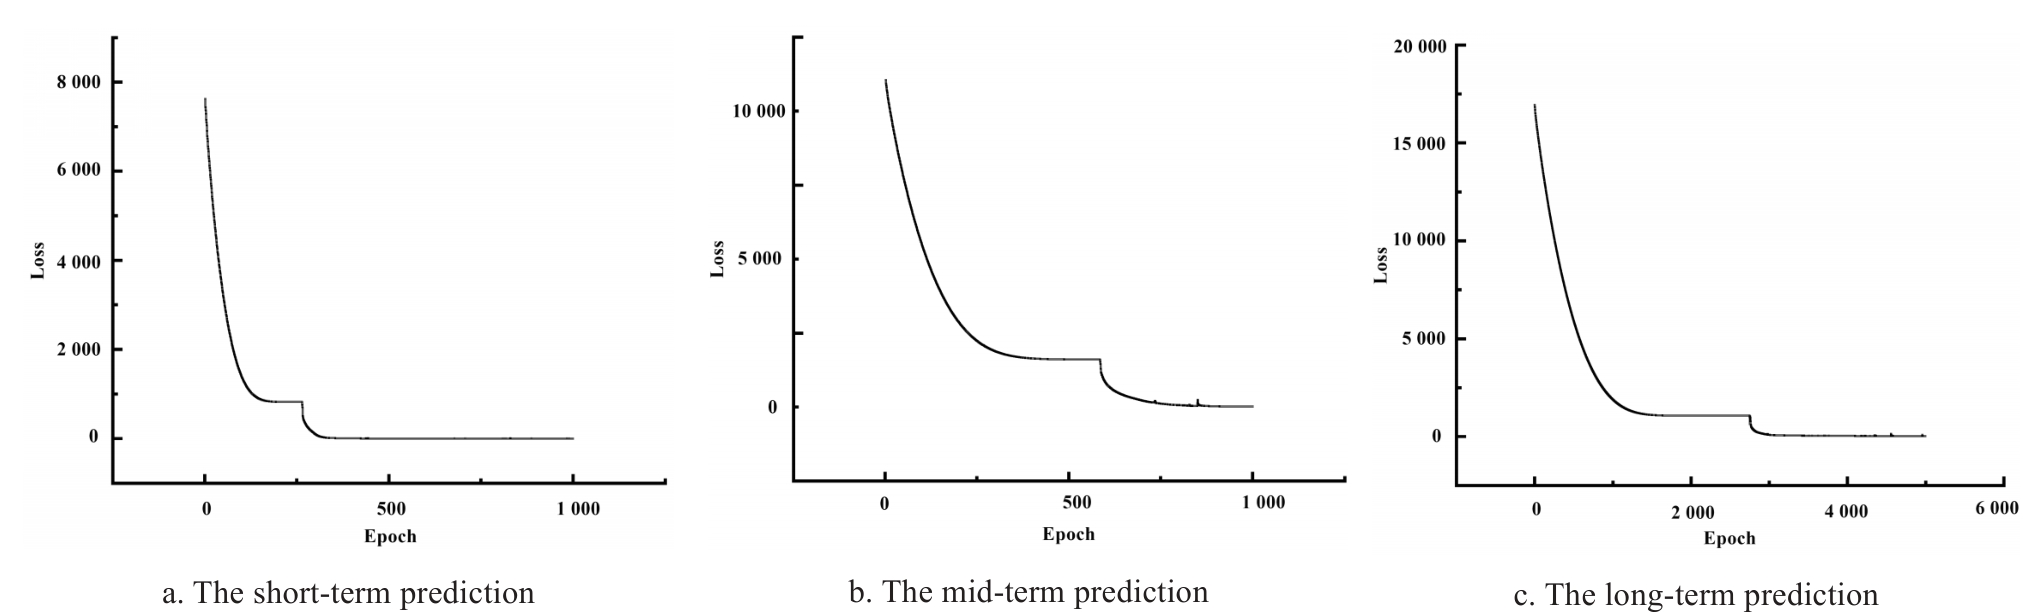
Table 7
The optimal predictive performance of PFE-RNN in tomato height prediction study
| Prediction scenario | Average accuracy/% | Last day accuracy/% | Average percentage error/% | Last day average percentage error/% | R 2 |
|---|---|---|---|---|---|
| Short-term prediction | 91.67 | 91.67 | 0.81 | 0.83 | 0.999 678 |
| Mid-term prediction | 88.54 | 87.50 | 2.66 | 3.11 | 0.991 119 |
| Long-term prediction | 70.37 | 66.67 | 14.05 | 16.63 | -0.041 393 |
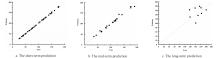
Fig. 5
Distribution of predicted values versus actual values for PFE-RNN prediction in tomato height values
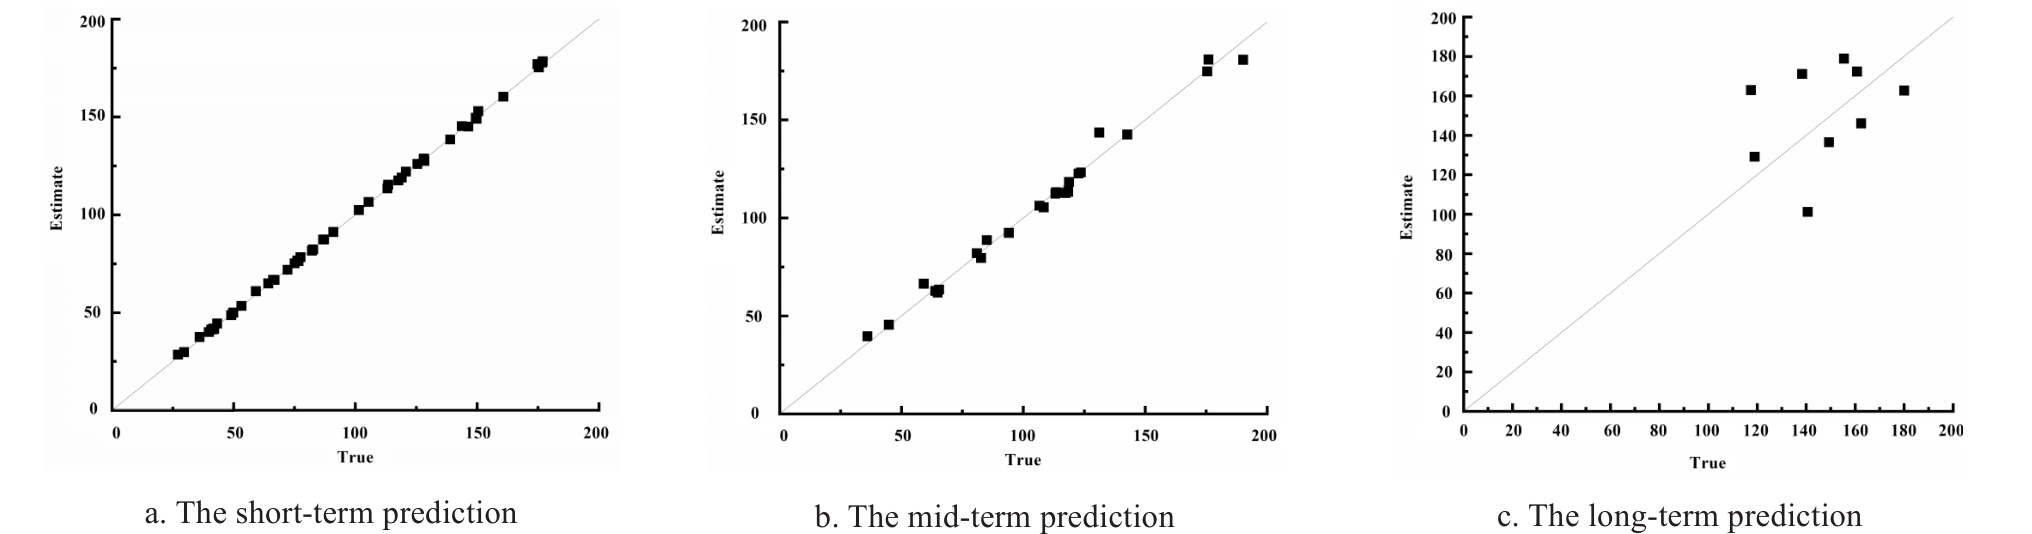
Table 8
Parameters for LSTM operation in tomato height prediction
| Network structure | Parameters |
|---|---|
| Input features | 34 |
| LSTM hidden size | 30 |
| LSTM layers | 2 |
| Learning rate | 0.001 |
| Loss function | MSELoss |
| Optimizer | Adam |
Fig. 6
Variation of loss with training epochs under different prediction horizons in tomato height prediction study

Table 9
Results of multi-modal prediction using LSTM under different hyperparameters in tomato height prediction study
| LSTM network layers | Hidden layer size | Prediction scenario | |||||
|---|---|---|---|---|---|---|---|
| Short-term prediction | Mmid-term prediction | Long-term prediction | |||||
| MSE | MAPE/% | MSE | MAPE/% | MSE | MAPE/% | ||
| 2 | 15 | 1.48 | 0.96 | 121.90 | 8.44 | 153.98 | 7.61 |
| 20 | 3.27 | 1.33 | 104.02 | 7.99 | 204.30 | 8.82 | |
| 25 | 0.57 | 0.88 | 88.01 | 6.63 | 254.83 | 9.67 | |
| 30 | 3.85 | 2.24 | 119.26 | 8.42 | 188.33 | 8.56 | |
| 3 | 15 | 0.21 | 0.54 | 81.72 | 7.60 | 547.96 | 15.03 |
| 20 | 1.56 | 1.44 | 105.02 | 8.89 | 286.87 | 10.56 | |
| 25 | 0.91 | 0.99 | 87.00 | 7.09 | 286.13 | 8.62 | |
| 30 | 0.34 | 0.73 | 98.91 | 7.16 | 172.19 | 6.54 | |
Table 10
Results of mono-modal prediction using LSTM under different hyperparameters in tomato height prediction study
| LSTM network layers | Hidden layer size | Prediction scenario | |||||
|---|---|---|---|---|---|---|---|
| Short-term prediction | Mid-term prediction | Long-term prediction | |||||
| MSE | MAPE/% | MSE | MAPE/% | MSE | MAPE/% | ||
| 2 | 15 | 6.68 | 1.83 | 31.11 | 3.39 | 802.94 | 15.17 |
| 20 | 2.99 | 1.40 | 18.01 | 2.56 | 378.78 | 9.44 | |
| 25 | 6.59 | 2.22 | 39.56 | 4.25 | 486.95 | 11.55 | |
| 30 | 5.15 | 1.52 | 30.60 | 3.43 | 358.90 | 9.49 | |
| 3 | 15 | 3.79 | 1.37 | 37.67 | 3.79 | 870.38 | 15.67 |
| 20 | 3.89 | 1.39 | 21.53 | 2.84 | 507.24 | 10.95 | |
| 25 | 3.41 | 1.40 | 30.07 | 3.58 | 485.04 | 11.79 | |
| 30 | 7.01 | 1.74 | 153.36 | 7.81 | 385.27 | 8.66 | |
Table 11
Optimal predictive performance of PFE-LSTM model in tomato height prediction study
| Prediction scenario | Average accuracy/% | Last day accuracy/% | Average percentage error/% | Last day average percentage error/% | R 2 |
|---|---|---|---|---|---|
| Short-term prediction | 97.92 | 97.92 | 0.40 | 0.38 | 0.999 901 |
| Mid-term prediction | 53.13 | 41.67 | 6.36 | 7.72 | 0.965 263 |
| Long-term prediction | 50.93 | 33.33 | 14.49 | 19.48 | -0.277 455 |
Fig. 7
Distribution of predicted values versus actual values for PFE-LSTM model
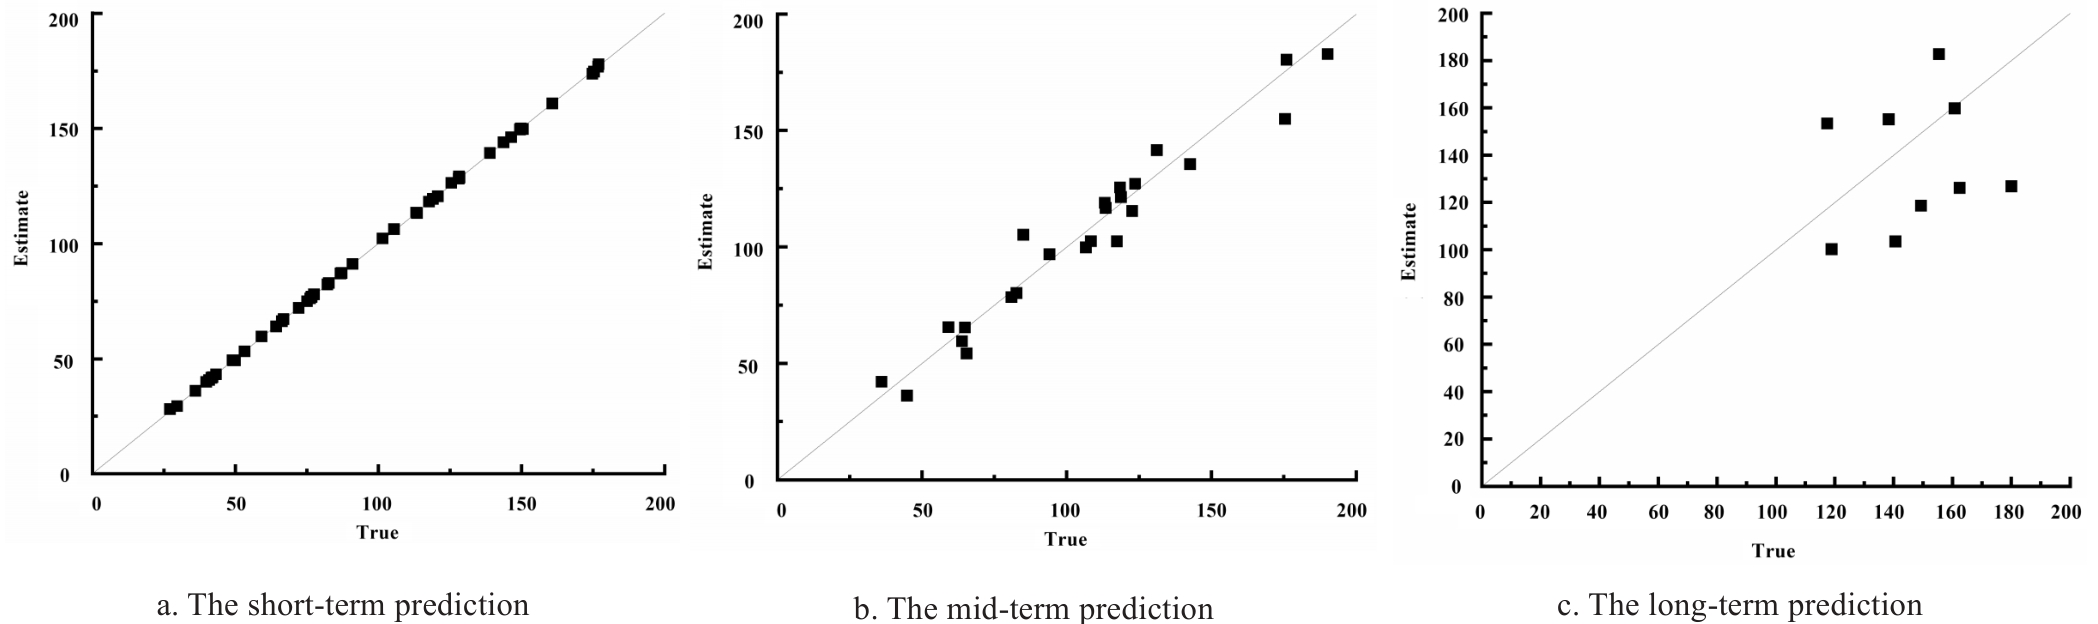
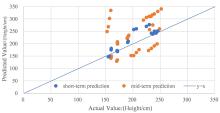
Fig. 8
Distribution of predicted values versus actual values for LLM prediction in tomato height
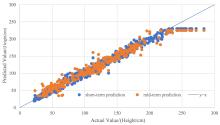
Fig. 9
Distribution of predicted values versus actual values for transformer prediction of tomato height

Table 12
Comparison of results from different methods of tomato height prediction study
| Model | Prediction scenario | MAPE/% | MSE | Last day MAPE/% |
|---|---|---|---|---|
| PFE-RNN | Short-term prediction | 0.81 | 0.56 | 0.83 |
| Mid-term prediction | 2.66 | 17.04 | 3.11 | |
| Long-term prediction | 14.05 | 651.35 | 16.63 | |
| PFE-LSTM | Short-term prediction | 0.40 | 0.12 | 0.38 |
| Mid-term prediction | 6.36 | 82.54 | 7.72 | |
| Long-term prediction | 14.49 | 696.22 | 19.48 | |
| Transformer | Short-term prediction | 6.72 | 74.71 | 6.33 |
| Mid-term prediction | 10.29 | 144.62 | 9.65 | |
| LLM | Short-term prediction | 8.00 | 588.26 | 7.90 |
| Mid-term prediction | 27.43 | 4 067.70 | 28.93 |
| 1 |
|
| 2 |
|
| 3 |
|
| 4 |
|
| 5 |
|
| 6 |
|
| 7 |
|
| 8 |
|
| 9 |
|
| 10 |
|
| 11 |
|
| 12 |
|
| 13 |
|
| 14 |
|
| 15 |
|
| 16 |
|
| 17 |
|
| 18 |
|
| 19 |
|
| 20 |
|
| 21 |
|
| 22 |
|
| 23 |
|
| 24 |
|
| 25 |
|
| 26 |
|
| 27 |
|
| 28 |
|
| 29 |
|
| 30 |
|
| 31 |
|
| [1] | WU Zhangbin, HE Ning, WU Yandong, GUO Xinyu, WEN Weiliang. Point Cloud Data-driven Methods for Estimating Maize Leaf Biomass [J]. Smart Agriculture, 2026, 8(1): 156-166. |
| [2] | CAI Yuqin, LIU Daming, XU Qin, LI Boyang, LIU Bojie. Greenhouse Temperature and Humidity Prediction Method Based on Adaptive Kalman Filter and GWO-LSTM-Attention [J]. Smart Agriculture, 2026, 8(1): 148-155. |
| [3] | YAO Xiaotong, QU Shaoye. Lightweight Detection Method for Pepper Leaf Diseases and Pests Based on Improved YOLOv12s [J]. Smart Agriculture, 2026, 8(1): 1-14. |
| [4] | ZHANG Yun, ZHANG Lumin, XU Guangtao, HAO Jiahui. Remote Sensing Extraction Method of Rice-Crayfish Fields Based on Dual-Branch and Multi-Scale Attention [J]. Smart Agriculture, 2025, 7(6): 185-195. |
| [5] | ZHAO Jun, NIE Zhigang, LI Guang, LIU Jiayu. Corn Borer Pests Infestations Detection Method Using Low-Altitude Close-Range UAV Imagery [J]. Smart Agriculture, 2025, 7(6): 111-123. |
| [6] | LI Wenzheng, YANG Xinting, SUN Chuanheng, CUI Tengpeng, WANG Hui, LI Shanshan, LI Wenyong. Light-Trapping Rice Planthopper Detection Method by Combining Spatial Depth Transform Convolution and Multi-scale Attention Mechanism [J]. Smart Agriculture, 2025, 7(5): 169-181. |
| [7] | HAN Wenkai, LI Tao, FENG Qingchun, CHEN Liping. Lightweight Apple Instance Segmentation Algorithm Based on SSW-YOLOv11n for Complex Orchard Environments [J]. Smart Agriculture, 2025, 7(5): 114-123. |
| [8] | WANG Fengyun, WANG Xuanyu, AN Lei, FENG Wenjie. Detection Method for Log-Cultivated Shiitake Mushrooms Based on Improved RT-DETR [J]. Smart Agriculture, 2025, 7(5): 67-77. |
| [9] | ZHAO Yingping, LIANG Jinming, CHEN Beizhang, DENG Xiaoling, ZHANG Yi, XIONG Zheng, PAN Ming, MENG Xiangbao. Applications Research Progress and Prospects of Multi-Agent Large Language Models in Agricultural [J]. Smart Agriculture, 2025, 7(5): 37-51. |
| [10] | HU Yan, WANG Yujie, ZHANG Xuechen, ZHANG Yiqiang, YU Huahao, SONG Xinbei, YE Sitan, ZHOU Jihong, CHEN Zhenlin, ZONG Weiwei, HE Yong, LI Xiaoli. Non-Destructive Inspection and Intelligent Grading Method of Fu Brick Tea at Fungal Fermentation Stage Based on Hyperspectral Imaging Technology [J]. Smart Agriculture, 2025, 7(4): 71-83. |
| [11] | WANG Yi, XUE Rong, HAN Wenting, SHAO Guomin, HOU Yanqiao, CUI Xitong. Estimation of Maize Aboveground Biomass Based on CNN-LSTM-SA [J]. Smart Agriculture, 2025, 7(4): 159-173. |
| [12] | LI Ruijie, WANG Aidong, WU Huaxing, LI Ziqiu, FENG Xiangqian, HONG Weiyuan, TANG Xuejun, QIN Jinhua, WANG Danying, CHU Guang, ZHANG Yunbo, CHEN Song. Remote Sensing for Rice Growth Stages Monitoring: Research Progress, Bottleneck Problems and Technical Optimization Paths [J]. Smart Agriculture, 2025, 7(3): 89-107. |
| [13] | HAN Yu, QI Kangkang, ZHENG Jiye, LI Jinai, JIANG Fugui, ZHANG Xianglun, YOU Wei, ZHANG Xia. Lightweight Cattle Facial Recognition Method Based on Improved YOLOv11 [J]. Smart Agriculture, 2025, 7(3): 173-184. |
| [14] | MA Liu, MAO Kebiao, GUO Zhonghua. Defogging Remote Sensing Images Method Based on a Hybrid Attention-Based Generative Adversarial Network [J]. Smart Agriculture, 2025, 7(2): 172-182. |
| [15] | WU Huarui, LI Jingchen, YANG Yusen. Intelligent Decision-Making Method for Personalized Vegetable Crop Water and Fertilizer Management Based on Large Language Models [J]. Smart Agriculture, 2025, 7(1): 11-19. |
| Viewed | ||||||
|
Full text |
|
|||||
|
Abstract |
|
|||||


