YIN Qiwei1,2, HE Yan1,2( ), WANG Zongli1, RAO Yuan3
Received:2025-12-05
Online:2026-05-22
Foundation items:国家现代农业产业技术体系项目(CARS-04-PS30); 2026年湖北省自然科学基金(JCZRLH202601007)
About author:尹祈玮,硕士,研究方向为遥感图像处理。E-mail:2694539535@qq.com
YIN Qiwei, E-mail: 2694539535@qq.com
corresponding author:
CLC Number:
YIN Qiwei, HE Yan, WANG Zongli, RAO Yuan. Soybean Yield Estimation Method Based on Multi-Source Data Fusion[J]. Smart Agriculture, doi: 10.12133/j.smartag.SA202512004.
Add to citation manager EndNote|Ris|BibTeX
URL: https://www.smartag.net.cn/EN/10.12133/j.smartag.SA202512004
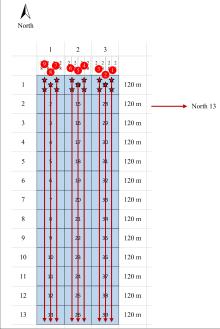
Fig. 1
Five-point sampling combined with grid method for soybean field survey at Jianshan Farm
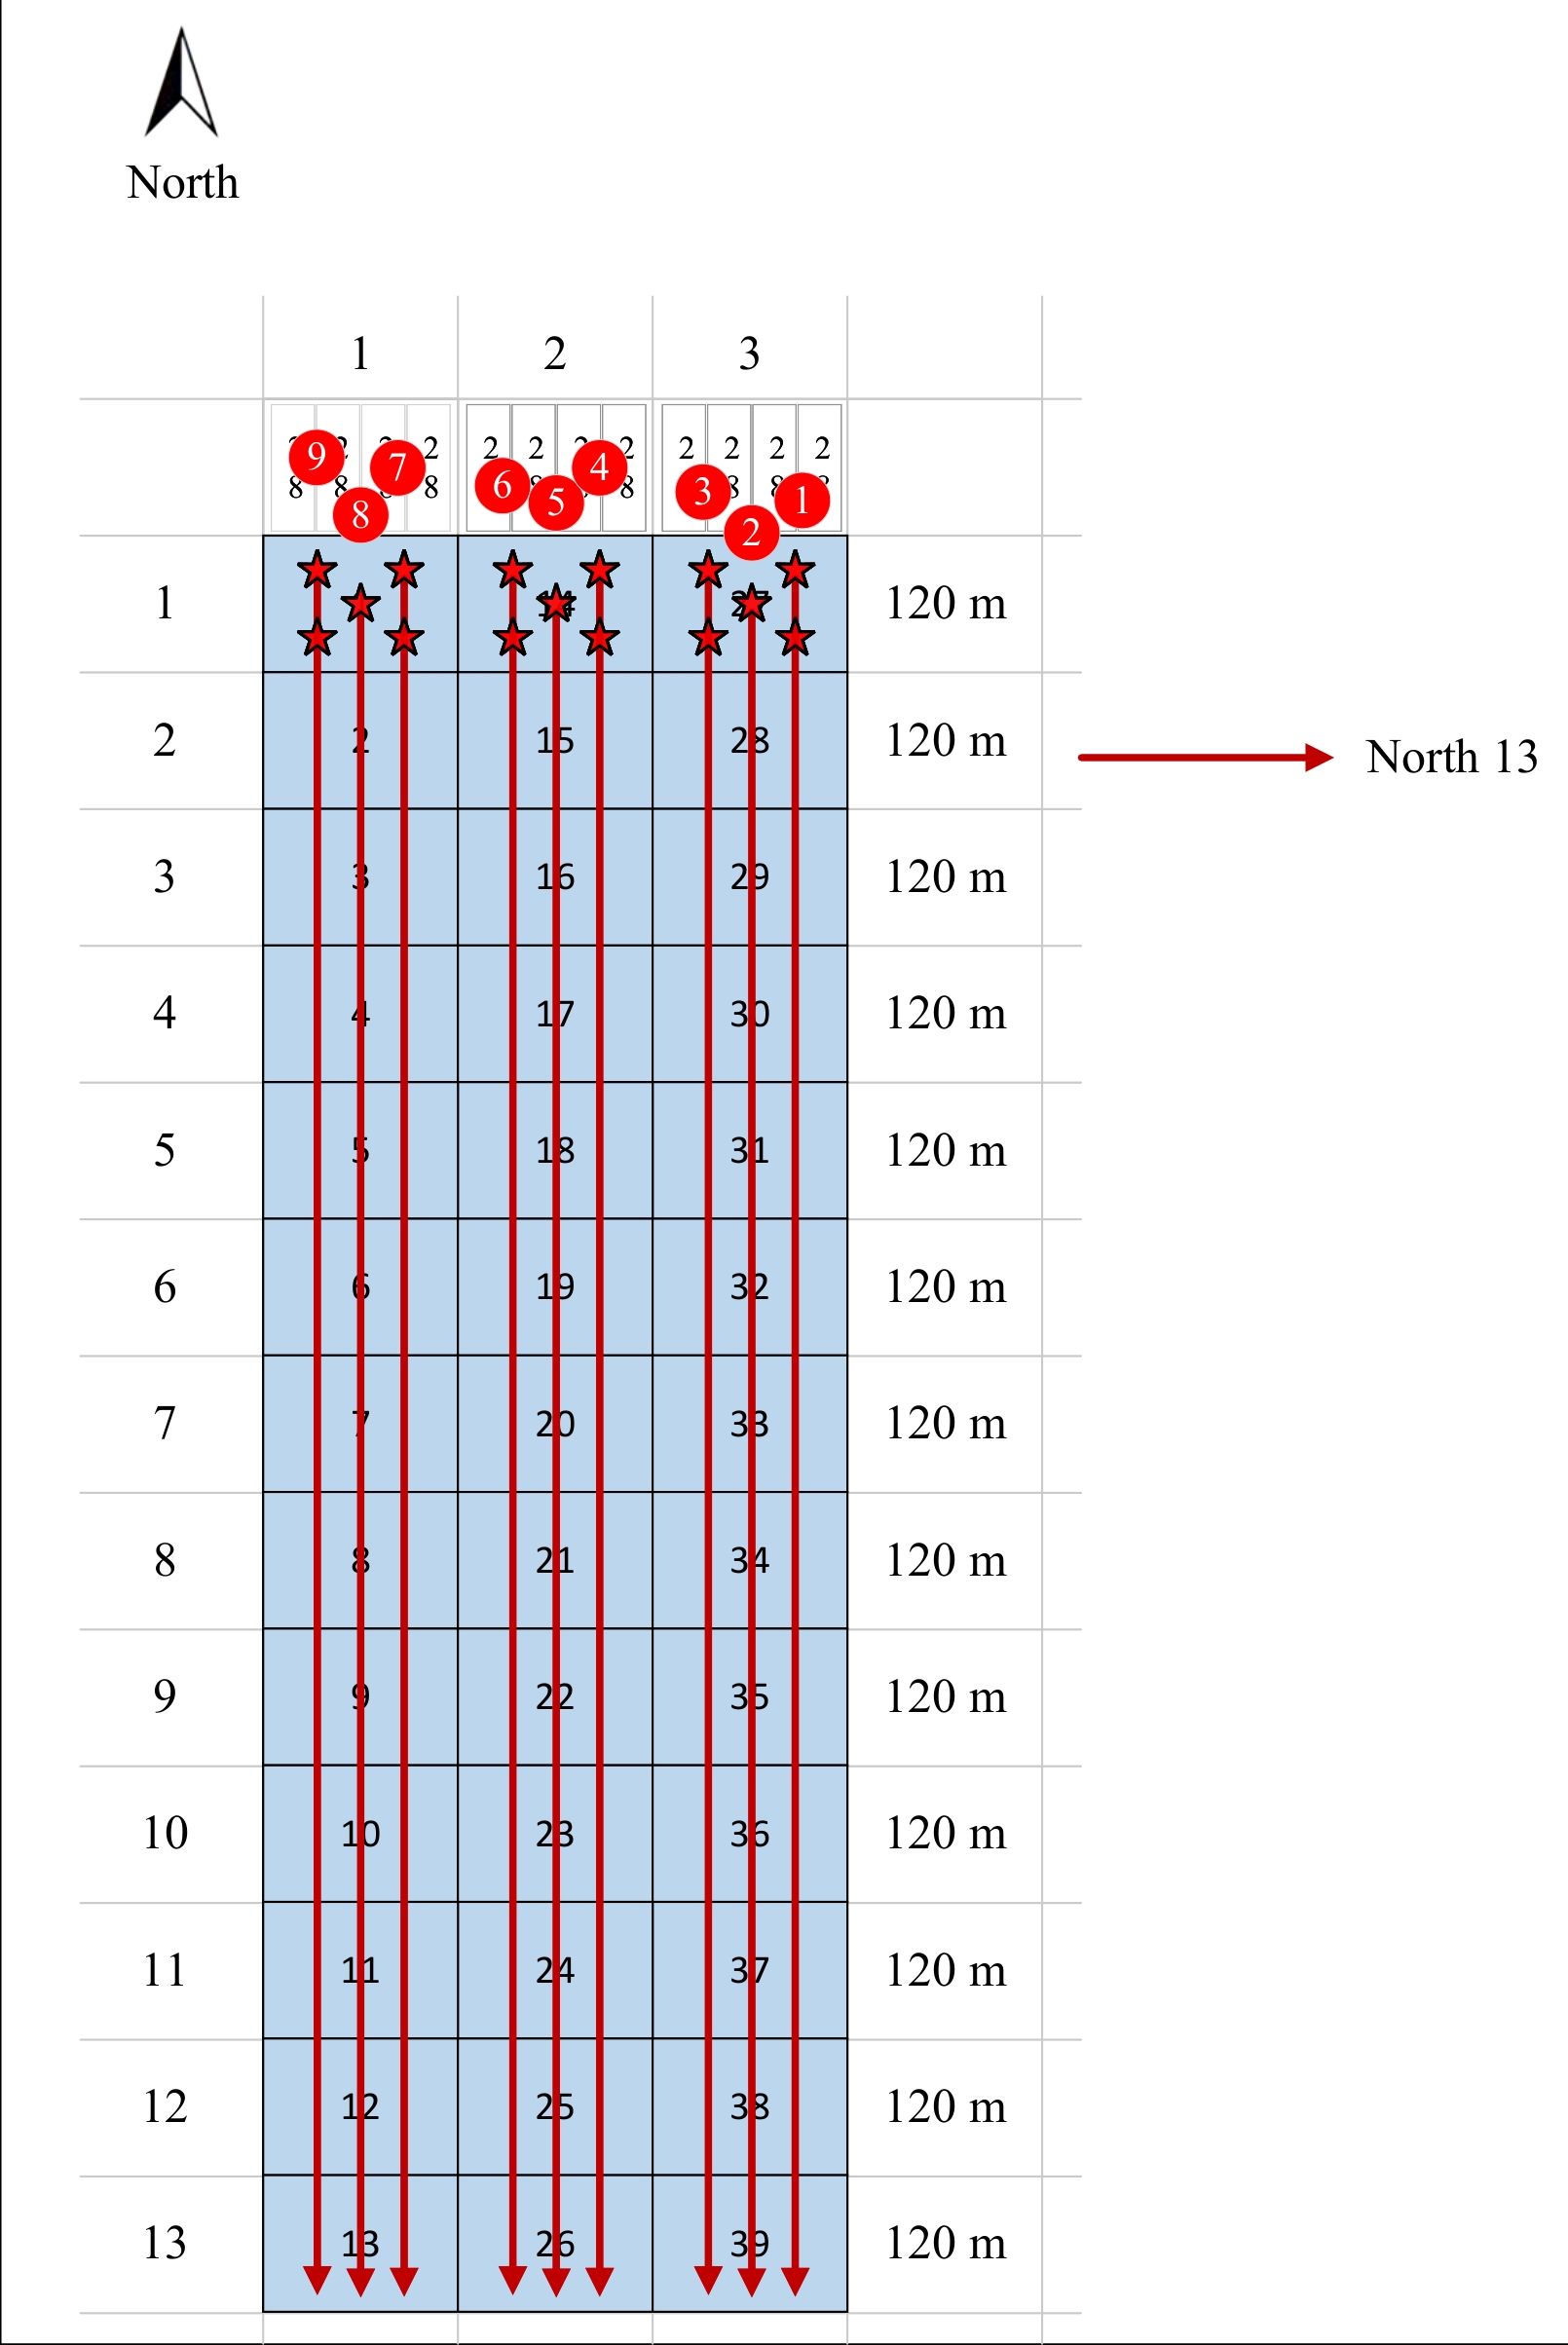
Table 1
Band information of acquired Sentinel-2 imagery
| Band number | Band | Central wavelength/μm | Bandwidth/nm | Spatial resolution/m |
|---|---|---|---|---|
| 1 | Coastal aerosol | 0.443 | 20 | 60 |
| 2 | Blue | 0.490 | 65 | 10 |
| 3 | Green | 0.560 | 35 | 10 |
| 4 | Red | 0.665 | 30 | 10 |
| 5 | Vegetation red edge | 0.705 | 15 | 20 |
| 6 | Vegetation red edge | 0.740 | 15 | 20 |
| 7 | Vegetation red edge | 0.783 | 20 | 20 |
| 8 | Near Infrared | 0.842 | 115 | 10 |
| 8A | Vegetation red edge | 0.865 | 20 | 20 |
| 9 | Water vapour | 0.945 | 20 | 60 |
| 10 | Short-Wave Infrared -Cirrus | 1.375 | 20 | 60 |
| 11 | SWIR | 1.610 | 90 | 20 |
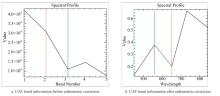
Fig. 2
Comparison of UAV multispectral band information before and after radiometric correction
Table 2
GLCM texture parameters and their physical significance for soybean canopy characterization
| Texture feature parameters | Abbreviation | Central band/μm |
|---|---|---|
| Mean texture | Mean | Describe the brightness and darkness of an image |
| Homogeneity texture | Hom | Evaluate the local grayscale uniformity of the image |
| Dissimilarity texture | Dis | Characterize the differences in texture features between pixels |
| Entropy texture | Ent | Indicate the size of the amount of information |
| Second Moment texture | Sm | Describe the uniformity and thickness of texture features |
| Correlation texture | Corr | Predict the main trend of texture |
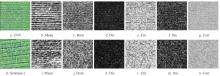
Fig. 3
Spatial distribution of GLCM texture features extracted from Sentinel-2 and UAV imagery during a typical soybean growth stage
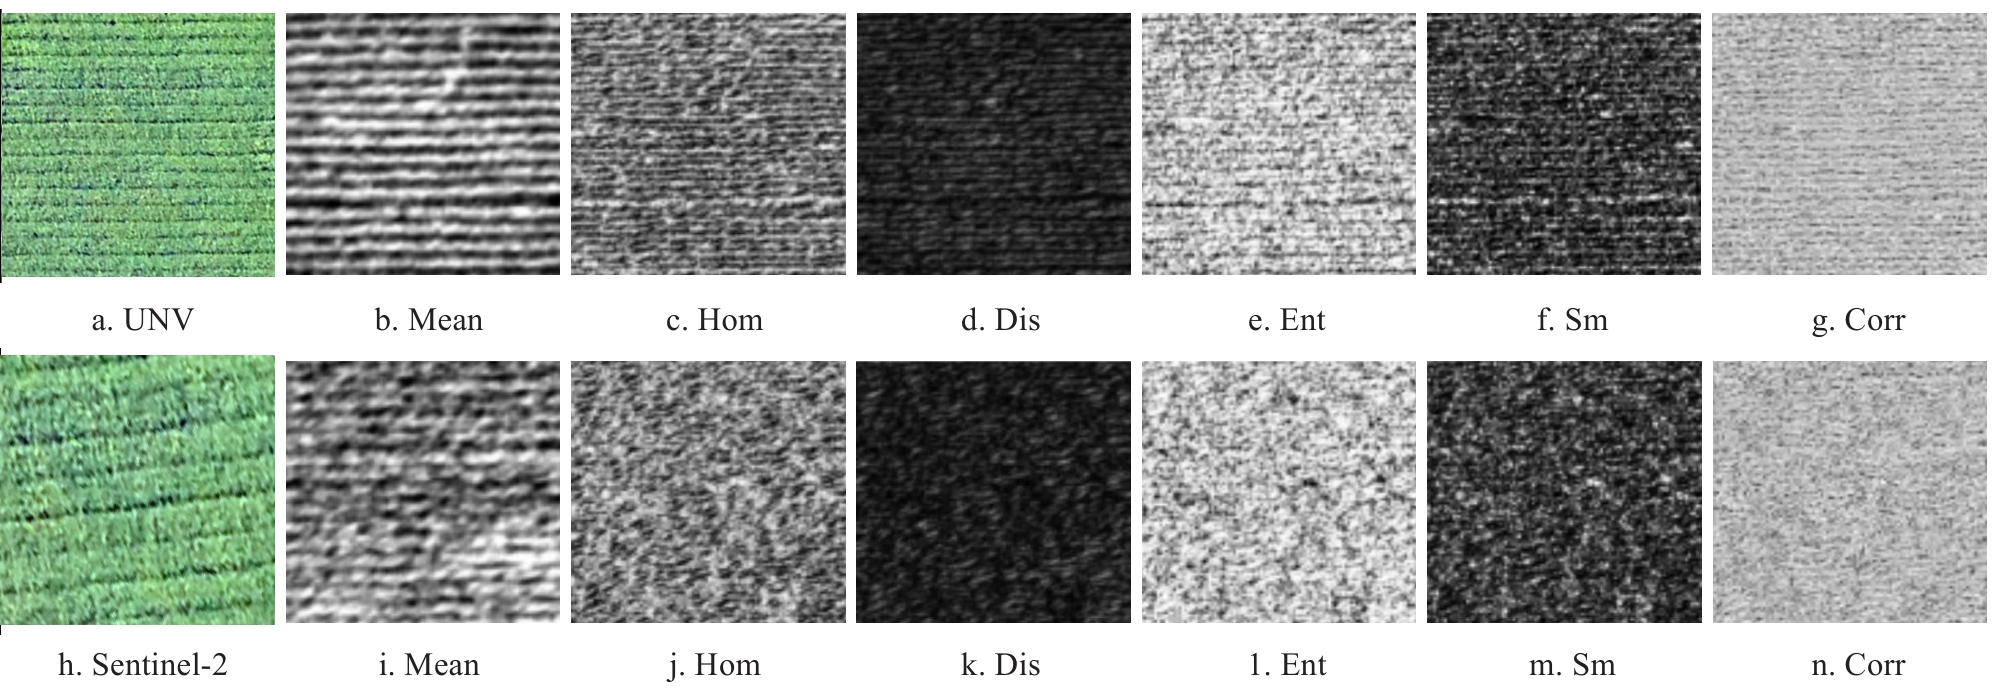
Fig. 4
Diagram of the gate units in an LSTM network

Fig. 5
Diagram of the gate units in the GRU network
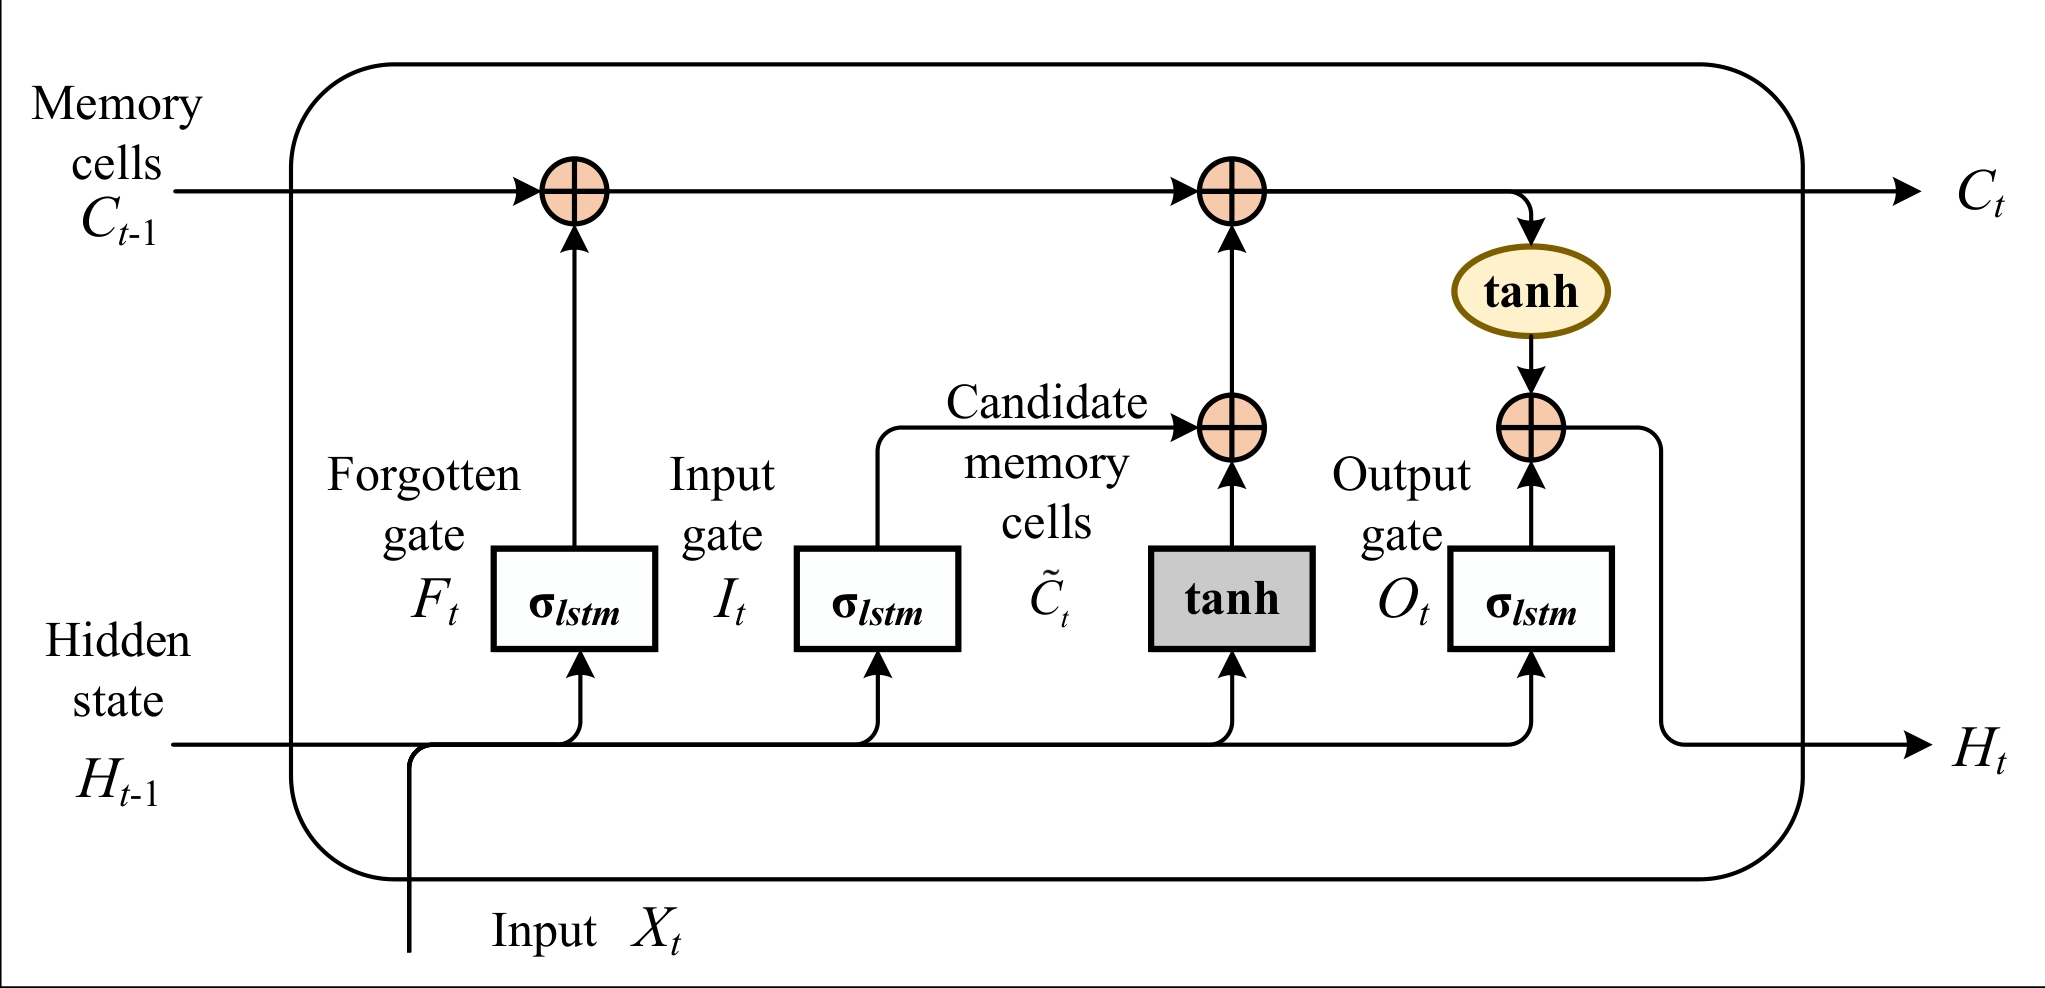
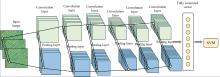
Fig. 6
SVM-CNN model structure diagram
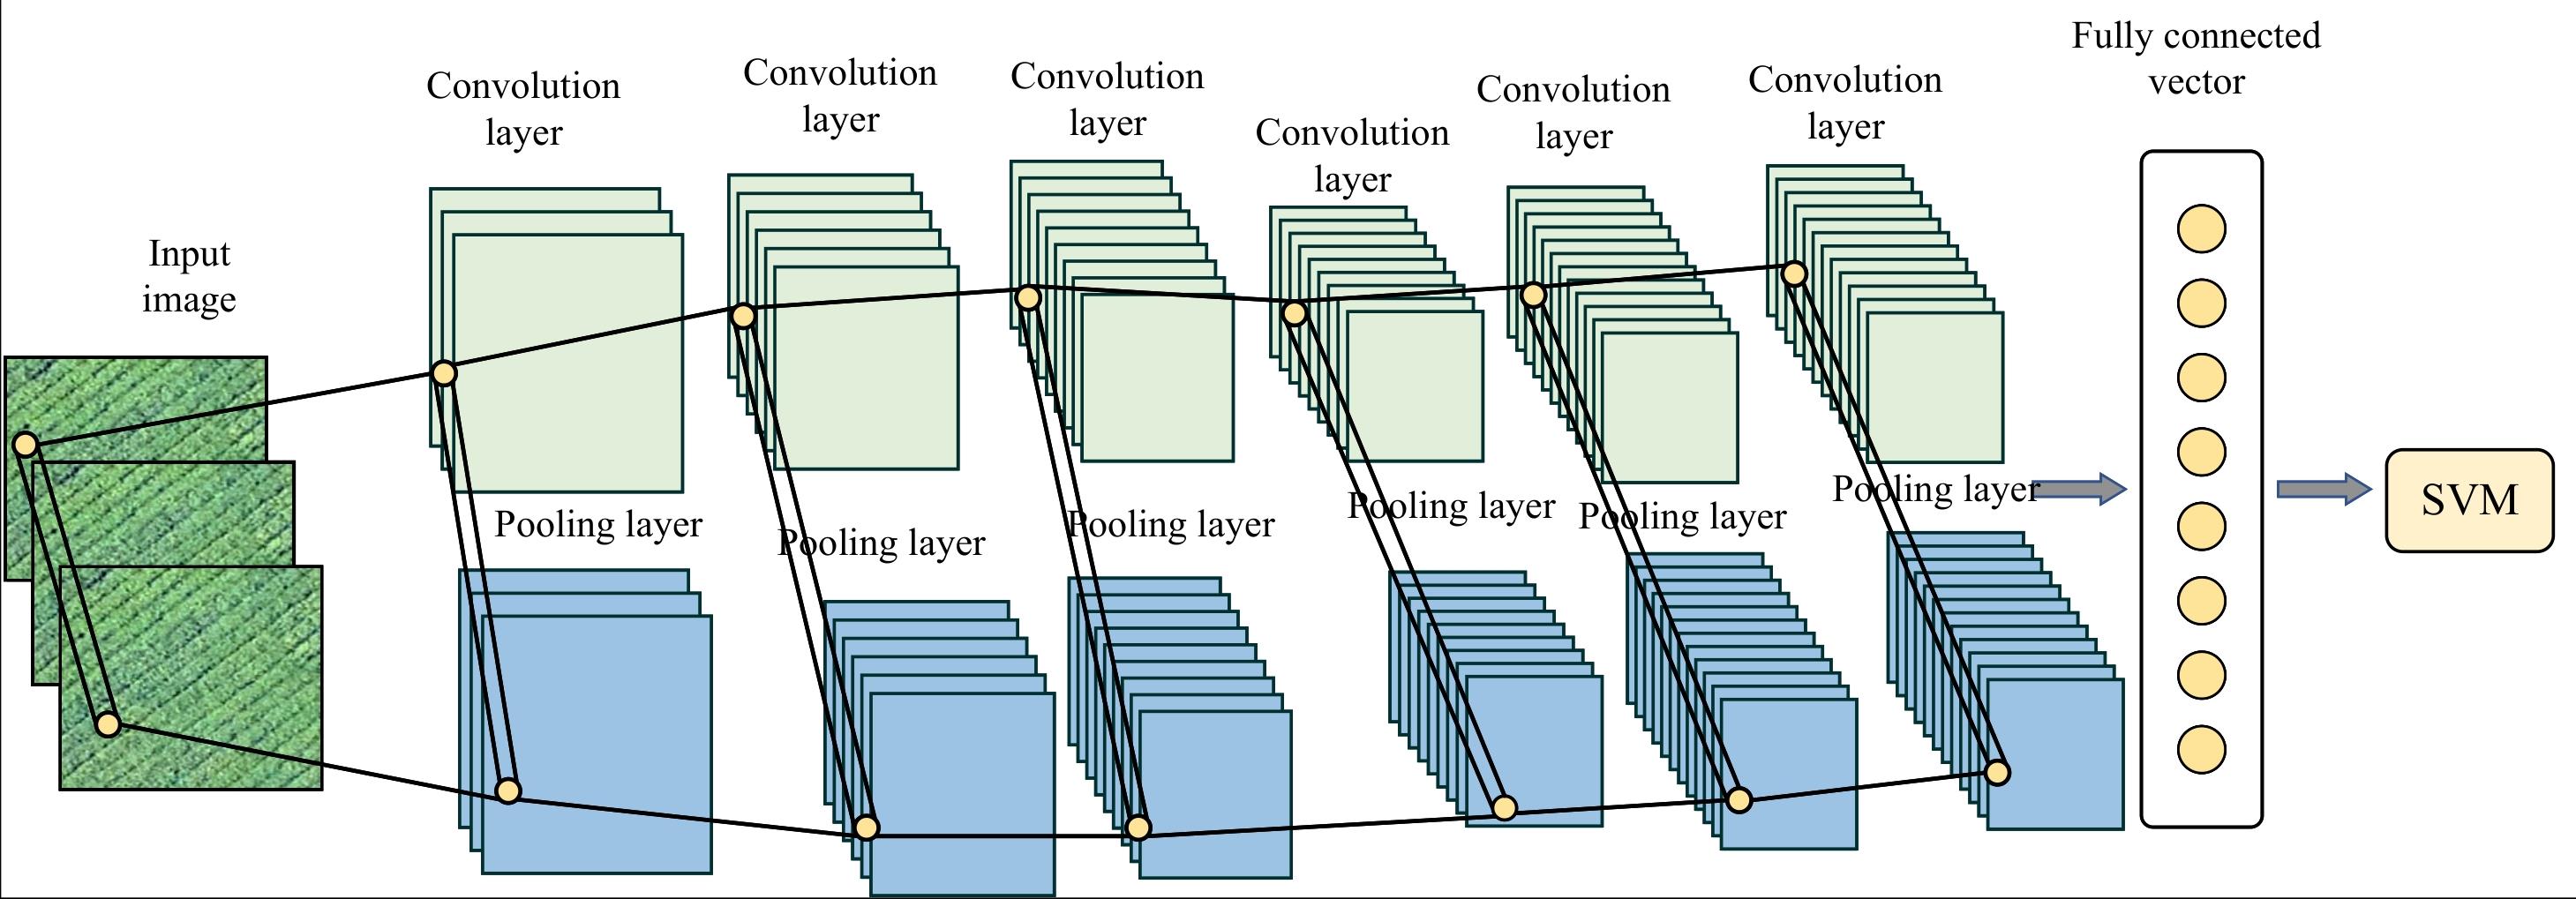
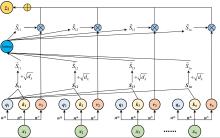
Fig. 7
Calculation process of the self-attention mechanism module
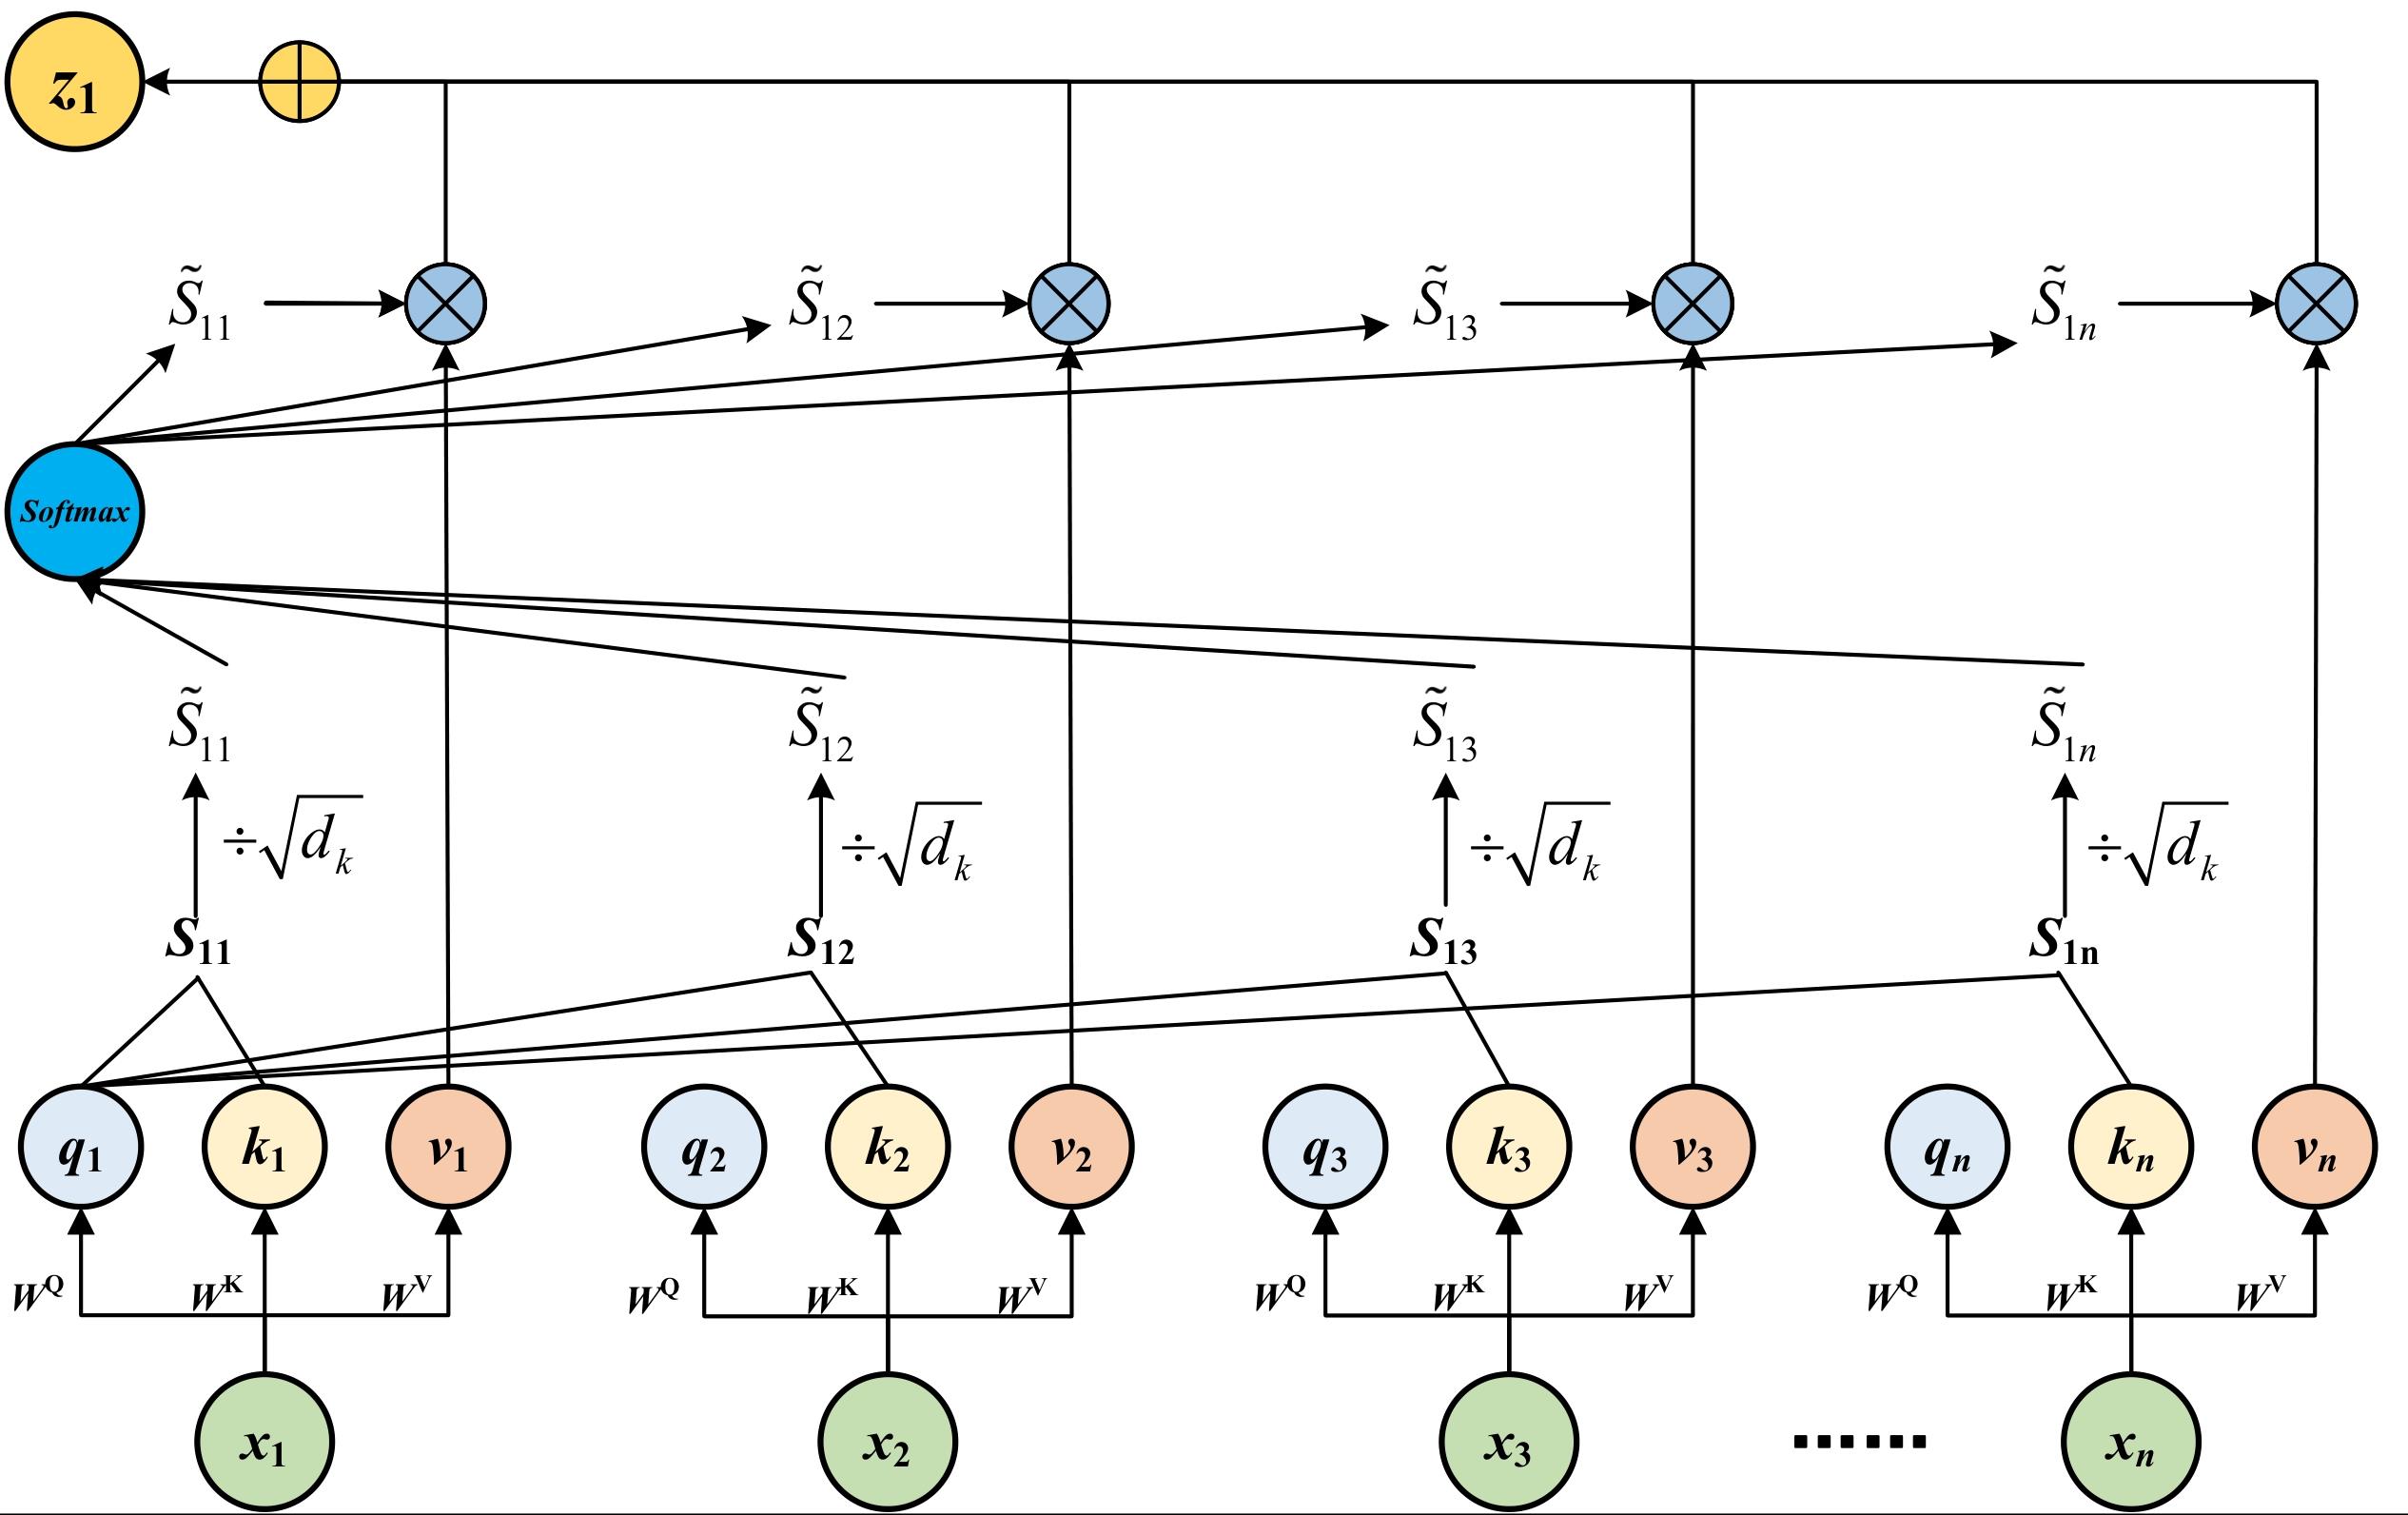
Fig. 8
Schematic diagram of the squeeze-and-excitation (SE) attention mechanism module
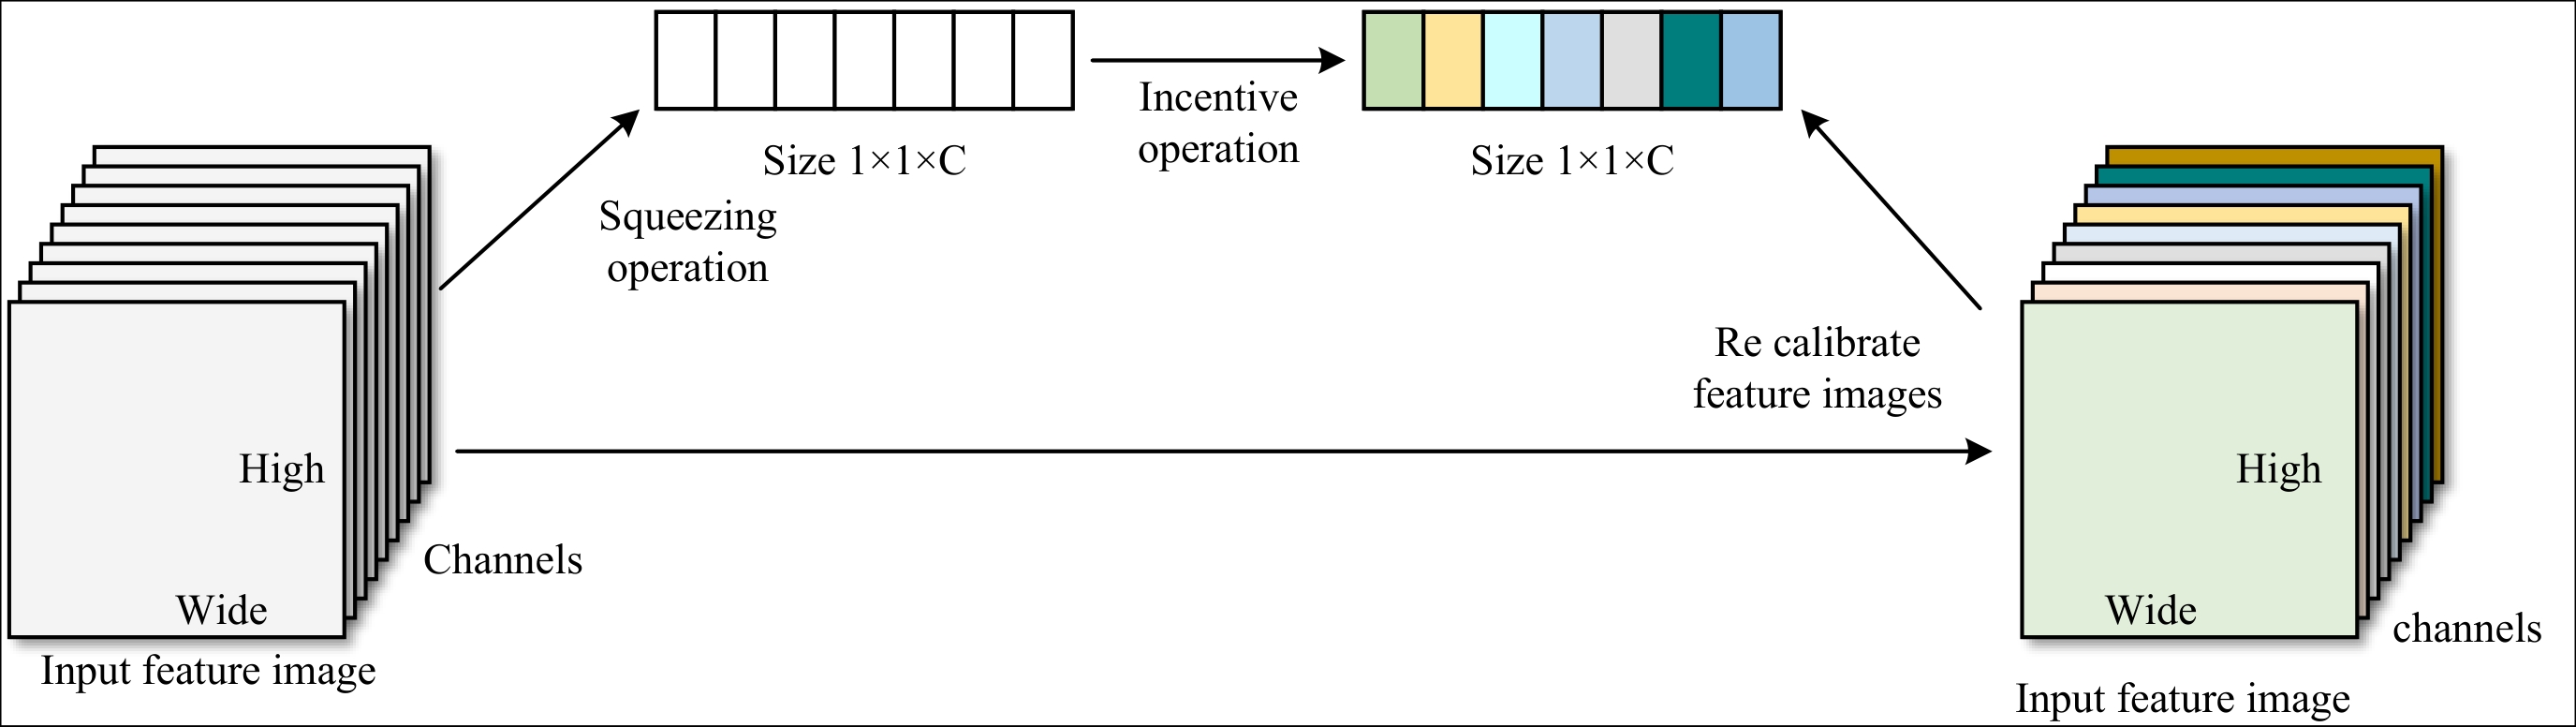
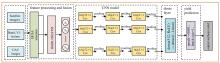
Fig. 9
Structure of CNN-GRU/LSTM-Attention model
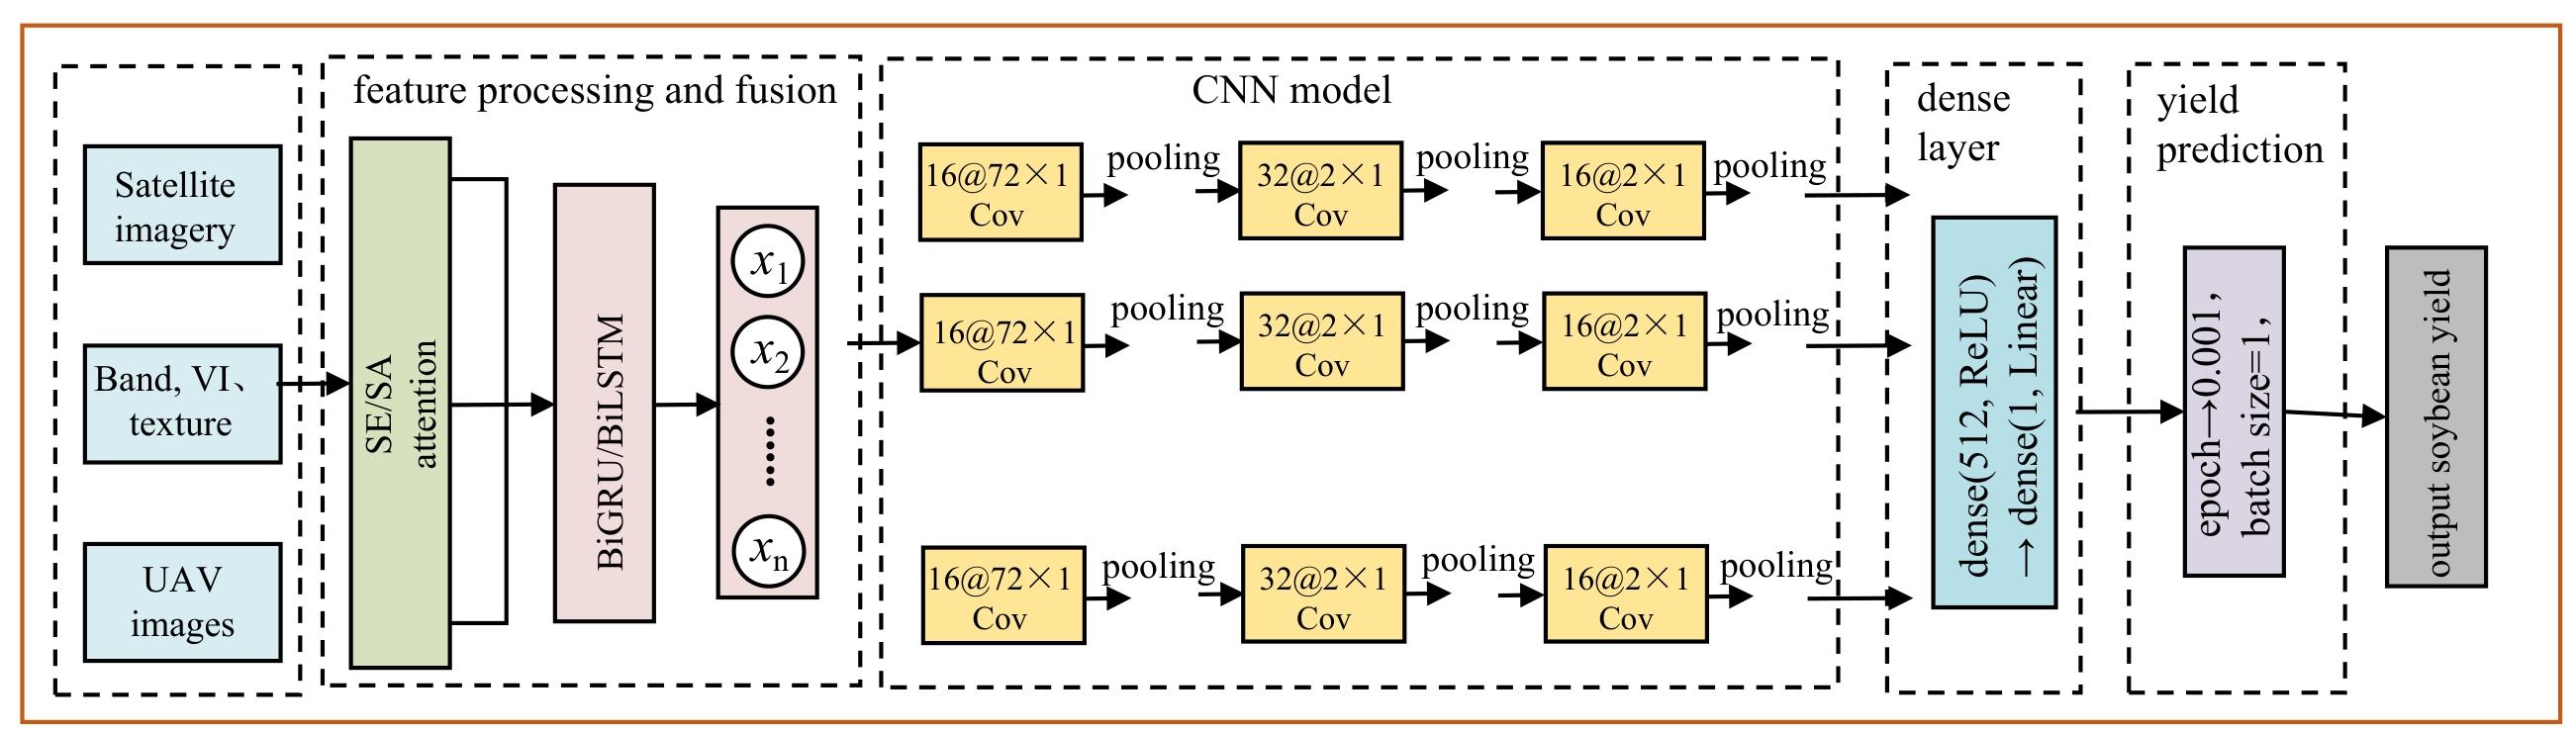
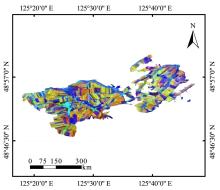
Fig. 10
Multi-feature time-series imagery of Sentinel-2 for the full months of 2022 at Jianshan Farm, Heilongjiang province
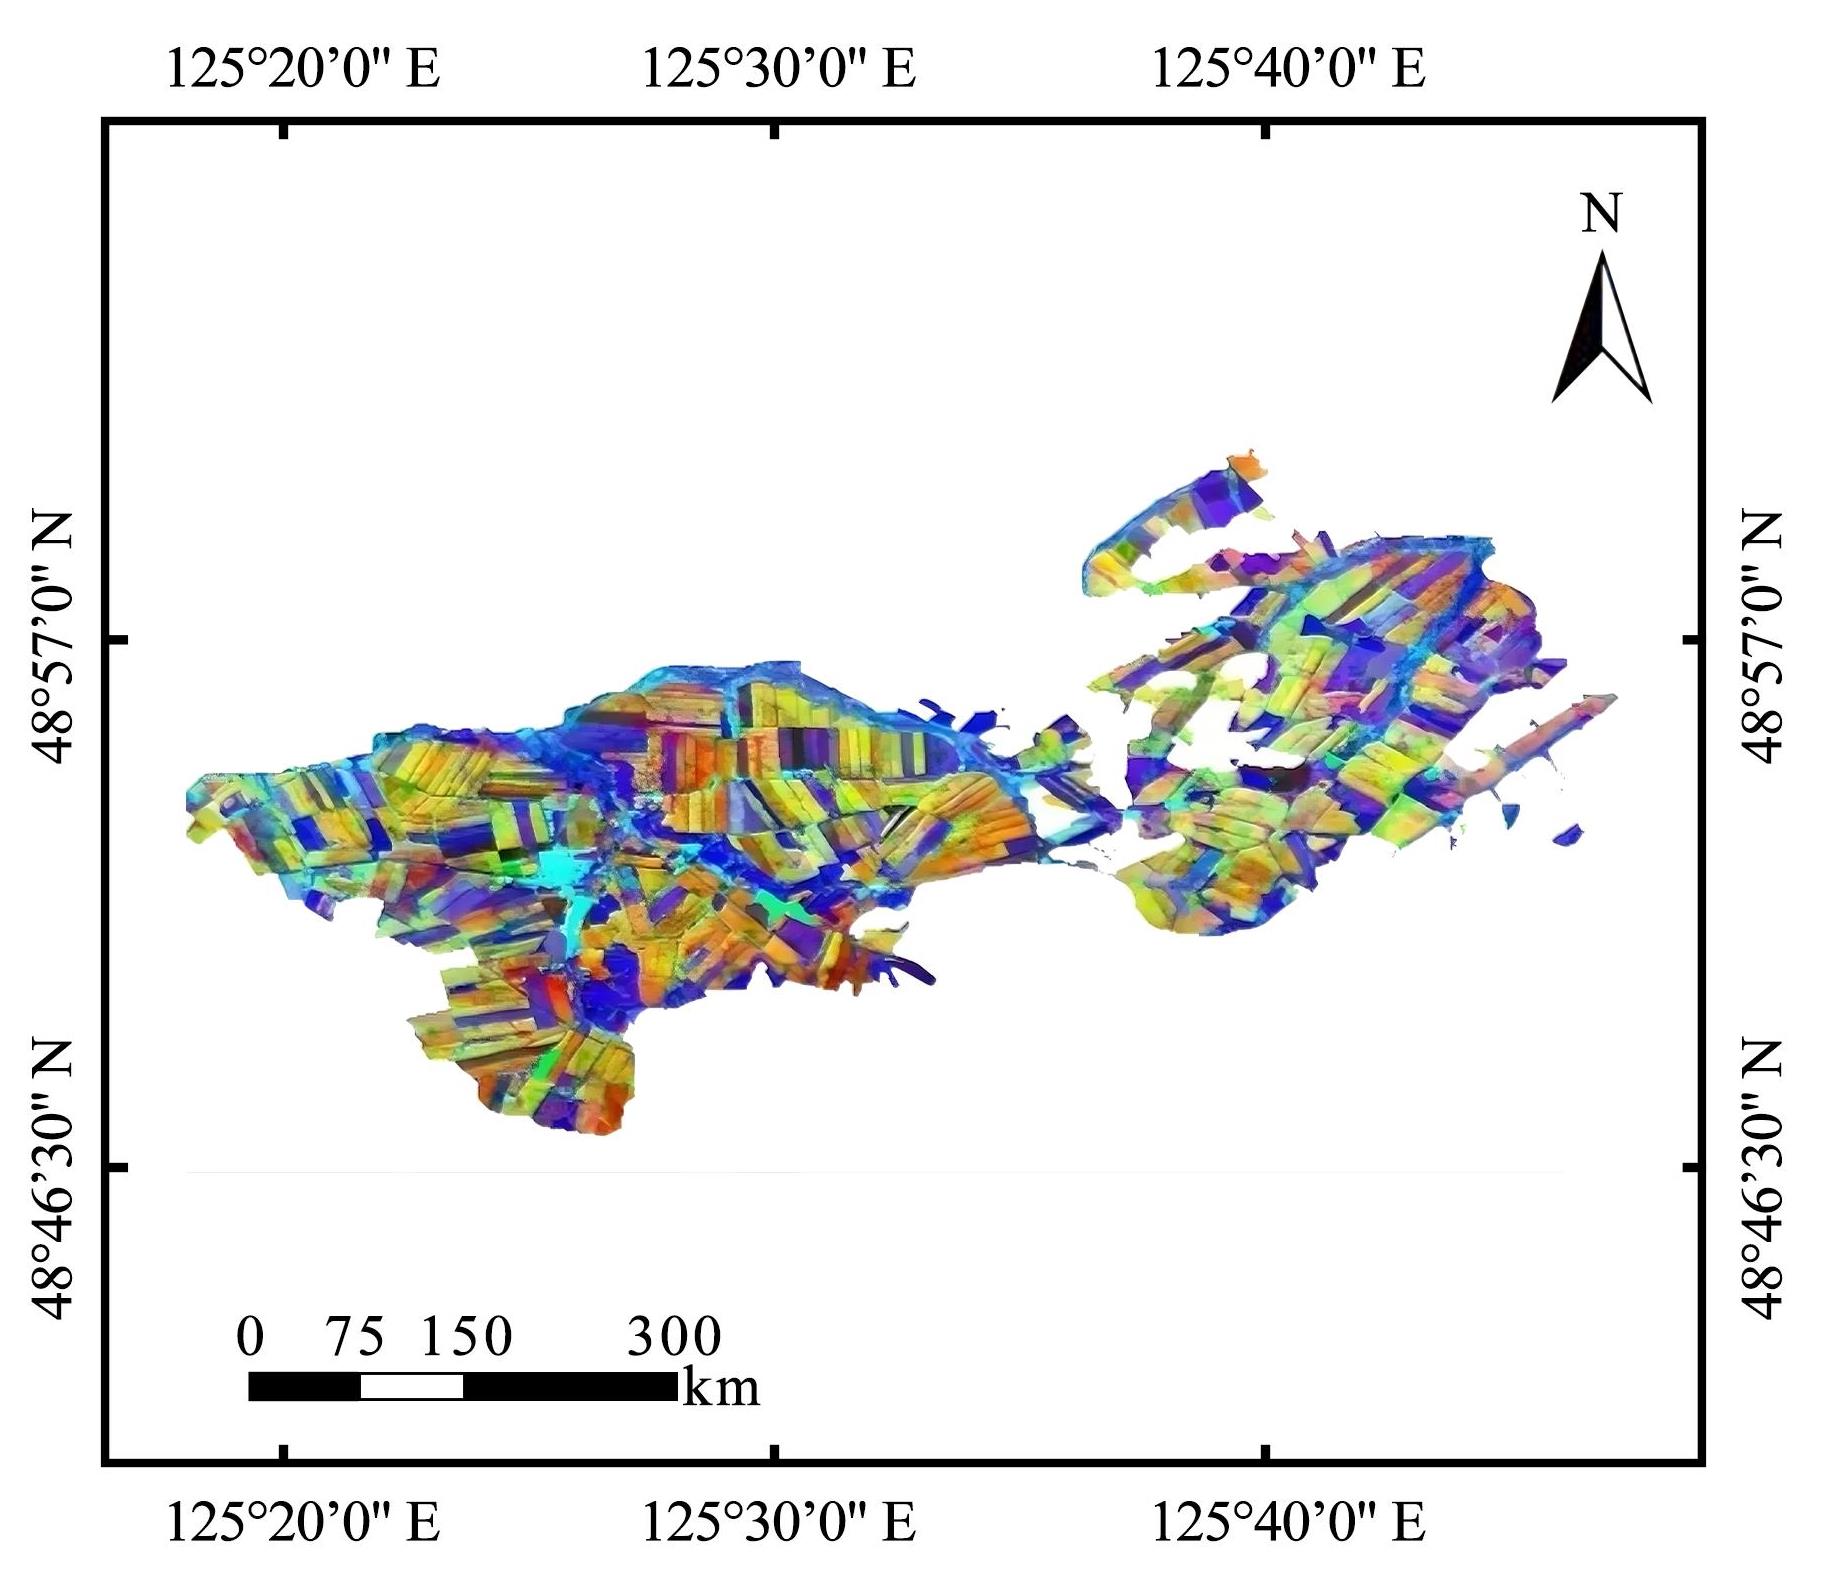
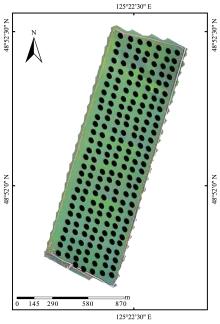
Fig. 11
Sampling point extraction scheme based on ArcGIS at Jianshan Farm
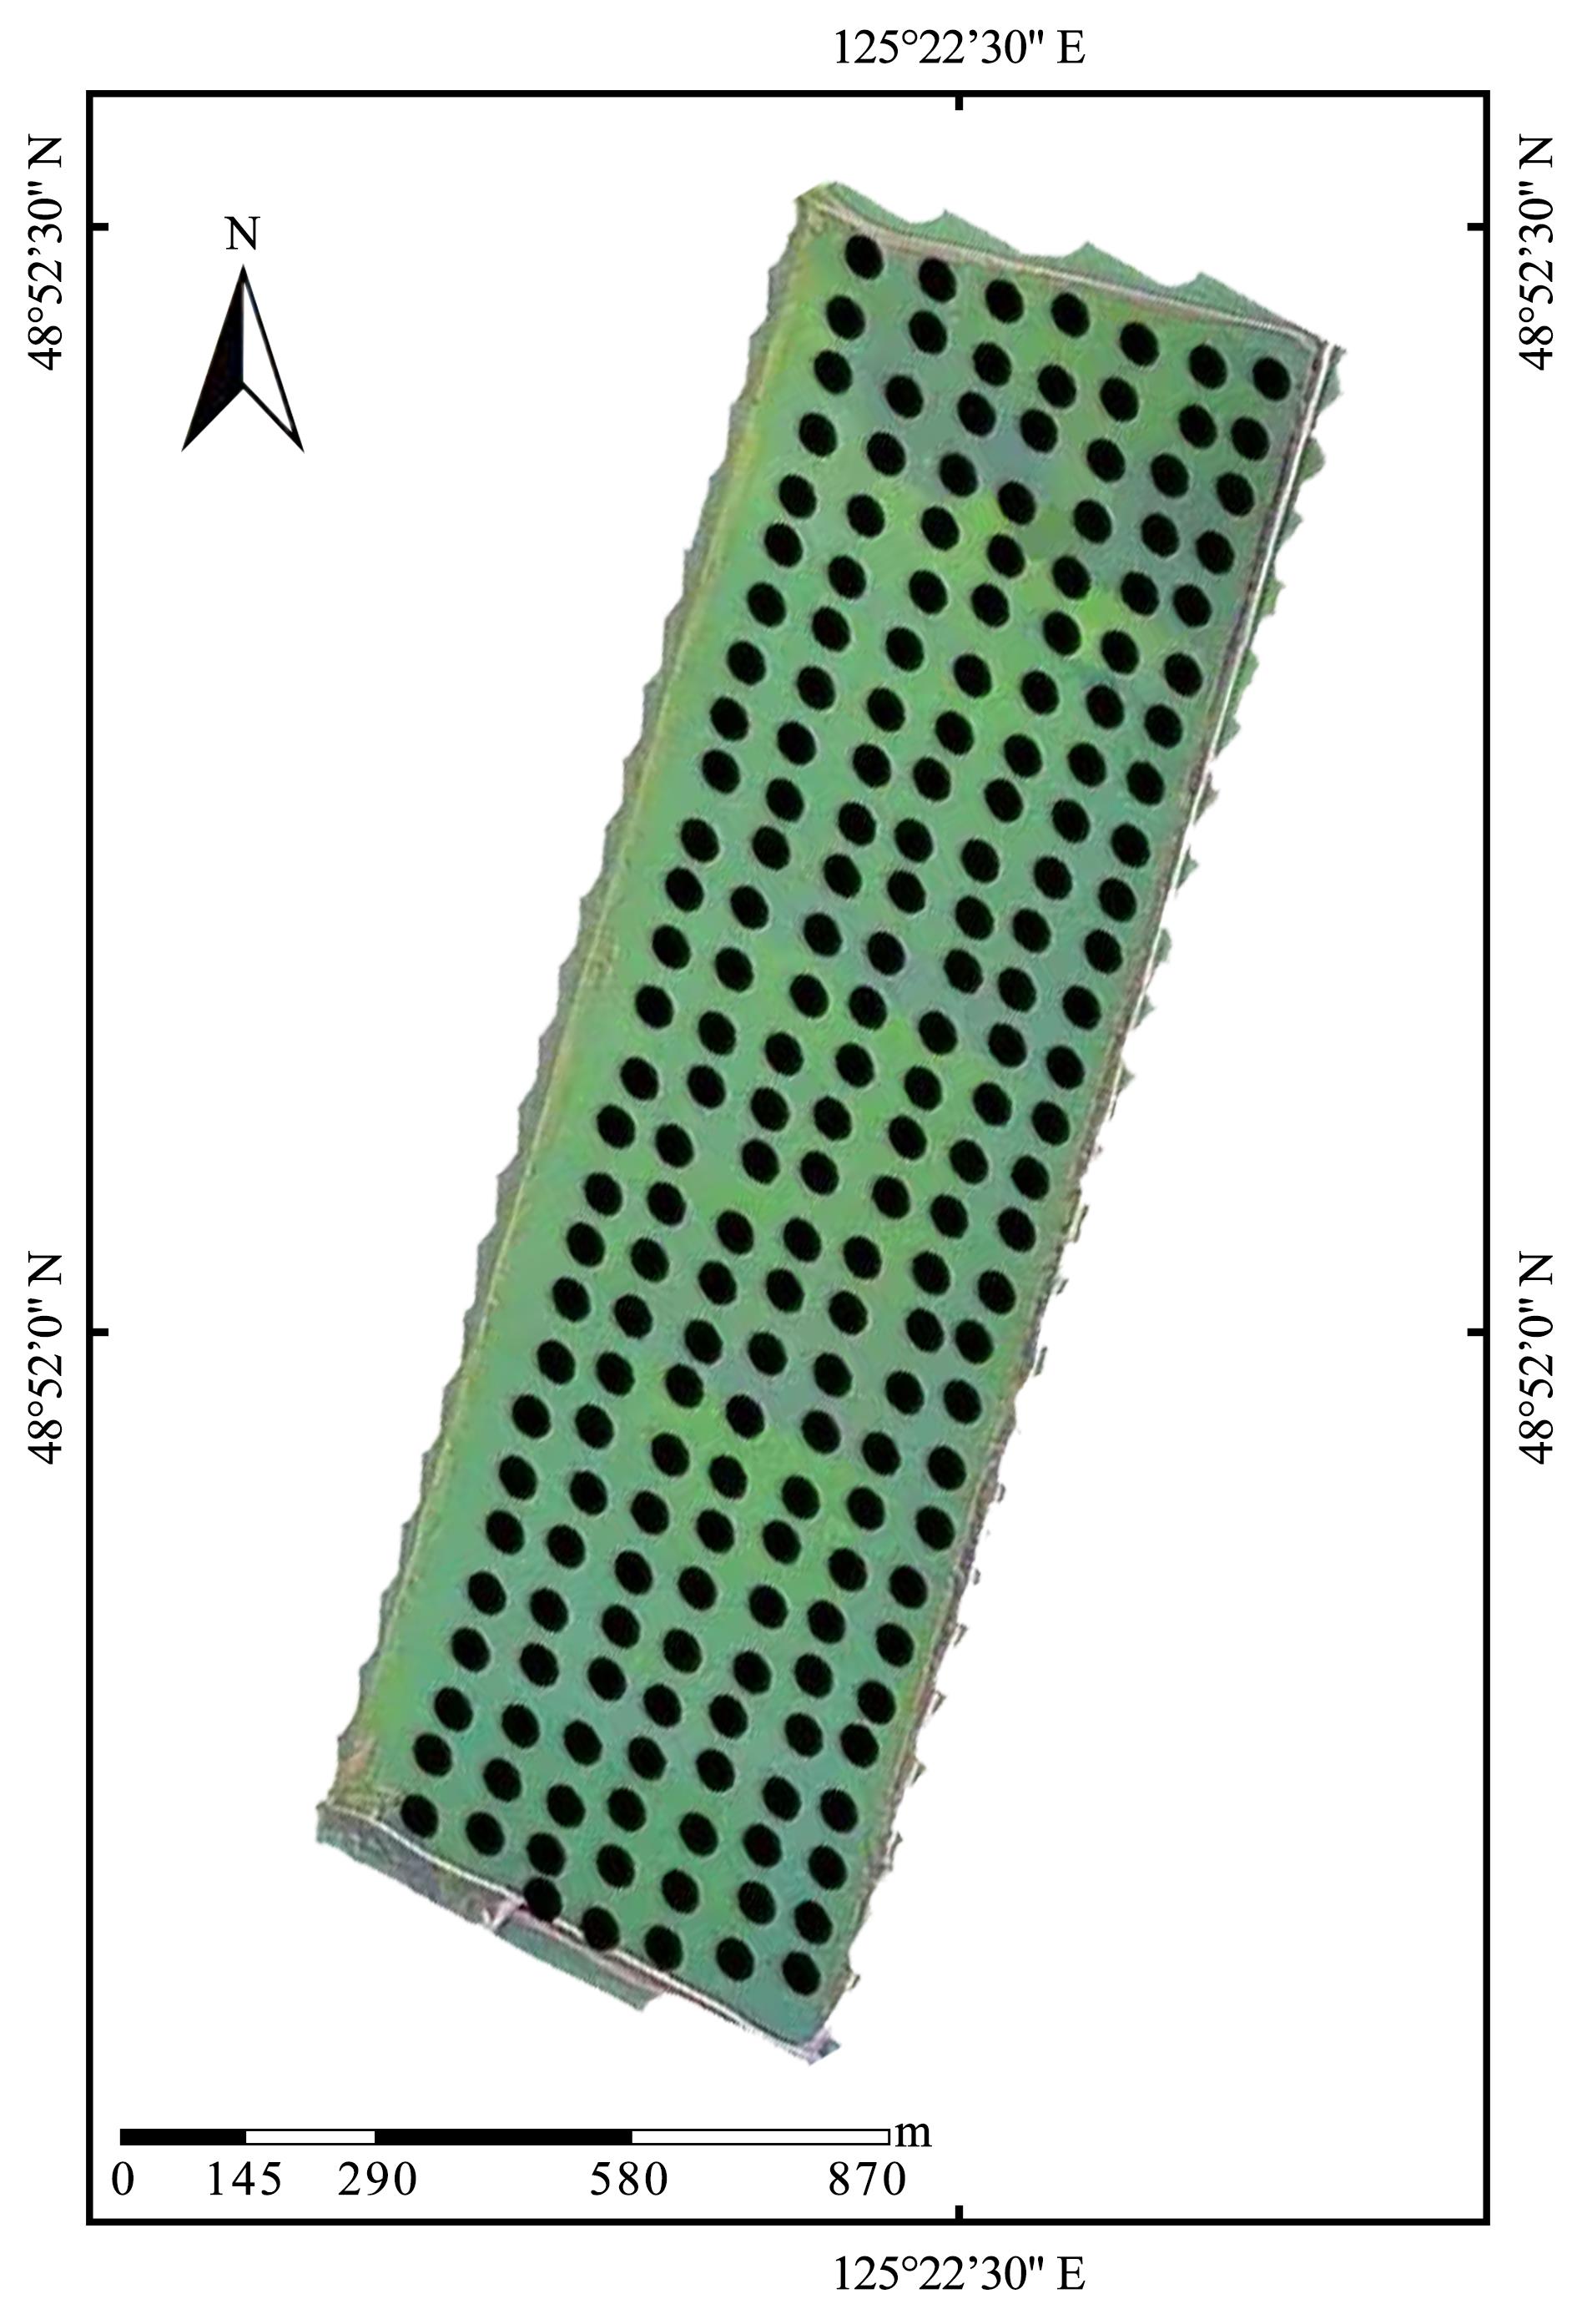

Fig. 12
Feature distribution alignment results of UAV and Sentinel-2 data using TCA algorithm a. UAV source domain feature distribution b. Sentinel-2 target domain feature distribution
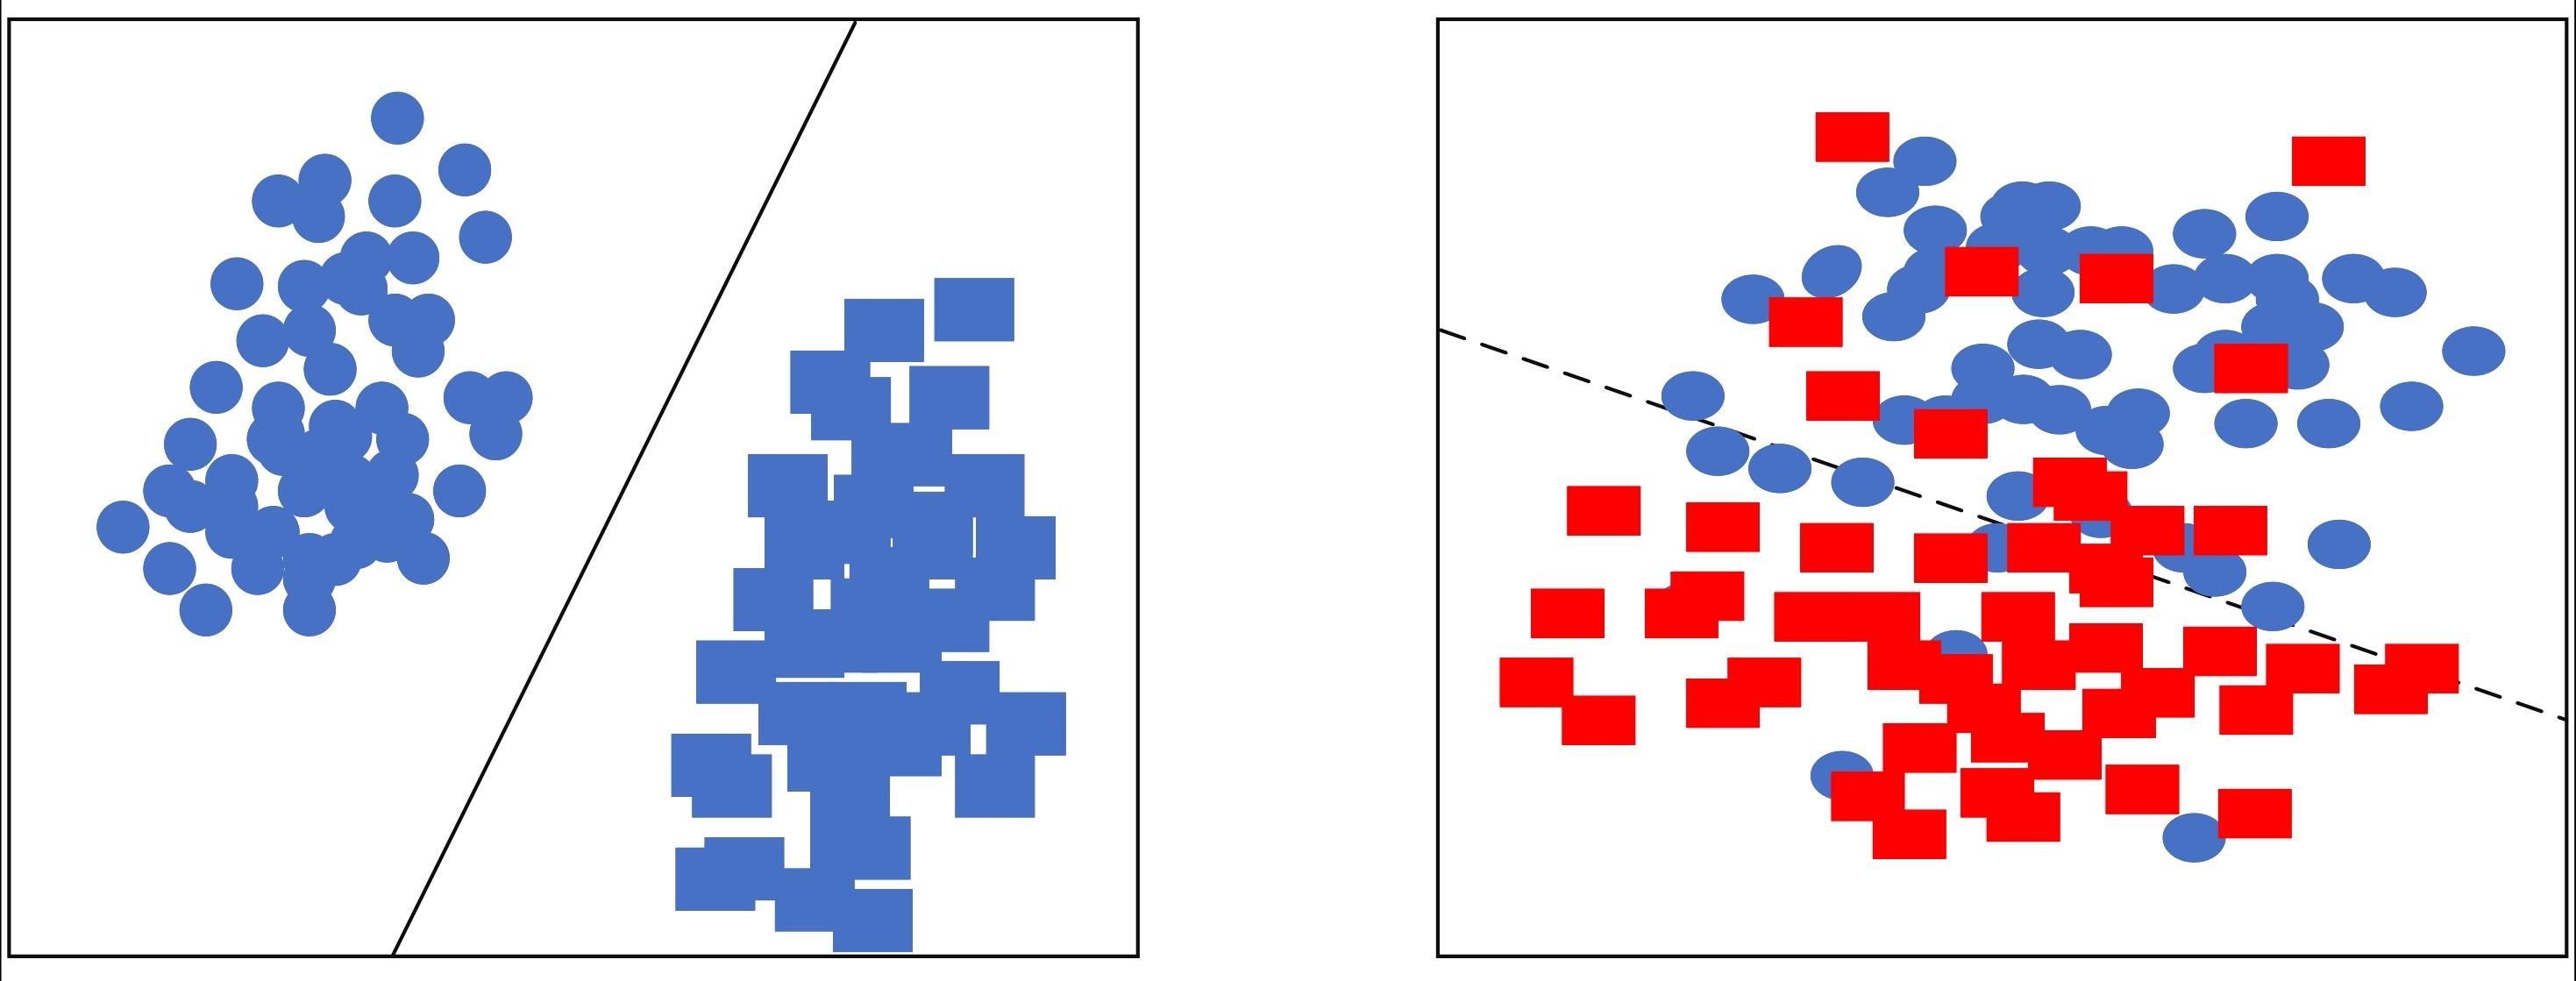

Fig. 13
Sliding time window processing for LSTM/GRU sequential feature fusion
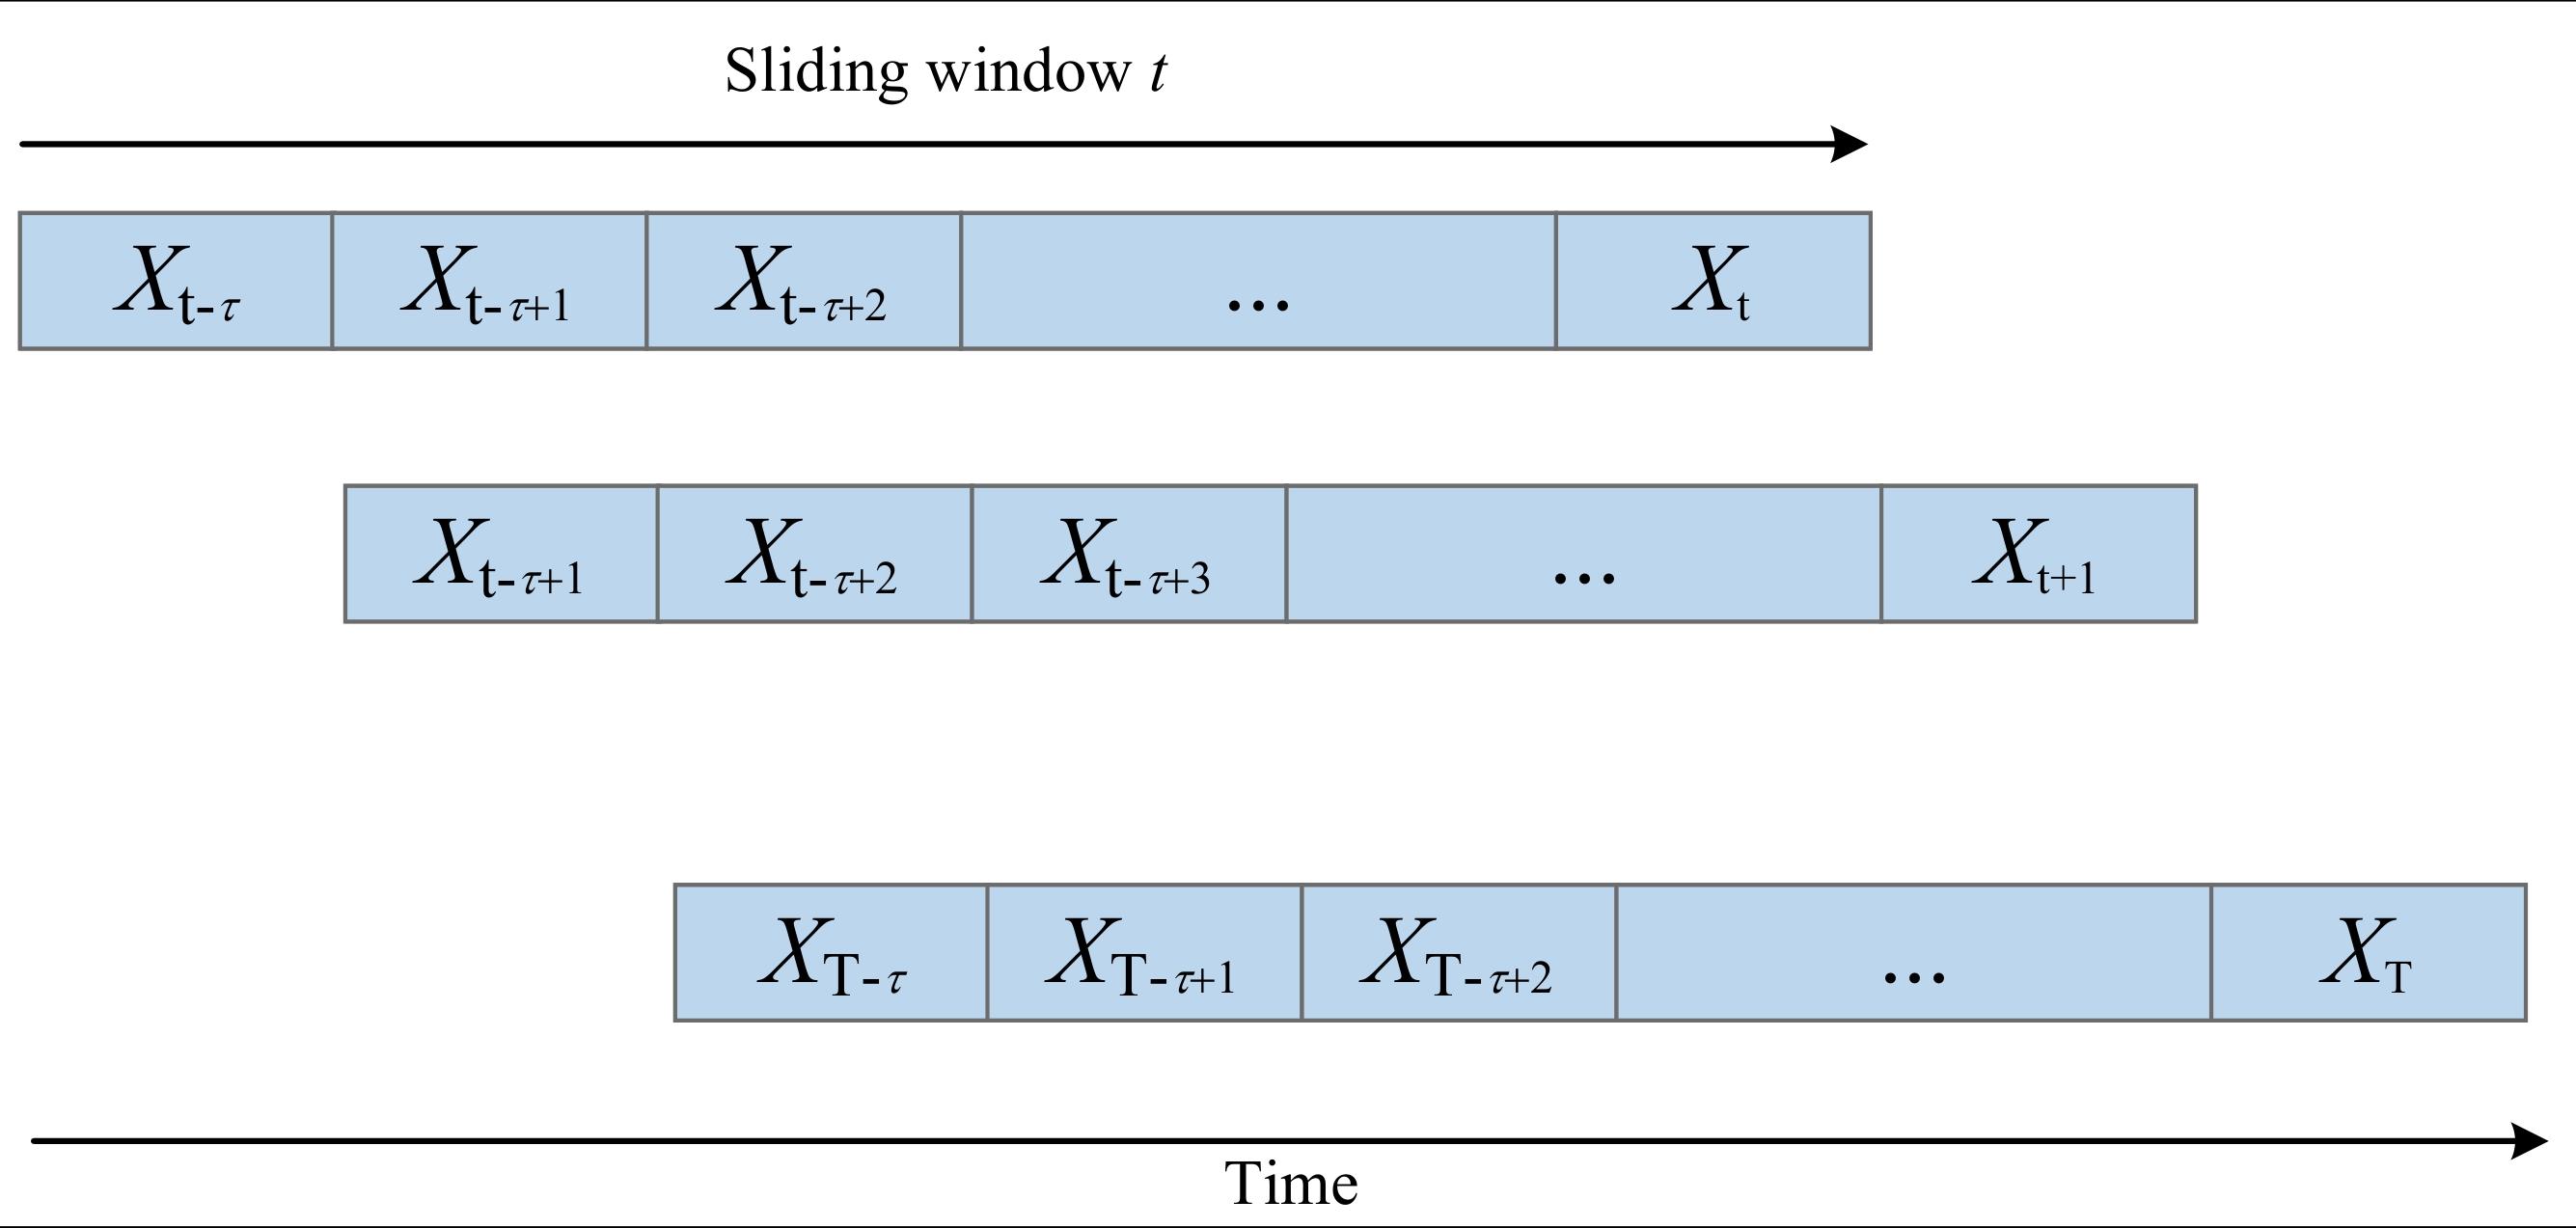
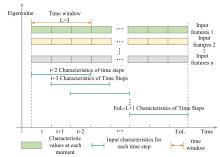
Fig. 14
LSTM/GRU feature fusion process for UAV-Sentinel-2 multi-source data
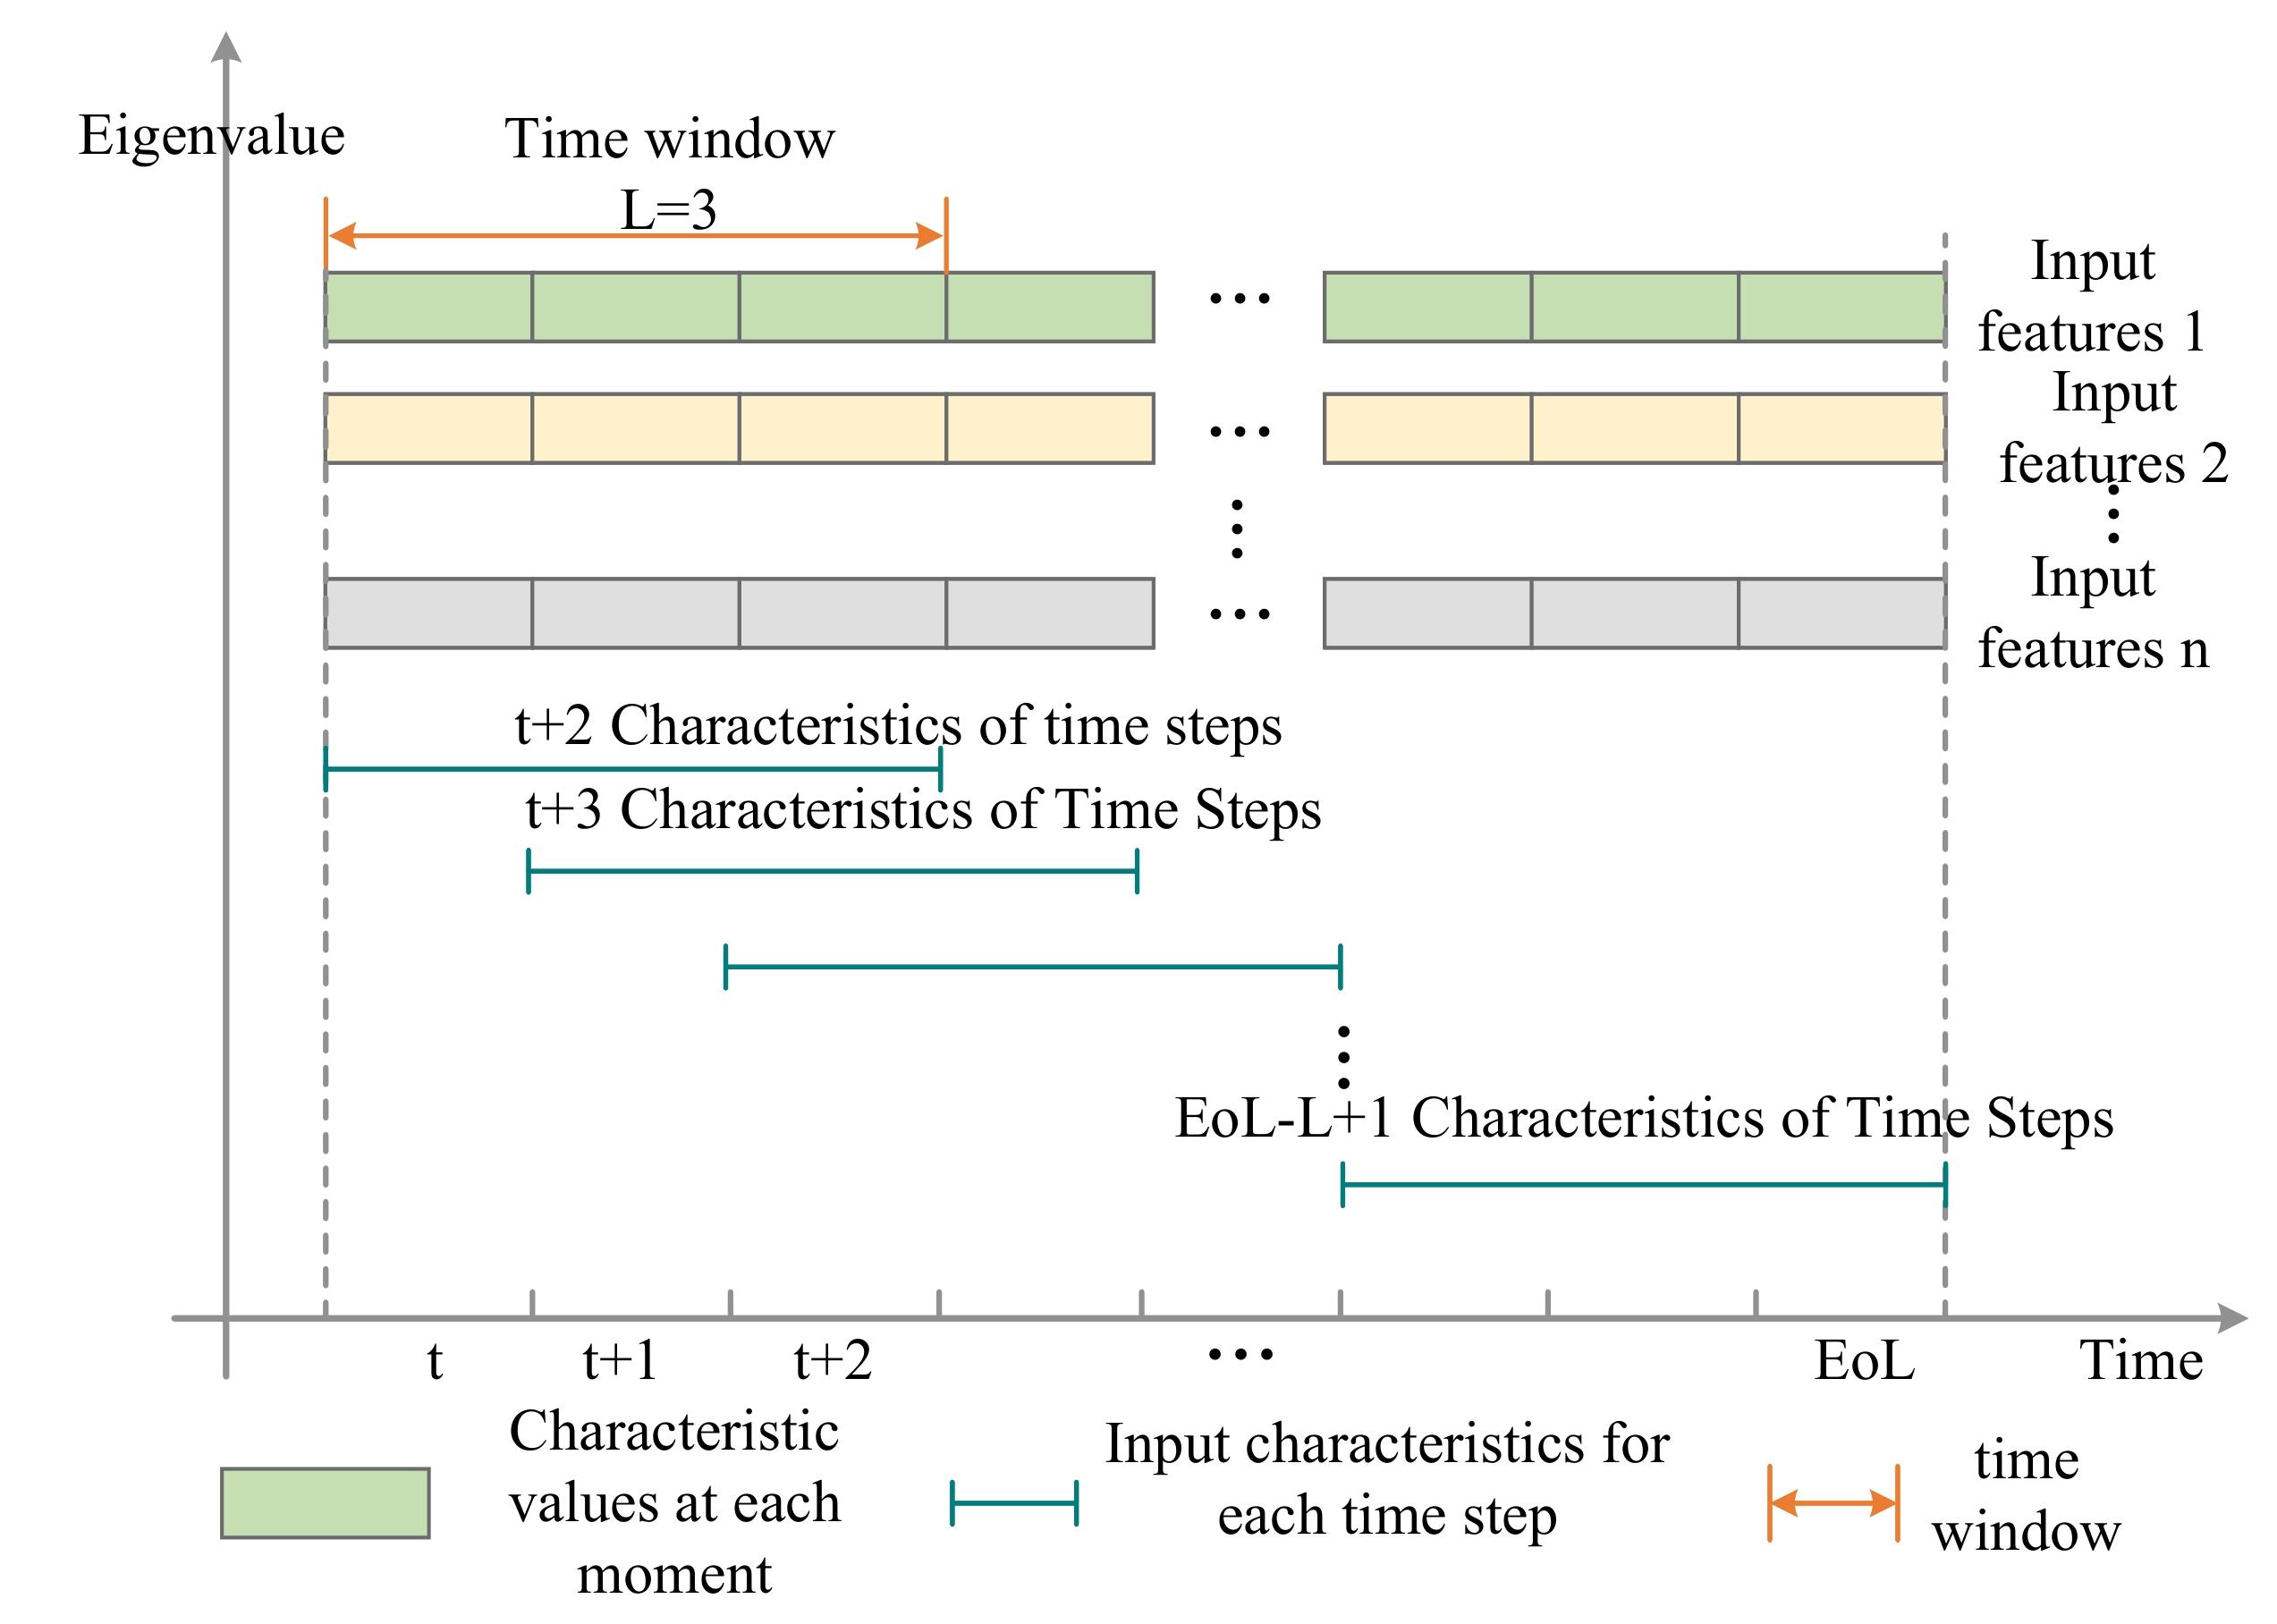
Table 3
Performance comparison of CNN yield estimation models using half-monthly and monthly multi-feature time-series data
| Model | MAE/(kg/hm2) | RMSE/(kg/hm2) | MAPE | R 2 |
|---|---|---|---|---|
| CNN-UAV-15 | 22.294 1 | 30.850 5 | 0.106 6 | 0.39 |
| CNN-Sentinel-15 | 26.461 6 | 32.930 7 | 0.111 6 | 0.32 |
| CNN-US-15 | 21.827 5 | 28.974 6 | 0.095 7 | 0.44 |
| CNN-UAV-30 | 24.895 8 | 31.450 9 | 0.105 8 | 0.37 |
| CNN-Sentinel-30 | 27.005 5 | 34.359 5 | 0.120 5 | 0.21 |
| CNN-US-30 | 22.177 5 | 29.737 7 | 0.096 8 | 0.40 |
Table 4
Performance comparison of CNN models with different fusion methods for half-monthly and monthly time-series data
| Model | MAE/(kg/hm2) | RMSE/(kg/hm2) | MAPE | R 2 |
|---|---|---|---|---|
| CNN-US-15 | 21.827 5 | 28.974 6 | 0.095 7 | 0.44 |
| CNN-TCA-15 | 15.172 2 | 18.633 1 | 0.064 3 | 0.88 |
| CNN-GRU-15 | 12.526 8 | 17.254 5 | 0.055 5 | 0.90 |
| CNN-LSTM-15 | 10.093 1 | 14.137 4 | 0.045 0 | 0.93 |
| CNN-US-30 | 22.177 5 | 29.737 7 | 0.096 8 | 0.40 |
| CNN-TCA-30 | 21.568 8 | 27.953 3 | 0.092 6 | 0.71 |
| CNN-GRU-30 | 19.322 2 | 26.188 7 | 0.083 2 | 0.79 |
| CNN-LSTM-30 | 18.030 7 | 25.131 2 | 0.080 7 | 0.80 |
Table 5
Performance of improved CNN models with different fusion methods for half-monthly time-series data
| Model | MAE/(kg/hm2) | RMSE/(kg/hm2) | MAPE | R 2 |
|---|---|---|---|---|
| SVM-US-CNN | 42.304 6 | 55.776 7 | 0.191 5 | 0.38 |
| SVM-TCA-CNN | 35.184 3 | 45.623 3 | 0.168 3 | 0.66 |
| SVM-GRU-CNN | 31.577 1 | 38.886 2 | 0.153 2 | 0.73 |
| SVM-LSTM-CNN | 26.336 9 | 32.266 6 | 0.132 6 | 0.80 |
| SA-US-CNN | 10.730 5 | 14.740 8 | 0.050 4 | 0.85 |
| SA-TCA-CNN | 9.488 0 | 13.941 9 | 0.048 9 | 0.87 |
| SA-GRU-CNN | 8.403 8 | 12.283 8 | 0.037 8 | 0.94 |
| SA-LSTM-CNN | 10.219 8 | 14.569 3 | 0.0454 | 0.91 |
| SE-US-CNN | 14.983 6 | 12.230 6 | 0.104 2 | 0.70 |
| SE-TCA-CNN | 11.693 5 | 13.983 2 | 0.0963 | 0.71 |
| SE-GRU-CNN | 11.707 1 | 12.191 7 | 0.053 0 | 0.90 |
| SE-LSTM-CNN | 8.520 9 | 12.609 2 | 0.036 8 | 0.92 |
Table 6
Performance of improved CNN models with different fusion methods for monthly time-series data
| Model | MAE/(kg/hm2) | RMSE/(kg/hm2) | MAPE | R 2 |
|---|---|---|---|---|
| SVM-US-CNN | 48.918 5 | 58.501 2 | 0.211 0 | 0.25 |
| SVM-TCA-CNN | 45.172 2 | 56.643 1 | 0.189 9 | 0.58 |
| SVM-GRU-CNN | 41.448 2 | 55.486 7 | 0.173 6 | 0.69 |
| SVM-LSTM-CNN | 28.893 5 | 36.069 6 | 0.152 6 | 0.79 |
| SA-US-CNN | 10.524 5 | 14.188 6 | 0.048 1 | 0.83 |
| SA-TCA-CNN | 7.777 5 | 10.654 0 | 0.035 5 | 0.86 |
| SA-GRU-CNN | 12.201 6 | 17.046 4 | 0.052 0 | 0.91 |
| SA-LSTM-CNN | 12.183 3 | 17.698 3 | 0.052 4 | 0.90 |
| SE-US-CNN | 14.974 6 | 32.250 4 | 0.108 2 | 0.66 |
| SE-TCA-CNN | 11.568 8 | 25.953 3 | 0.083 2 | 0.71 |
| SE-GRU-CNN | 17.902 1 | 25.219 7 | 0.076 3 | 0.78 |
| SE-LSTM-CNN | 14.953 4 | 20.938 2 | 0.063 8 | 0.85 |
Table 7
Ablation study results of the SA-GRU-CNN model on half-monthly time-series data
| Model | R 2 | MAE/(kg/hm2) | RMSE/(kg/hm2) | MAPE |
|---|---|---|---|---|
| UAV-CNN | 0.37 | 24.90 | 31.45 | 0.106 |
| US-CNN fusion | 0.44 | 21.83 | 28.97 | 0.096 |
| SG-CNN | 0.71 | 15.17 | 18.63 | 0.064 |
| GRU-CNN | 0.90 | 12.53 | 17.25 | 0.056 |
| SA-GRU-CNN | 0.94 | 8.40 | 12.28 | 0.038 |
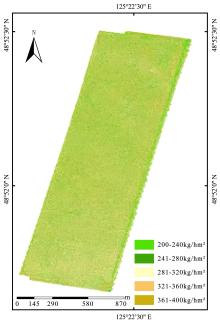
Fig. 15
Spatial distribution of predicted soybean yield for North 13, 14 and 15 Plots at Jianshan Farm in 2022
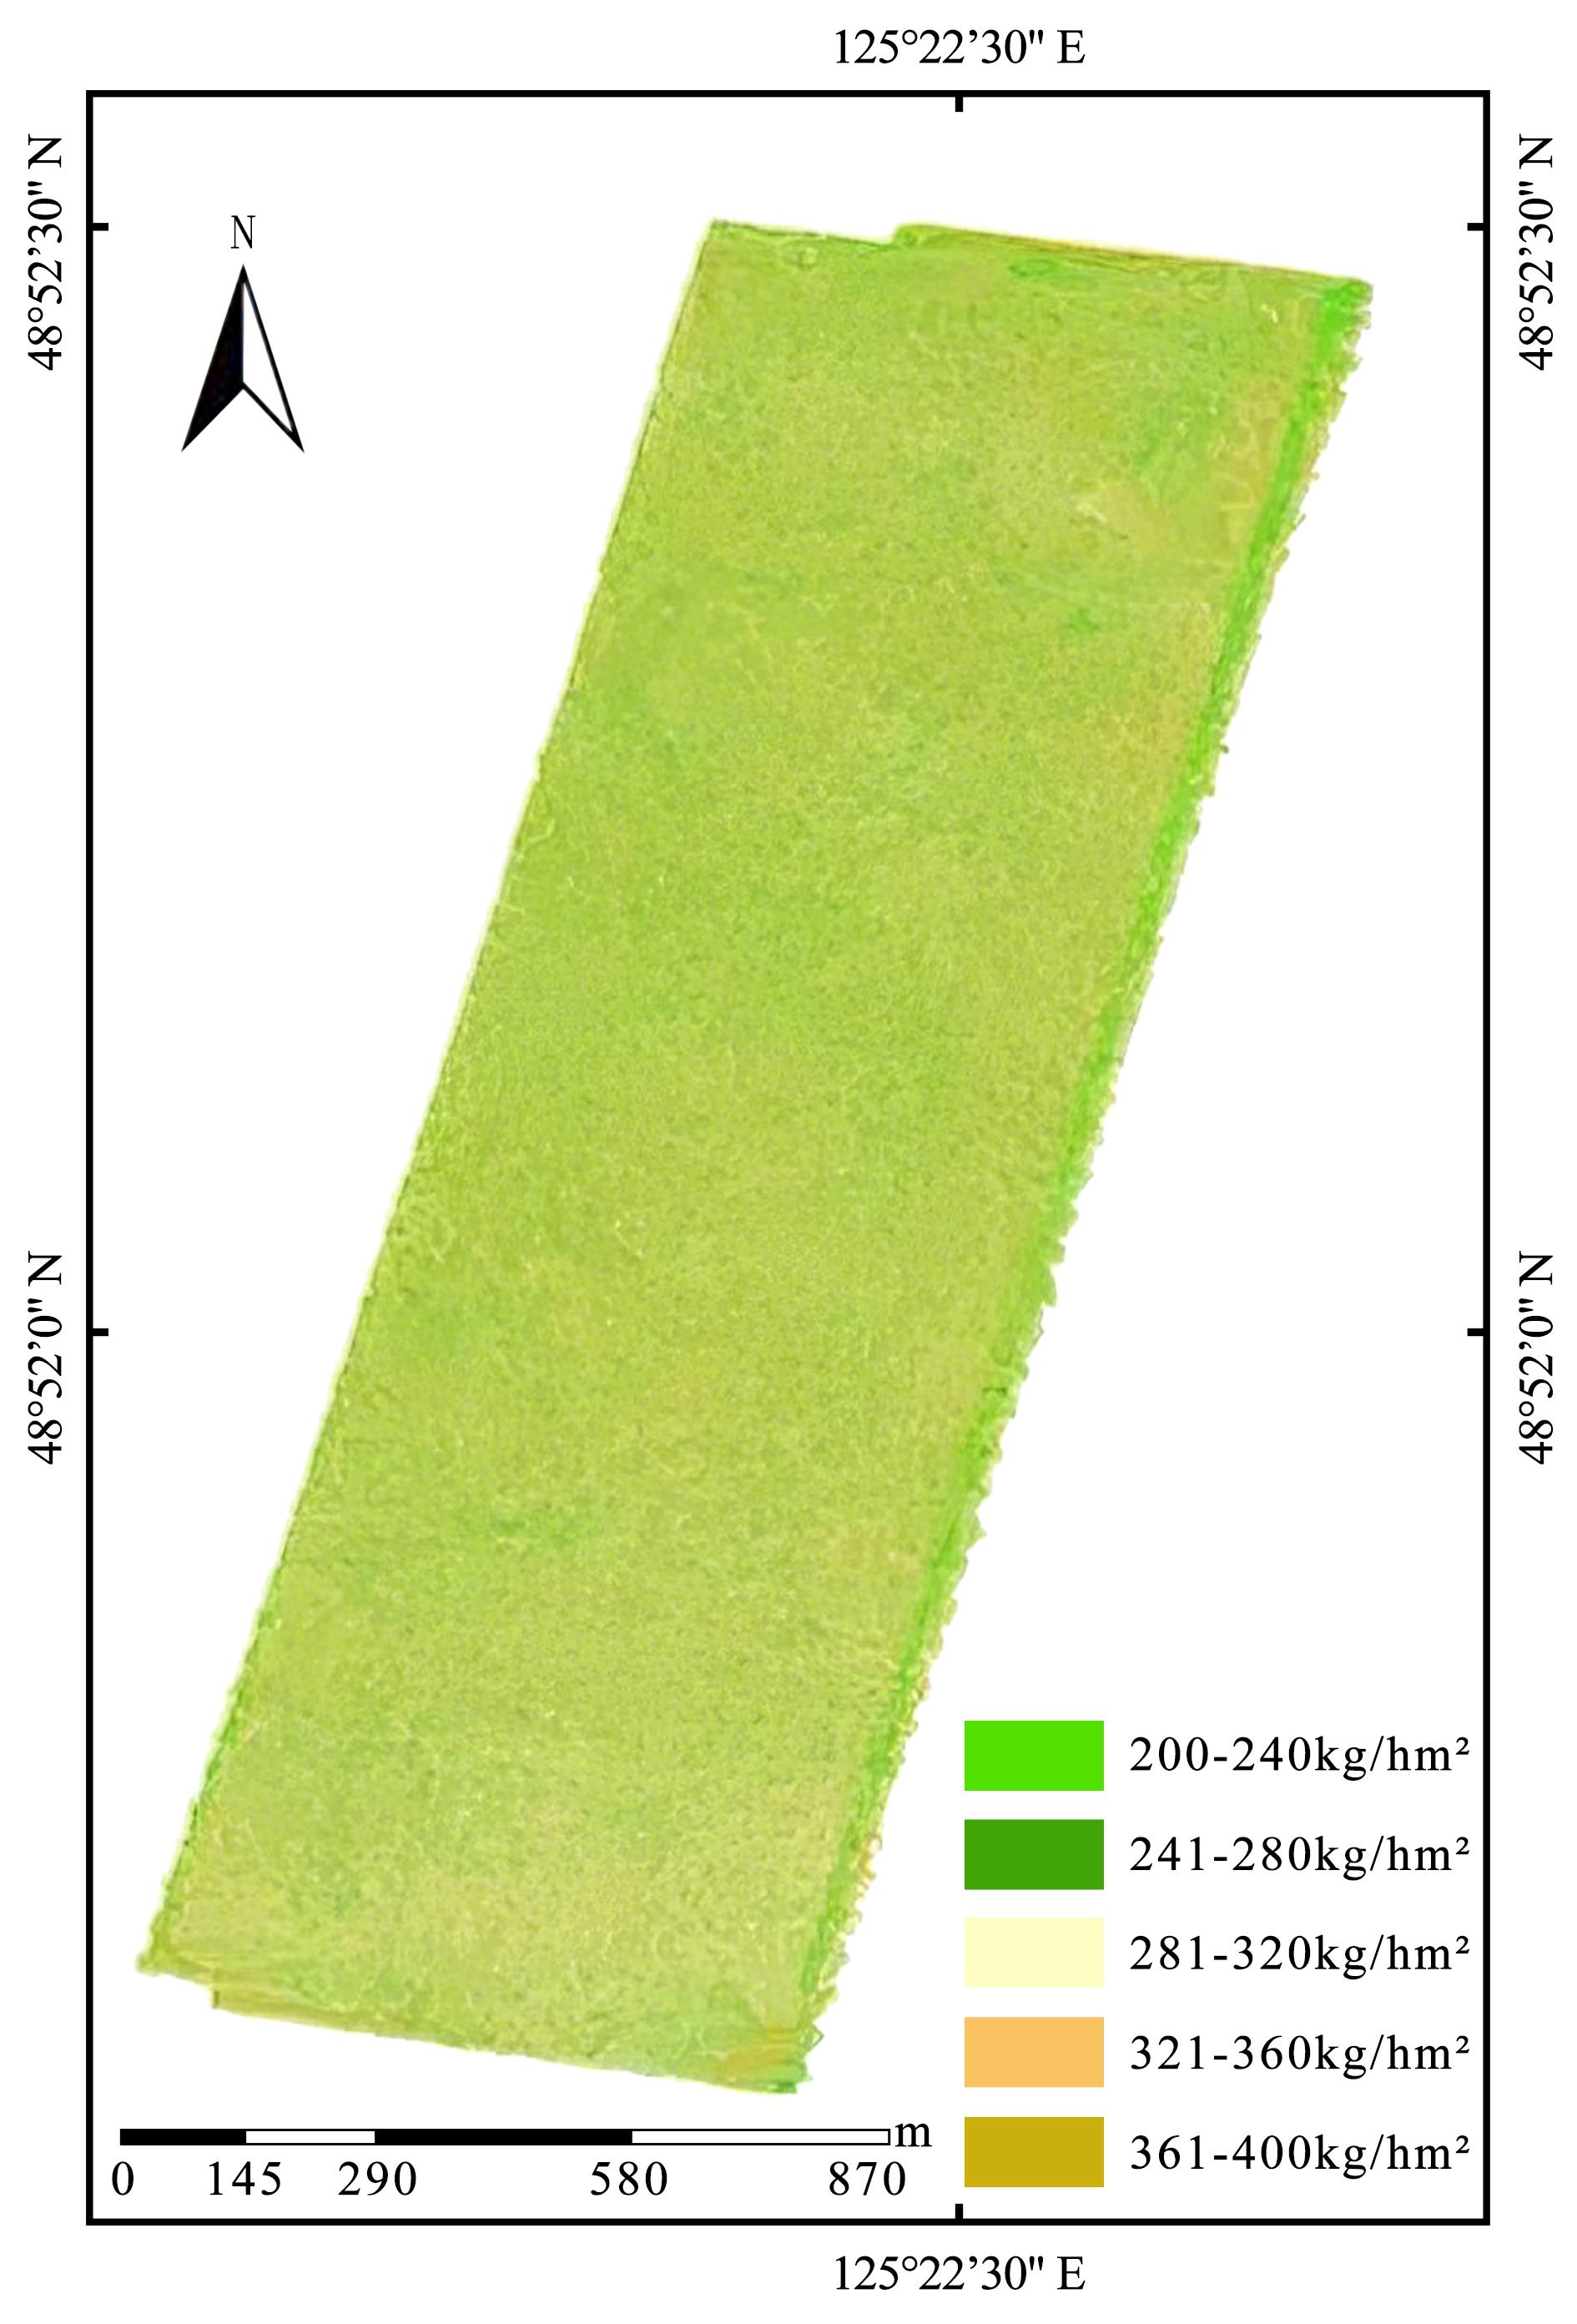
Table 8
Performance of improved CNN models with different fusion methods for half-monthly time-series data in 2023
| Model | MAE//(kg/hm2) | RMSE/(kg/hm2) | MAPE | R 2 |
|---|---|---|---|---|
| SVM-US-CNN | 43.456 2 | 55.967 5 | 0.196 6 | 0.37 |
| SVM-TCA-CNN | 34.683 2 | 44.326 8 | 0.153 4 | 0.67 |
| SVM-GRU-CNN | 31.867 4 | 39.326 5 | 0.157 6 | 0.72 |
| SVM-LSTM-CNN | 26.635 9 | 31.324 4 | 0.113 5 | 0.81 |
| SA-US-CNN | 15.786 5 | 14.964 2 | 0.056 8 | 0.84 |
| SA-TCA-CNN | 9.569 0 | 13.082 6 | 0.040 9 | 0.86 |
| SA-GRU-CNN | 8.253 8 | 9.603 9 | 0.036 5 | 0.93 |
| SA-LSTM-CNN | 16.326 5 | 15.834 5 | 0.073 2 | 0.82 |
| SE-US-CNN | 14.504 9 | 12.130 9 | 0.103 3 | 0.71 |
| SE-TCA-CNN | 10.236 9 | 12.026 0 | 0.086 3 | 0.73 |
| SE-GRU-CNN | 8.962 3 | 11.160 2 | 0.070 9 | 0.79 |
| SE-LSTM-CNN | 8.054 2 | 9.863 4 | 0.059 6 | 0.91 |
| [1] |
|
| [2] |
|
| [3] |
|
| [4] |
|
| [5] |
|
| [6] |
|
| [7] |
|
| [8] |
|
| [9] |
|
| [10] |
|
| [11] |
|
| [12] |
|
| [13] |
|
| [14] |
|
| [15] |
|
| [16] |
|
| [17] |
|
| [18] |
|
| [19] |
|
| [20] |
|
| [21] |
|
| [22] |
|
| [23] |
|
| [24] |
|
| [25] |
|
| [26] |
|
| [27] |
|
| [28] |
|
| [29] |
|
| [30] |
|
| [31] |
|
| [32] |
|
| [1] | WANG Yi, CUI Xitong, WANG Chen, XIONG Baowei, SHAO Guomin, WANG Wanying, CAO Pei, HAN Wenting. Field Maize Yield Prediction Model Based on Causal Inference and Machine Learningin Agricultural Fields [J]. Smart Agriculture, 2026, 8(2): 175-187. |
| [2] | WU Tingting, GUO Junrui, TAO Qiujie, CHEN Shihua, GUO Shanli. YOLOv8n-SSND: An Improved Lightweight Model for Aerial Chenopodium Chenopodium quinoa Willd. Spike Target [J]. Smart Agriculture, 2026, 8(2): 59-71. |
| [3] | SONG Mingxuan, BAI Bo, YANG Juntao, ZHANG Yutao, LI Sa, LI Zhenhai, WAN Shubo, LI Guowei. Robust UAV-Based Method for Peanut Plant Height Estimation Using Bare-Soil Invariant Constraints [J]. Smart Agriculture, 2025, 7(6): 124-135. |
| [4] | WANG Yinhui, ZHAO Anzhou, LI Dan, ZHU Xiufang, ZHAO Jun, WANG Ziqing. Construction and Evaluation of Lightweight and Interpretable Soybean Remote Sensing Identification Model [J]. Smart Agriculture, 2025, 7(6): 136-148. |
| [5] | CAO Yuying, LIU Yinchuan, GAO Xinyue, JIA Yinjiang, DONG Shoutian. LightTassel-YOLO: A Real-Time Detection Method for Maize Tassels Based on UAV Remote Sensing [J]. Smart Agriculture, 2025, 7(6): 96-110. |
| [6] | WANG Xuechang, XU Wenbo, ZHENG Yongjun, YANG Shenghui, LIU Xingxing, SU Daobilige, WANG Zimeng. Current Status and Development Trend of Low-Altitude Economy Industry in Orchards [J]. Smart Agriculture, 2025, 7(6): 35-57. |
| [7] | LAN Yubin, WANG Chaofeng, SUN Heguang, CHEN Shengde, WANG Guobin, DENG Xiaoling, WANG Yuanjie. Low-Altitude Technology Empowering Smart Agriculture: Technical System, Application Scenarios, and Challenge Recommendations [J]. Smart Agriculture, 2025, 7(6): 18-34. |
| [8] | CHEN Chengcheng, WU Jiaping, YU Helong. Frontiers and Future Trends in Data Sensing Technologies for Opto-Intelligent Agriculture: From Optical Sensors to Intelligent Decision Systems [J]. Smart Agriculture, 2025, 7(5): 1-16. |
| [9] | LI Fei, WANG Ziqiang, WU Jing, XIN Xia, LI Chunmei, XU Hubo. Imbalanced Hyperspectral Viability Detection of Naturally Aged Soybean Germplasm Based on Semi-Supervised Deep Convolutional Generative Adversarial Network [J]. Smart Agriculture, 2025, 7(5): 101-113. |
| [10] | GUO Qi, FAN Yixuan, YAN Xinhuan, LIU Xuemei, CAO Ning, WANG Zhen, PAN Shaoxiang, TAN Mengnan, ZHENG Xiaodong, SONG Ye. Advances in the Application of Multi-source Data Fusion Technology in Non-Destructive Detection of Apple [J]. Smart Agriculture, 2025, 7(4): 31-46. |
| [11] | LIU Jiajia, QIN Xiaojing, LI Qianchuan, XU Shiwei, ZHAO Jichun, WANG Yigang, XIONG Lu, LIANG Xiaohe. Forecasting Method for China's Soybean Demand Based on Improved Temporal Fusion Transformers [J]. Smart Agriculture, 2025, 7(4): 187-199. |
| [12] | ZHAO Peiqin, LIU Changbin, ZHENG Jie, MENG Yang, MEI Xin, TAO Ting, ZHAO Qian, MEI Guangyuan, YANG Xiaodong. Improvement of HLM Modeling for Winter Wheat Yield Estimation Under Drought Conditions [J]. Smart Agriculture, 2025, 7(2): 106-116. |
| [13] | ZHAO Bingting, HUA Chuanhai, YE Chenyang, XIONG Yuchun, QIAN Tao, CHENG Tao, YAO Xia, ZHENG Hengbiao, ZHU Yan, CAO Weixing, JIANG Chongya. Research Progress on Remote Sensing Monitoring and Intelligent Decision-Making Algorithms for Rice Production [J]. Smart Agriculture, 2025, 7(2): 57-72. |
| [14] | YAO Jianen, LIU Haiqiu, YANG Man, FENG Jinying, CHEN Xiu, ZHANG Peipei. Reconstruction of U.S. Regional-Scale Soybean SIF Based on MODIS Data and BP Neural Network [J]. Smart Agriculture, 2024, 6(5): 40-50. |
| [15] | PENG Xiaodan, CHEN Fengjun, ZHU Xueyan, CAI Jiawei, GU Mengmeng. Dense Nursery Stock Detecting and Counting Based on UAV Aerial Images and Improved LSC-CNN [J]. Smart Agriculture, 2024, 6(5): 88-97. |
| Viewed | ||||||
|
Full text |
|
|||||
|
Abstract |
|
|||||


