| [1] |
张锦华, 陈希. 中国食物分配特征与安全保障: 一个比较分析[J]. 中国农业大学学报(社会科学版), 2025, 42(4): 155-172.
|
|
ZHANG J H, CHEN X. Food distribution characteristics and food security in China: A comparative analysis[J]. Journal of China agricultural university (social sciences), 2025, 42(4): 155-172.
|
| [2] |
刘璐璐, 李建飞, 舒跃, 等. 我国大豆生产消费现状及提升自给率策略[J]. 中国油料作物学报, 2022, 44(2): 242-248.
|
|
LIU L L, LI J F, SHU Y, et al. Current situation of soybean production and consumption in China and strategies to improve self-sufficiency rate[J]. Chinese journal of oil crop sciences, 2022, 44(2): 242-248.
|
| [3] |
苗颖凤, 原野, 周正伟, 等. 汾渭平原农作物种植结构时空格局演变特征研究[J]. 干旱区地理, 2025, 48(6): 995-1005.
|
|
MIAO Y F, YUAN Y, ZHOU Z W, et al. Spatio-temporal pattern evolution characteristics of crop planting structure on Fenwei plain[J]. Arid land geography, 2025, 48(6): 995-1005.
|
| [4] |
杨喆, 褚琳, 肖燚彬, 等. 2017—2021年东北地区主要粮食作物覆盖类型时空演变及其影响因素[J]. 资源科学, 2023, 45(5): 966-979.
|
|
YANG Z, CHU L, XIAO Y B, et al. Spatiotemporal changes and driving forces of main grain crop planting types in Northeast China from 2017 to 2021[J]. Resources science, 2023, 45(5): 966-979.
|
| [5] |
潘耀忠, 李强子, 张锦水, 等. 主要农作物面积多维多尺度立体统计遥感调查技术研究进展[J]. 北京师范大学学报(自然科学版), 2025, 61(1): 118-125.
|
|
PAN Y Z, LI Q Z, ZHANG J S, et al. Summary and review of research progress on multi-dimensional and multi-scale stereoscopic statistical remote sensing survey technology for major crop areas[J]. Journal of Beijing normal university (natural science), 2025, 61(1): 118-125.
|
| [6] |
王利民, 刘佳, 姚保民, 等. 基于Rapideye数据的棉花特征光谱指数构建及类型识别[J]. 中国农业信息, 2019, 31(5): 25-37.
|
|
WANG L M, LIU J, YAO B M, et al. Construction and application of cotton characteristic spectral index based on Rapideye image[J]. China agricultural informatics, 2019, 31(5): 25-37.
|
| [7] |
CHEN H, LI H P, LIU Z, et al. A novel greenness and water content composite index (GWCCI) for soybean mapping from single remotely sensed multispectral images[J]. Remote sensing of environment, 2023, 295: ID 113679.
|
| [8] |
梁继, 郑镇炜, 夏诗婷, 等. 高分六号红边特征的农作物识别与评估[J]. 遥感学报, 2020, 24(10): 1168-1179.
|
|
LIANG J, ZHENG Z W, XIA S T, et al. Crop recognition and evaluationusing red edge features of GF-6 satellite[J]. Journal of remote sensing, 2020, 24(10): 1168-1179.
|
| [9] |
黄双燕, 杨辽, 陈曦, 等. 机器学习法的干旱区典型农作物分类[J]. 光谱学与光谱分析, 2018, 38(10): 3169-3176.
|
|
HUANG S Y, YANG L, CHEN X, et al. Study of typical arid crops classification based on machine learning[J]. Spectroscopy and spectral analysis, 2018, 38(10): 3169-3176.
|
| [10] |
鄂海林, 周德成, 李坤. 基于Sentinel 1/2和GEE的水稻种植面积提取方法: 以杭嘉湖平原为例[J]. 智慧农业(中英文), 2025, 7(2): 81-94.
|
|
E H L, ZHOU D C, LI K. Extracting method of the cultivation aera of rice based on Sentinel-1/2 and google earth engine (GEE): A case study of the Hangjiahu plain[J]. Smart agriculture, 2025, 7(2): 81-94.
|
| [11] |
屈炀, 袁占良, 赵文智, 等. 基于多时序特征和卷积神经网络的农作物分类[J]. 遥感技术与应用, 2021, 36(2): 304-313.
|
|
QU Y, YUAN Z L, ZHAO W Z, et al. Crop classification based on multi-temporal features and convolutional neural network[J]. Remote sensing technology and application, 2021, 36(2): 304-313.
|
| [12] |
魏永康,杨天聪,丁信尧,等. 基于不同空间分辨率无人机多光谱遥感影像的小麦倒伏区域识别方法[J]. 智慧农业(中英文), 2023, 5 (2): 56-67.
|
|
WEI Y K, YANG T C, DING X Y, et al. Wheat lodging area recognition method based on different resolution UAV multispectral remote sensing images[J]. Smart Agriculture, 2023, 5(2): 56-67.
|
| [13] |
牛朝阳, 高欧阳, 刘伟, 等. 光学遥感图像滑坡检测研究进展[J]. 航天返回与遥感, 2023, 44(3): 133-144.
|
|
NIU C Y, GAO O Y, LIU W, et al. Research progress of landslide detection in optical remote sensing images[J]. Spacecraft recovery & remote sensing, 2023, 44(3): 133-144.
|
| [14] |
张娟, 姚晓军, 陈进轩, 等. 基于无人机影像和深度学习技术的青海湖刚毛藻水华提取研究[J/OL]. 湖泊科学. (2025-06-11)[2025-07-12].
|
|
ZHANG J, YAO X J, CHEN J X, et al. Extraction of Cladophora blooms in Lake Qinghai based on unmanned aerial vehicle (UAV)imagery and deep learning techniques[J/OL]. Journal of lake sciences. (2025-06-11) [2025-07-12].
|
| [15] |
哈斯图亚, 陈仲新. 农业粮食体系数字转型期农业遥感研究进展与展望[J]. 遥感学报, 2025, 29(6): 1901-1917.
|
|
HA S T Y, CHEN Z X. The development and prospect of agricultural remote sensing in the digital transformation of agrifood systems[J]. National remote sensing bulletin, 2025, 29(6): 1901-1917.
|
| [16] |
康兆庭, 杨田, 柴军, 等. 基于临床和放射特征的列线图非侵入性预测低级别胶质瘤患者的1p/19q染色体共缺失突变[J]. 中国CT和MRI杂志, 2023, 21(1): 18-21.
|
|
KANG Z T, YANG T, CHAI J, et al. Radiomic and clinical feature-based nomogram: A novel non-invasive technique to predict chromosomal 1p/19q co-deletion mutations in patients with low-grade glioma[J]. Chinese journal of CT and MRI, 2023, 21(1): 18-21.
|
| [17] |
文刚, 高孟平, 高振宇, 等. 多因子协同作用下的云南省山火风险评估[J]. 广东电力, 2022, 35(4): 96-102.
|
|
WEN G, GAO M P, GAO Z Y, et al. Risk assessment of wildfires in Yunnan Province under the synergy of multi-factor[J]. Guangdong electric power, 2022, 35(4): 96-102.
|
| [18] |
张旷典, 郭孝玉, 康继, 等. 应用面向对象结合多时相哨兵-2A影像特征优选的毛竹林分布信息提取[J]. 东北林业大学学报, 2023, 51(1): 61-68, 87.
|
|
ZHANG K D, GUO X Y, KANG J, et al. Mapping moso bamboo forest distribution in a subtropical region using a random forest classifier and multi-temporal Sentinel-2A data[J]. Journal of northeast forestry university, 2023, 51(1): 61-68, 87.
|
| [19] |
王晨, 褚琳, 杨喆, 等. 东北地区大豆单产空间分异特征及其影响因素分析[J]. 农业工程学报, 2023, 39(21): 108-119.
|
|
WANG C, CHU L, YANG Z, et al. Spatial heterogeneity and determinants of soybean yield in Northeast China[J]. Transactions of the Chinese society of agricultural engineering, 2023, 39(21): 108-119.
|
| [20] |
COPENHAVER K, HAMADA Y, MUELLER S, et al. Examining the characteristics of the cropland data layer in the context of estimating land cover change[J]. ISPRS international journal of geo-information, 2021, 10(5): ID 281.
|
| [21] |
RIGALLI N, MONTERO BULACIO E, ROMAGNOLI M, et al. Near real-time soybean phenology detection using proximally sensed hyperspectral canopy reflectance and machine learning methods[J]. International journal of remote sensing, 2025, 46(9): 3526-3549.
|
| [22] |
陈岱. 基于Logistic回归模型的大兴安岭林火预测研究[J]. 林业资源管理, 2019(1): 116-122.
|
|
CHEN D. Prediction of forest fire occurrence in Daxing'an Mountains based on logistic regression model[J]. Forest resources management, 2019(1): 116-122.
|
| [23] |
刘威, 侯君, 唐龙泉, 等. 基于多中心的儿童颅脑创伤患者临床输血影响因素分析及预测模型构建[J]. 实用医学杂志, 2025, 41(4): 553-560.
|
|
LIU W, HOU J, TANG L Q, et al. Analysis of influencing factors of blood transfusion in children with traumatic brain injury and construction of prediction model: A multi-center retrospective study[J]. The journal of practical medicine, 2025, 41(4): 553-560.
|
| [24] |
邓元杰, 侯孟阳, 张晓, 等. 基于Logistic回归模型的陕西秦巴山区林地变化驱动力分析[J]. 南京林业大学学报(自然科学版), 2022, 46(1): 106-114.
|
|
DENG Y J, HOU M Y, ZHANG X, et al. Drivers of forestland change in the Qinba Mountain region of Shaanxi based on the Logistic regression model[J]. Journal of Nanjing forestry university (natural sciences edition), 2022, 46(1): 106-114.
|
| [25] |
沈宇, 李强子, 杜鑫, 等. 玉米大豆生长中后期遥感辨识的指示性特征研究[J]. 遥感学报, 2022, 26(7): 1410-1422.
|
|
SHEN Y, LI Q Z, DU X, et al. Indicative features for identifying corn and soybean using remote sensing imagery at middle and later growth season[J]. National remote sensing bulletin, 2022, 26(7): 1410-1422.
|
| [26] |
YIN L K, YOU N S, ZHANG G L, et al. Optimizing feature selection of individual crop types for improved crop mapping[J]. Remote sensing, 2020, 12(1): ID 162.
|
| [27] |
刘佳, 王利民, 滕飞, 等. RapidEye卫星红边波段对农作物面积提取精度的影响[J]. 农业工程学报, 2016, 32(13): 140-148.
|
|
LIU J, WANG L M, TENG F, et al. Impact of red-edge waveband of Rapid Eye satellite on estimation accuracy of crop planting area[J]. Transactions of the Chinese society of agricultural engineering, 2016, 32(13): 140-148.
|
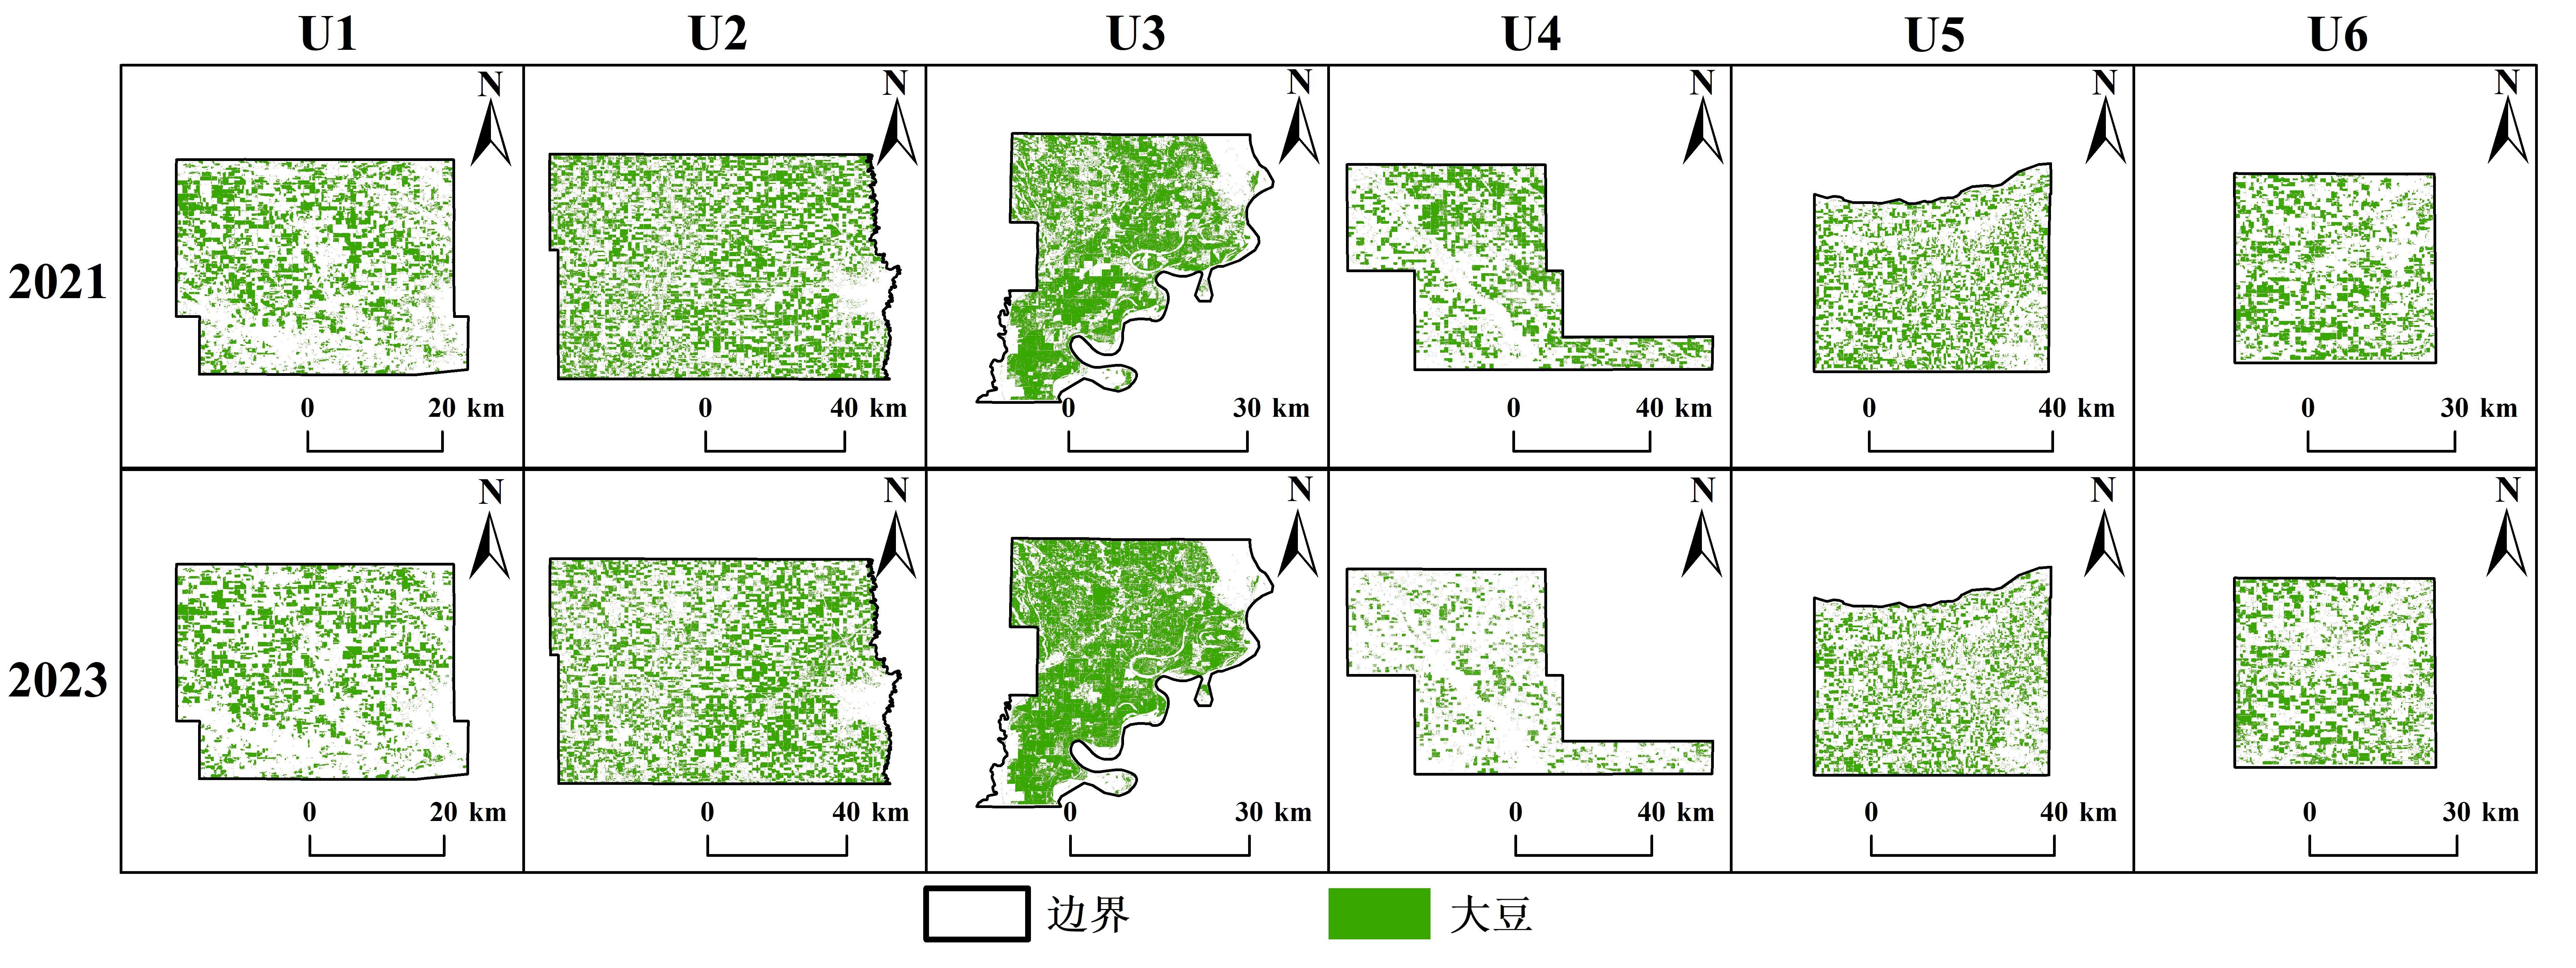
 ), 赵军5, 王紫晴6